A Logical Antidote to Indexing
By Ehren Stanhope
March 2015
KEY POINTS:
- A disciplined implementation of fundamental factors can outperform common indexes.
- Corporate executives are poor allocators of shareholder capital.
- Dilution is an invisible but persistent headwind for passive investors.
- Focus on undervalued companies rewarding shareholders through dividends and buybacks.
- Harness the advantages of quality to control for poor management decisions.
- This is not a theoretical exercise.
INTRODUCTION
Indexing provides a compelling pitch to individual and institutional investors. It offers a strategy that will never underperform in a down market, has low expenses, and is tax efficient. The “cost” is capitulation that the investor will never outperform—in up or down markets. The genius of the passive masterminds was changing the paradigm by which investors view performance instead of competing against a saturated marketplace of underperforming active managers. The problem that they did not solve for is human behavior.
Studies have demonstrated that investors habitually buy into and sell out of funds at the wrong times, resulting in actual investor returns lower than standard performance measurements indicate.1 Institutional investors are not immune. Far too often, active managers lack the fortitude to stick to their strategy in turbulent markets, which results in lower investor returns. We believe that the disciplined implementation of indexes is what truly sets them apart from most active managers.
For the most part, indexing is nothing more than a single-factor strategy betting on the largest companies. By simply tweaking the cap-weighted construct of the S&P 500 Index to consider an equal-weighted opportunity set, one could access a strategy that since 1990 has outperformed its cap-weighted counterpart by 2.4 percent per year. Yet, for some reason cap-weighted index funds outweigh the assets of their equal-weighted cousins by many multiples.
If passive investors actually drilled into the components of commonly held indexes, they would not be happy with what they find. Currently, 22 percent of the S&P 500 Index is comprised of stocks that diluted their investors by five percent in 2014. Countless stocks are manipulating earnings, are overly levered, or are priced at astronomical valuations. Typically, these unfavorable characteristics are the byproduct of capital allocation choices made by corporate management. It belies common sense as to why anyone would want to own some of the names held in common indexes in such large proportions.
We believe that there exist a number of logical factors that have the ability to provide superior absolute, risk-adjusted, and consistent return when implemented in disciplined, rigorously researched, and concentrated portfolios that are very different than “the market.” Below, we discuss our research on a disciplined multi-factor approach to selecting stocks that acknowledges and adjusts for the pitfalls of poor corporate management decision making that hurt investor returns.
Corporate Executives are Poor Allocators of Shareholder Capital
In theory, management will seek to maximize shareholder value by allocating capital to activities that generate the highest shareholder return. In practice, there is a wide chasm between what management perceives to enhance value and what actually boosts investor return.
Management has a limited menu of options for allocating firm capital: expand existing businesses, acquire new businesses, pay down debt, and return capital to shareholders.2 We can approximate the impact of these choices on investor return by looking at changes in capital expenditures, goodwill, debt, and shares outstanding plus dividends, respectively. Large increases in capital expenditures signal increased investments in the current business—expansion. Goodwill typically measures the amount a company overpaid for another business—expensive acquisition. Debt reduction signals a return of capital to debt holders, not owners.3 And finally, dividends and share buybacks signal a return of capital to shareholders.
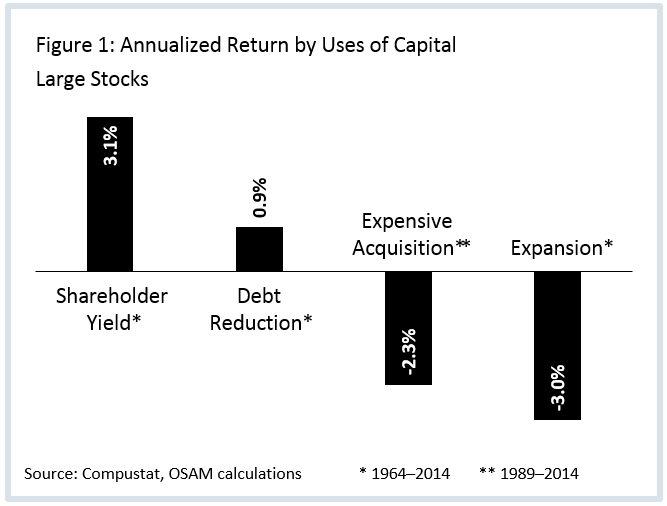
The track record of management that aggressively pursues acquisition and expansion is not all that impressive. Companies engaged in acquisition and expansion underperformed by 2.3 percent and 3.0 percent annualized, respectively, from 1964–2014.4 Companies engaged in large debt reduction tend to outperform marginally. Companies that reward shareholders through strong Shareholder Yield—the combination of dividends and net share buybacks—are the clear winners. They outperform by 3.1 percent per year.
Dilution is an Invisible but Persistent Headwind for Index Investors
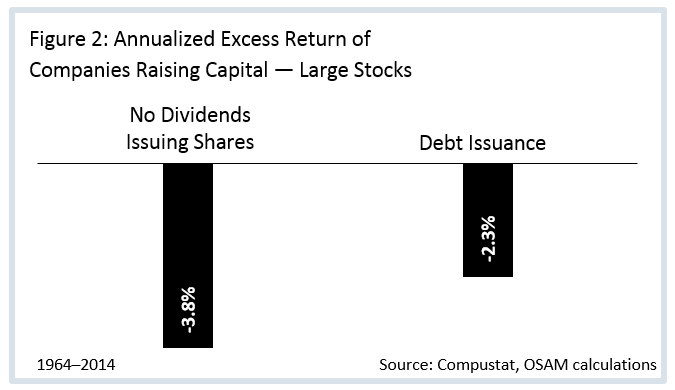
If expensive acquisition and expansion activities lead to poor investor return, we should expect that companies raising capital through debt and equity issuance to finance those activities would also perform poorly. It turns out that is exactly the case. The quintile of stocks with the greatest increases in debt underperform Large Stocks by 2.3 percent. Companies with the worst Shareholder Yield—paying no dividends and diluting shareholders through share issuance—underperform by a greater 3.8 percent per year.
While it is clear that investors want to avoid companies raising excessive amounts of debt, understanding the impact of dilution—negative Shareholder Yield—is often overlooked, yet critically important to stock selection.
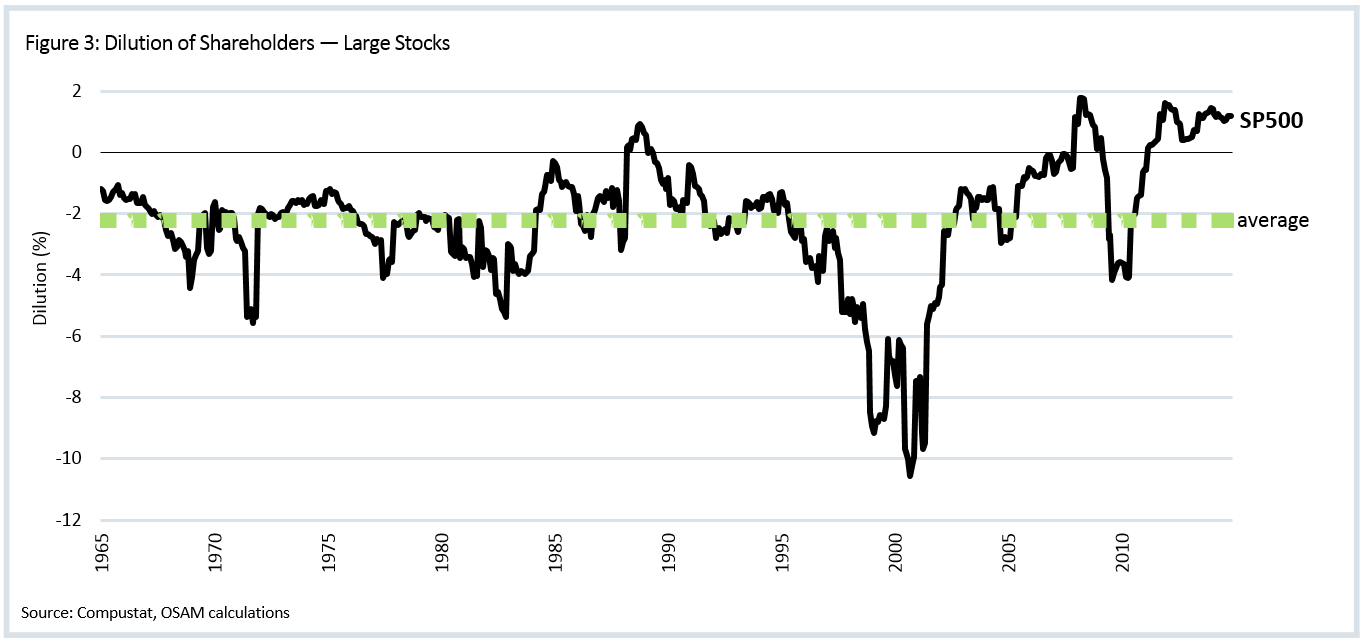
Dilution is a negative yield on investment that acts as a headwind by reducing an investor’s claim on the future earnings of the company. Its influence is pervasive. The average dilution of investors in the S&P 500 Index for the five decades ending 2014 has been 2.2 percent per year.5 Few of us would entertain the idea of purchasing a 3,000-square-foot home that shrinks by 66-square-feet per year, yet passive investors do just that. The implication for investor returns is clear. A portfolio invested in the worst diluters on the S&P 500 would have underperformed the index by 3.4 percent annualized from 1964–2014.6
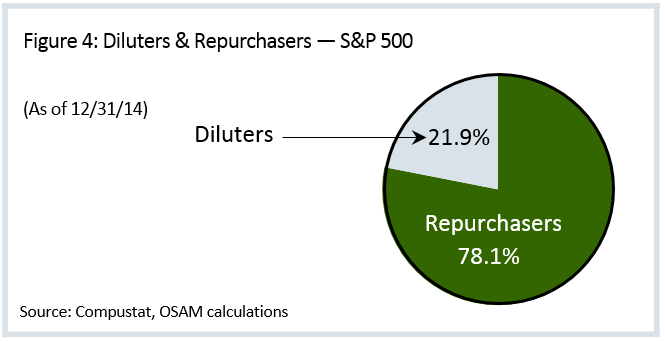
Diluters have accounted for 58 percent of the S&P 500 Index over the last five decades with a peak of 84 percent in 1977. However, in 1982 the SEC passed Rule 10b-18, which provided “safe harbor” for companies to freely repurchase shares without fear of market manipulation lawsuits.7 The number of diluters has steadily come down to its present level of 22 percent for the S&P 500 Index. As of year-end 2014, 171 members of the S&P 500 were net issuers of shares by on average 5.0 percent over the trailing 12 months.
In Large Stocks, we will want to focus on selecting the best stocks by Shareholder Yield.
Use Shareholder Yield for Selection
Shareholder Yield is one of the most effective uses of capital in the Large Stock space. It combines the two most tangible ways management can prove their interests are aligned with shareholders—dividends and buybacks.
Companies repurchasing shares benefit from a tailwind associated with share count reduction and dividend payments. When measuring buyback activity, there are three pitfalls that should be avoided.8
- Use “net” buybacks when measuring buybacks. Sometimes companies repurchase and issue shares at the same time. “Gross” buybacks do not take into account share issuance, are less instructive than net buybacks, and should be ignored.
- Share count, among other shenanigans, can be used to manage earnings per share (EPS)—the metric most closely watched by Wall Street analysts. Objective quality characteristics can be used to avoid companies employing these tactics.
- Share repurchases are commonly interpreted as a signal that management believes their stock is inexpensive. Instead of relying on management’s opinion of “intrinsic” value, we advocate an objective assessment of value to side-step companies repurchasing expensive shares.
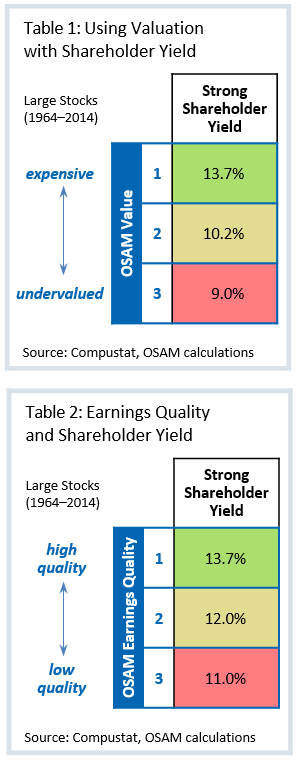
Shareholder Yield, when combined with aspects of quality and valuation, will play a central role in stock selection. Table 1 evaluates the performance of the top tercile of stocks by Shareholder Yield, but then divides those stocks further based on their valuation. Clearly, investing in expensive stocks — even though they have strong Shareholder Yield — is a losing proposition. We perform a similar exercise to evaluate the interaction of Earnings Quality within Shareholder Yield (see Table 2). Here we find that benefits exist to avoiding low-quality and focusing on high-quality stocks.
Incorporate an Objective Assessment of Valuation
Investing in undervalued stocks is an almost universal investment maxim. The key problem is determining what constitutes discounted valuation. A single-factor approach using classic value factors like price-to-book alone is not dynamic enough. Just as value and growth styles move in and out of favor, such is the case with factors. Price-to-book, for example, has generated outperformance over the last several decades but had underperformed for a long 36-year stretch by two percent annualized from 1927–1963.9
Single-factor models, as is the case with most “Smart Beta” strategies, tend to view the market through one lens, which does not account for the interactive effects as factors come in and out of favor. Single-factor models require the investor to make two critical decisions: (1) when and (2) how much to allocate to a factor. As referenced above, experts have a horrendous track record at timing investments and allocating capital.
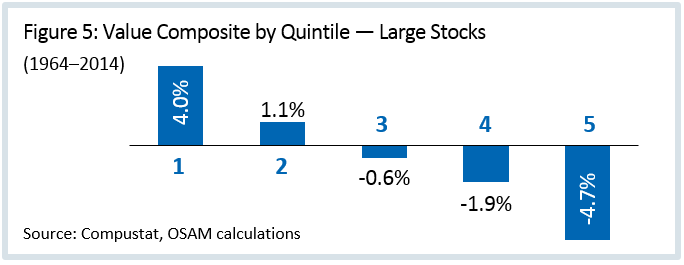
We believe in the objective assessment of valuation based on multiple factors—sales, earnings, and cash flow—that we refer to as our Value composite. We have found that an equal-weighted multi-factor approach outperforms its underlying constituents 83 percent of the time in rolling 10-year periods.
In Figure 5, we divide stocks into quintiles by Value composite score. The least expensive stocks are in quintile 1, while the most expensive are in quintile 5. Not only do the most expensive stocks underperform by 4.7 percent per year, but they do so 87 percent of the time in rolling 5-year periods from 1964–2014. Invest in expensive stocks at your own peril.
Our Value composite will be used to exclude companies that are repurchasing shares at expensive prices. Value will be paired with Quality to eliminate the worst offenders before selecting stocks with the strongest Shareholder Yield.
Control for Poor Management Decisions by Harnessing the Advantages of Quality
Management makes poor capital allocation decisions and frequently engages in accounting shenanigans to fictitiously boost EPS. To avoid companies using these practices, we employ a Quality overlay that includes three themes: Financial Strength, Earnings Quality, and Earnings Growth. Financial Strength identifies companies that are overly levered, are issuing debt and equity, and have poor cash flow coverage ratios. Earnings Growth assesses profitability and the trend in the growth of earnings. Earnings Quality measures whether earnings are driven by cash generation or non-cash accruals.
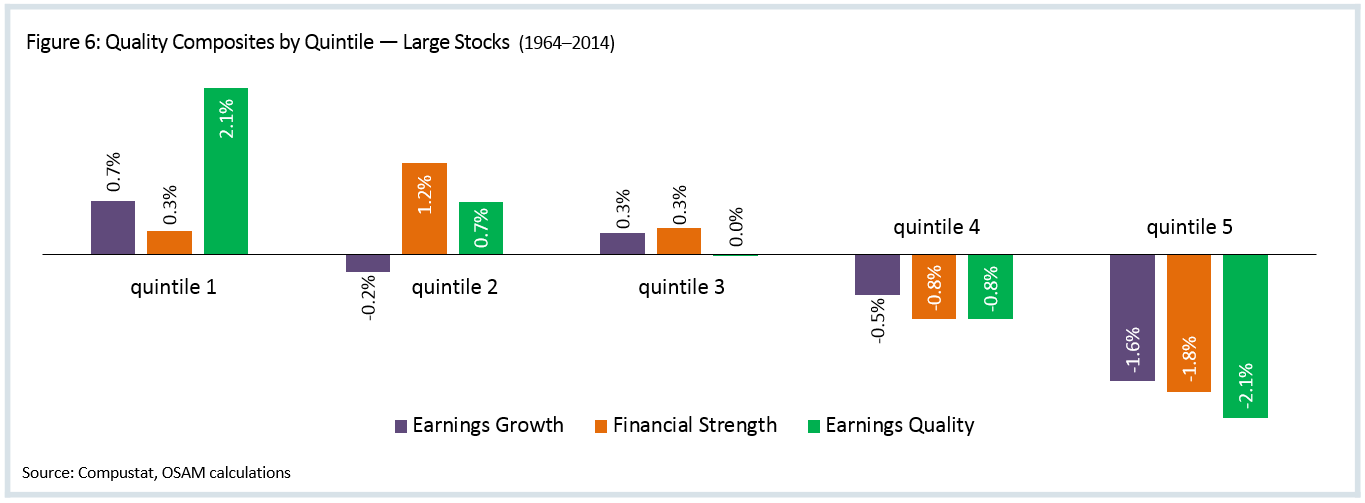
As we did with the Value composite, we evaluate the performance of stocks from best (quintile 1) to worst (quintile 5) according to each theme. In doing so, we generally find that the greatest benefit lies in avoiding stocks that rank poorly. Stocks in the worst quintile of Earnings Quality, for example, underperform by 2.1 percent per year. With a batting average of just 24 percent in rolling 5-year periods, stocks with the worst Earnings Quality lose to Large Stocks 76 percent of the time. We see similar results for Financial Strength and Earnings Growth.
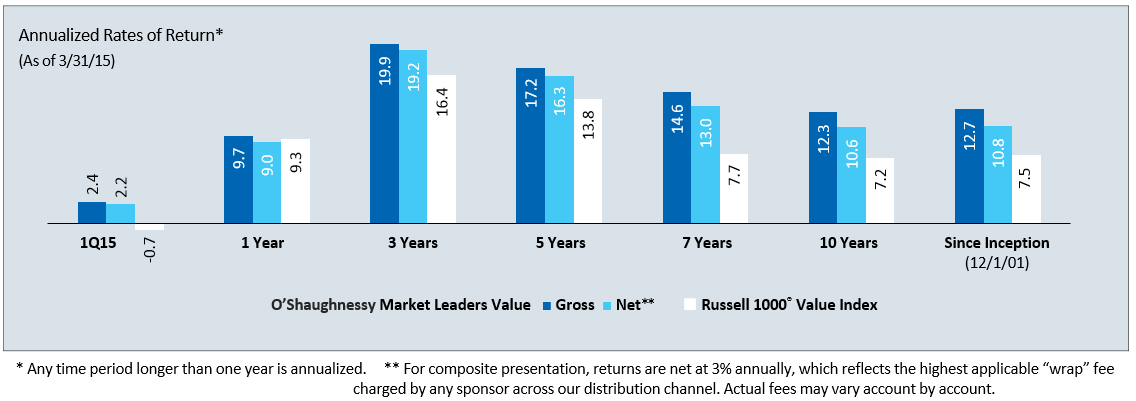
Shareholder Yield + Quality + Valuation = O’Shaughnessy Market Leaders ValueSM
Our U.S. large cap value strategy, Market Leaders Value, is predicated on the themes of Quality, Valuation, and Shareholder Yield discussed above. We start with a universe of Large Stocks. To avoid the pitfalls associated with management teams that are allocating capital poorly and/or buying back shares for the wrong reasons, we use the themes of Earnings Quality, Financial Strength, and Earnings Growth to screen out the worst offenders. We pair this assessment of Quality with our Value composite to avoid companies implementing buyback programs when their shares are expensive. Our research (see Figure 7) indicates that a focus on Quality and Value historically generates 3.4 percent annualized outperformance relative to the Russell 1000® Value benchmark.
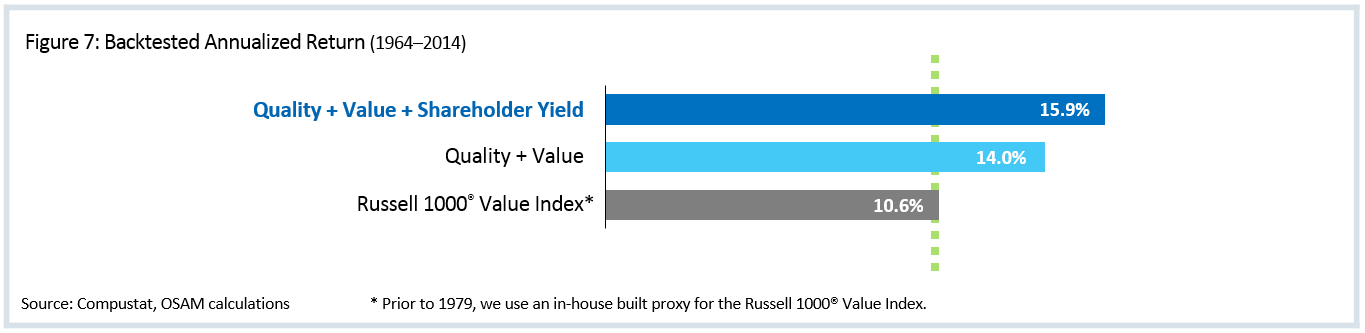
From this high-quality and discounted group, we further concentrate on the stocks with the greatest Shareholder Yield. The inclusion of Shareholder Yield suggests an additional 1.9 percent of outperformance relative to the benchmark.
Finally, while most passive indexes constitute their portfolios annually, we have found that regularly refreshing portfolios enables dynamic movement into and out of opportunities in the market that align with the themes our research demonstrates to be the most effective.
This is not a Purely Theoretical Exercise!
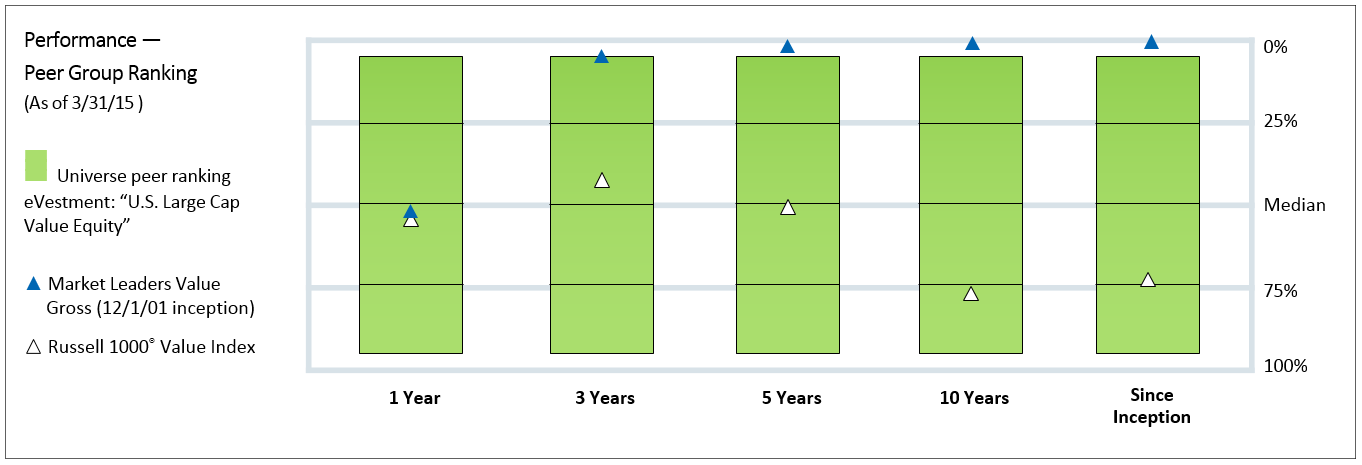
We have been implementing this approach for more than 13 years in client portfolios, with phenomenal livetime results relative to strategy benchmarks and peers. Our Market Leaders Value strategy has outperformed its Russell 1000® Value benchmark in 121of 125 rolling 3-year periods since inception (December 2001) for a 97-percent win rate—with an average positive excess return of 4.9 percent (gross of fees). The strategy is a first percentile performer (since inception) relative to its eVestment U.S. Large Cap Value peer group.
Our team has been able to achieve these results because of a disciplined implementation that checks human emotion at the door and does not deviate from a heavily-researched investment process. We harness the advantages of Quality to avoid companies that pursue historically poor capital allocation decisions and dilute their investors. We then select stocks using logical factors that have demonstrated the ability to provide superior absolute, risk-adjusted, and consistent return. We believe a disciplined, evergreen approach predicated on multiple factors eliminates the complications associated with single-factor selection, allocation, and timing that is a key drawback of Smart Beta and indexing methodologies.
Footnotes:
1 Russel Kessel, “Mind the Gap 2014” http://www.morningstar.com/advisor/t/88015528/mind-the-gap-2014.htm
2 Patrick O’Shaughnessy, “Talk is Cheap: Why CEO’s Actions Speak Louder Than Their Words” (May 6, 2014) http://www.millennialinvest.com/blog/2014/5/6/talk-is-cheap-why-ceos-actions-speak-louder-than-their-words
3 We approximate acquisitions and expansion by focusing on the quintile of stocks with the greatest year-over-year increase in goodwill and capital expenditures, respectively. We approximate debt reduction by focusing on the quintile of stocks with the greatest year-over-year decrease in debt outstanding.
4 Large Stocks is an equal-weighted universe consisting of stocks traded on U.S. exchanges with an inflation-adjusted market cap greater than average.
5 Prior to 1990 and 1979, we use an in-house built proxy for the S&P 500 Index and Russell 2000® Index, respectively.
6 Diluters are defined as the quintile of stocks that have the largest year-over-year increase in net shares outstanding.
7 See page 2 in http://osam.com/pdf/Commentary_ThePowerofShareRepurchases-June-2014.pdf
8 See page 5 in http://osam.com/pdf/Commentary_ThePowerofShareRepurchases-June-2014.pdf
9 James P. O’Shaughnessy, What Works on Wall Street, Fourth Edition (Nov. 2011)
Composite Performance Summary
For the full composite performance summary of Market Leaders Value, please follow this link: http://www.osam.com/pDf/osam_factsheet_mlv.pdf#page=3&view=Fit
General Legal Disclosure/Disclaimer and Backtested Results
The material contained herein is intended as a general market commentary. Opinions expressed herein are solely those of O’Shaughnessy Asset Management, LLC and may differ from those of your broker or investment firm.
Please remember that past performance may not be indicative of future results. Different types of investments involve varying degrees of risk, and there can be no assurance that the future performance of any specific investment, investment strategy, or product (including the investments and/or investment strategies recommended or undertaken by O’Shaughnessy Asset Management, LLC), or any non-investment related content, made reference to directly or indirectly in this piece will be profitable, equal any corresponding indicated historical performance level(s), be suitable for your portfolio or individual situation, or prove successful. Due to various factors, including changing market conditions and/or applicable laws, the content may no longer be reflective of current opinions or positions. Moreover, you should not assume that any discussion or information contained in this piece serves as the receipt of, or as a substitute for, personalized investment advice from O’Shaughnessy Asset Management, LLC. Any individual account performance information reflects the reinvestment of dividends (to the extent applicable), and is net of applicable transaction fees, O’Shaughnessy Asset Management, LLC’s investment management fee (if debited directly from the account), and any other related account expenses. Account information has been compiled solely by O’Shaughnessy Asset Management, LLC, has not been independently verified, and does not reflect the impact of taxes on non-qualified accounts. In preparing this report, O’Shaughnessy Asset Management, LLC has relied upon information provided by the account custodian. Please defer to formal tax documents received from the account custodian for cost basis and tax reporting purposes. Please remember to contact O’Shaughnessy Asset Management, LLC, in writing, if there are any changes in your personal/financial situation or investment objectives for the purpose of reviewing/evaluating/revising our previous recommendations and/or services, or if you want to impose, add, or modify any reasonable restrictions to our investment advisory services. Please Note: Unless you advise, in writing, to the contrary, we will assume that there are no restrictions on our services, other than to manage the account in accordance with your designated investment objective. Please Also Note: Please compare this statement with account statements received from the account custodian. The account custodian does not verify the accuracy of the advisory fee calculation. Please advise us if you have not been receiving monthly statements from the account custodian. Historical performance results for investment indices and/or categories have been provided for general comparison purposes only, and generally do not reflect the deduction of transaction and/or custodial charges, the deduction of an investment management fee, nor the impact of taxes, the incurrence of which would have the effect of decreasing historical performance results. It should not be assumed that your account holdings correspond directly to any comparative indices. To the extent that a reader has any questions regarding the applicability of any specific issue discussed above to his/her individual situation, he/she is encouraged to consult with the professional advisor of his/her choosing. O’Shaughnessy Asset Management, LLC is neither a law firm nor a certified public accounting firm and no portion of the newsletter content should be construed as legal or accounting advice. A copy of the O’Shaughnessy Asset Management, LLC’s current written disclosure statement discussing our advisory services and fees is available upon request.
Historical performance results for investment indices and/or categories have been provided for general comparison purposes only, and generally do not reflect the deduction of transaction and/or custodial charges, the deduction of an investment management fee, nor the impact of taxes, the incurrence of which would have the effect of decreasing historical performance results. It should not be assumed that any account holdings would correspond directly to any comparative indices. Account information has been compiled solely by OSAM, has not been independently verified, and does not reflect the impact of taxes on non-qualified accounts. In preparing this presentation, OSAM has relied upon information provided by the account custodian and/or other third party service providers. OSAM is a Registered Investment Adviser with the SEC and a copy of our current written disclosure statement discussing our advisory services and fees remains available for your review upon request.
Hypothetical performance results shown on the preceding pages are backtested and do not represent the performance of any account managed by OSAM, but were achieved by means of the retroactive application of each of the previously referenced models, certain aspects of which may have been designed with the benefit of hindsight.
The hypothetical backtested performance does not represent the results of actual trading using client assets nor decision-making during the period and does not and is not intended to indicate the past performance or future performance of any account or investment strategy managed by OSAM. If actual accounts had been managed throughout the period, ongoing research might have resulted in changes to the strategy which might have altered returns. The performance of any account or investment strategy managed by OSAM will differ from the hypothetical backtested performance results for each factor shown herein for a number of reasons, including without limitation the following:
- Although OSAM may consider from time to time one or more of the factors noted herein in managing any account, it may not consider all or any of such factors. OSAM may (and will) from time to time consider factors in addition to those noted herein in managing any account.
- OSAM may rebalance an account more frequently or less frequently than annually and at times other than presented herein.
- OSAM may from time to time manage an account by using non-quantitative, subjective investment management methodologies in conjunction with the application of factors.
- The hypothetical backtested performance results assume full investment, whereas an account managed by OSAM may have a positive cash position upon rebalance. Had the hypothetical backtested performance results included a positive cash position, the results would have been different and generally would have been lower.
- The hypothetical backtested performance results for each factor do not reflect any transaction costs of buying and selling securities, investment management fees (including without limitation management fees and performance fees), custody and other costs, or taxes – all of which would be incurred by an investor in any account managed by OSAM. If such costs and fees were reflected, the hypothetical backtested performance results would be lower.
- The hypothetical performance does not reflect the reinvestment of dividends and distributions therefrom, interest, capital gains and withholding taxes.
- Accounts managed by OSAM are subject to additions and redemptions of assets under management, which may positively or negatively affect performance depending generally upon the timing of such events in relation to the market’s direction.
- Simulated returns may be dependent on the market and economic conditions that existed during the period. Future market or economic conditions can adversely affect the returns.
The dividend yield is a gross indicated yield. There is no guarantee that the rate of dividend payment will continue and the income derived is subject to taxes and expenses which will impact the actual yield experience of each investor.


