Alpha or Assets? Factor Alpha vs. Smart Beta
By Patrick O’Shaughnessy
April 2016
More and more investors are buying “factor”-based strategies, which invest using measures like valuation and low volatility. However, the most popular strategies are applying factors the wrong way. We believe that strategies should be built for alpha, not scale—but the asset management industry has gone in the opposite direction.
Most factor-based strategies—commonly called Smart Beta—have hundreds of holdings and high overlap with their market benchmark. The far more powerful way to apply factors is to use them first to avoid large chunks of the market and then build more differentiated portfolios of stocks with only the most attractive overall factor profiles. While not as scaleable as Smart Beta, this alpha-oriented approach has led to much better results for investors.
Professionally-managed investment strategies have two components: an investing component (seeking alpha) and a business component (seeking assets). Outperformance is one goal, scale is another. Factors—like valuation, momentum, quality, and low volatility—have been largely applied by firms with the business in mind. In the asset management business, two variables matter: fees and assets. Smart Beta has risen to prominence alongside index funds and ETFs, and indexing has significantly reduced fees across the industry. With fees lower across the board, scale becomes a more important consideration for asset managers when deciding which strategies to offer the investing public. When fees fall, assets need to rise. For assets to rise across a business, the strategies offered need to be able to accommodate more invested money.
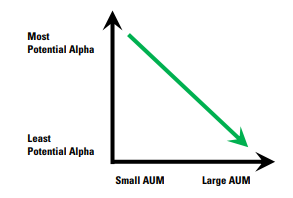
More assets may be good for the business but it's often bad for returns. As the level of assets under management rise, the investable universe of stocks shrinks, trading impact costs rise, and the potential for alpha erodes. In asset management, we find diseconomies of scale—as mutual funds and hedge funds get larger, their performance tends to suffer.1, 2
1 Joseph Chen, Harrison Hong, Ming Huang, Jeffrey D. Kubik; “Does Fund Size Erode Mutual Fund Performance? The Role of Liquidity and Organization” (Dec. 2004) 2 Andrea Gentilini, “How AUM Growth Inhibits Performance” (May 2014)
Of course, fees matter a great deal and the nearly free access to broad market index funds is a wonderful thing. But management fees are one thing and key factors like valuation another. We would rather pay 0.75 percent for an S&P 500 index fund trading at 12 times normalized earnings than 0.05 percent for the same market trading at 25 times earnings, which it does as of March 2016. To gain a large advantage versus the market, on factors like valuation or shareholder yield, you must build strategies with an emphasis on alpha—and the consistency of alpha—above all else.
To achieve what we call Factor Alpha, we believe that investors should use multiple unique factors to build a more concentrated portfolio of stocks with the highest-scoring factor profiles. That means not owning wide swaths of the market. Compared to Smart Beta, focusing on Factor Alpha allows for better returns and significantly better factor advantages. In the rest of this paper, we explore the dangers of scale—and widespread adoption of any strategy—and offer an alternative solution for using factors in the investment process.
Watch Scale Eat Returns
The difference between any portfolio and the market is determined by (1) what stocks you own and (2) how you weight those stocks in a portfolio. To show the impact that these two variables have, we start with the constituents of the S&P 5003 and create different portfolios based on a single factor that has worked well historically— valuation4 —to demonstrate the effect of moving further and further away from the index. We use this basic example not to recommend this as a strategy but rather to show the effects of both concentration and weighting scheme.
What We Tested
We show three versions of this strategy:
Version 1 sorts all stocks in the S&P 500 on each date by valuation and builds portfolios from 50 to 500 stocks (so the 50-stock version would be the 50 cheapest stocks on that date, and so on). Positions are equally-weighted (e.g., two percent each in the 50-stock portfolio or one percent each in the 100-stock portfolio).
Version 2 takes the same portfolios with the same stocks (from 50 to 500 holdings) but weights the positions according to market cap. This method can create very top heavy weightings in the more concentrated portfolios (e.g., IBM at 11.3 percent of the most recent 50-stock portfolio).
Version 3 forms the portfolios using a market cap-adjusted valuation factor,5 which multiplies a stock’s weight in the index by its relative valuation. This cap-adjusted value factor rewards companies that are big and cheap and penalizes companies that are small and expensive. Again we use the factor to build portfolios from 50 to 500 stocks. This is the most scaleable version of the value strategy, whose holdings look a lot like major value indexes.
What We Found
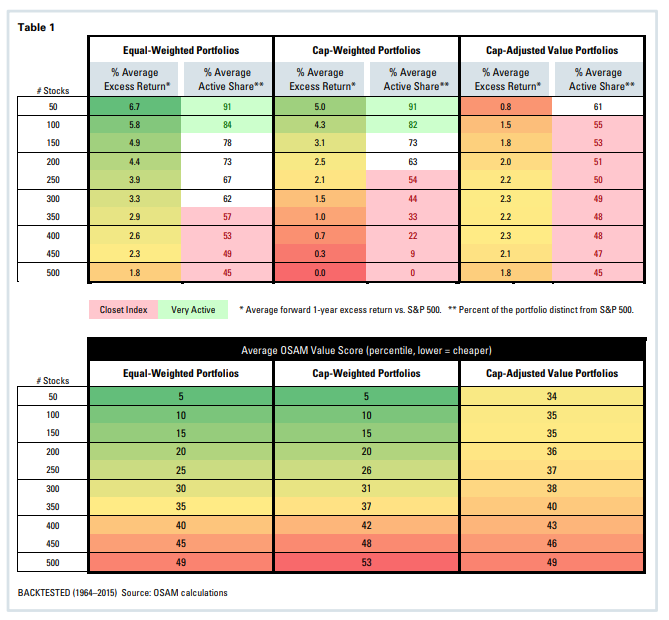
Table 1 (on the following page) shows the results, highlighting three key variables: first, the average forward one-year excess returns versus the S&P 500; second, the average active share (i.e., the percent of the portfolio that is different from the S&P 500, higher means less overlap with the index); and third, the average relative valuation percentile of the portfolio (lower means cheaper).
What We Learned
From this simple exercise, we learn the following:
- Concentration and equal-weighting lead to portfolios that have better average excess returns and higher active shares.
- The equal-weighted portfolios outperform cap-weighted and cap-adjusted value portfolios by an average of 1.8 percent and 2.0 percent per year, respectively—a wide margin in the U.S. large cap market.
- More concentrated portfolios have a much better valuation edge: stocks in the portfolio have much cheaper average value percentile scores.
Why This Happens
Value (measured using something like a price-to-earnings ratio) is just another way of saying “market outlook.” A low valuation for IBM means that the market is pessimistic—relative to other stocks—about IBM’s future. We believe that value works over time because markets become too pessimistic about these stocks. Pessimism is good—and the lower the P/E, the more pessimistic the market.
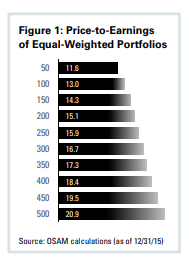
Now, notice the trend in the P/E ratios of Table 1’s Equal-Weighted Portfolios (see Figure 1 above). If market pessimism (low P/E) signals an opportunity, then the opportunity clearly grows as the portfolio gets more and more different from the S&P 500.
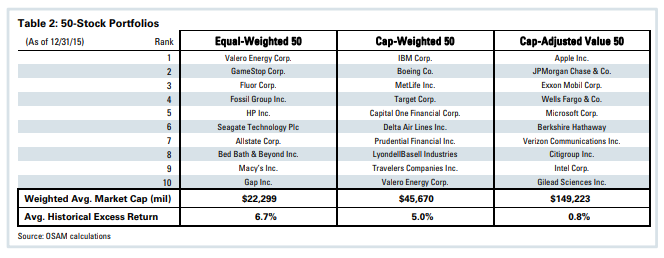
It helps to see what these portfolios would hold today. Here are the top 10 holdings for each of the 50-stock versions of our strategies, along with each portfolio’s weighted average market cap.6 You can see, as you move left to right, that the top ten look more and more like the overall market because the market caps get bigger and bigger.
Size vs. Edge
If you are a value investor, or a quality investor, or a yield investor, a key question is: how big is your edge versus the overall market? If you believe in price-to-book, your goal should be to achieve significant portfolio discounts versus the market on that measure.
But the most notable difference across the portfolios in Table 2 is their size. When market cap is used as a variable for building a portfolio, it obscures any other edge that exists. Exxon Mobil has a price-to-book of 1.95⨉ but is a huge company so it has a weight of 3.6 percent in the Russell 1000® Value Index. Seadrill—a maligned energy stock—has a price-to-book of 0.18⨉. So it is much “cheaper” than Exxon, but it’s only a $1.6 billion company, so its weight in the index is 0.01 percent, which may as well be zero.
If Exxon went up 40 percent, it would push the overall index up 1.44 percent. If Seadrill went up 40 percent, it would push the index up 0.004 percent. Seadrill would have to go up 14,400 percent to have the same impact as Exxon’s 40 percent rise.
For the Russell 1000 Value, Exxon is by far the more important stock. But if you cared more about value than size, then the weights would be very different. Exxon is the biggest stock, but it’s only in the fiftieth percentile when sorted by price-to-book instead of by market cap. Seadrill is in the cheapest percentile. From the perspective of an active investor, this is very odd because cheapness should matter much more than market cap when deciding a stock’s weight in a portfolio.
Different Means More Potential
If you weight stocks based on market cap—like the Russell 1000 Value does—then your portfolio will always have substantial overlap with the market (low active share). With all that overlap, there is only so much alpha you can earn.
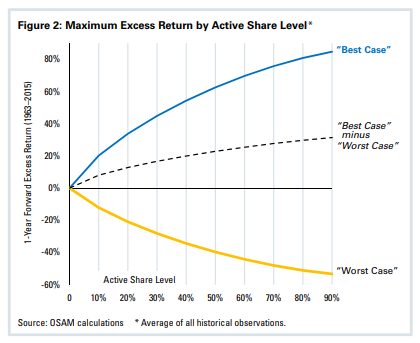
Active share—our preferred measure of how different a portfolio is from its benchmark—is not a predictor of future performance but it is a good indicator of any strategy’s potential alpha. Figure 2 shows why. On every date through history (1962–2015), we bestow ourselves with perfect foresight so that we can build portfolios that will achieve the highest possible one-year forward excess return at each level of active share from zero percent to 90 percent. We use only stocks in the S&P 500 itself and allow a maximum position size of five percent in the portfolios, to avoid piling into just a few of the strongperforming stocks. The vertical axis of Figure 2 shows the maximum possible excess return (average of all historical periods) versus the S&P 500 across the active share levels. This potential cuts both ways, so we also show the “worst case” scenarios across the active share levels. At any given level of active share, the “potential” excess return skews more to the positive (see Figure 2, dashed line). More active portfolios have more potential for excess than less active portfolios.7 No one has perfect foresight, so nobody achieves alpha like this with any consistency. But these “best case” scenarios show the power of being different.
Factors like value have been a good way of putting yourself on the positive side of the potentiality curve above. Indeed, we saw the same thing with our different value portfolios: the more concentrated the portfolios are (higher active share), the better the average results. Amazingly, in the early 1980s, well over half of mutual funds had an active share above 80 percent—but only 20 percent or so of funds were this active as of 2009. Large, scaled up institutions now control a majority of the market. In 1950, between seven to eight percent of the market was managed by large institutions. In 2010, that number was 67 percent
Costs Matter
So far we’ve discussed paper returns only. We saw that, gross of costs, returns to the S&P 500 value strategy worsen as the number of stocks grows. Now let’s look at the same issue net of trading costs. Simple trading commissions are a real cost but our focus here is on market impact costs, which matter more for big asset managers. Once you start getting too big (trading billions of dollars), your trading moves the price of the names you are buying and selling—you pay a higher price when buying and get a lower price when selling than if you were an individual trading a $100,000 account. Market impact is a cost that doesn’t get enough attention because end investors can’t see it and asset managers don’t report it. Table 3 (below) shows how costs grow with assets.
To show the cost drag, we expand our universe to the Russell 3000®, which includes small and mid cap stocks where market impact is even more important. We again build portfolios based on valuation that range from 50 to 3,000 stocks and assets under management from $50 million to $50 billion. We rebalance these portfolios on a rolling annual basis, so the holding period is at least one year for each position. It is important to note that the more concentrated equal-weight portfolios have greater exposure to smaller cap stocks, so the impact numbers are higher than if we performed the same analysis on the S&P 500 universe.
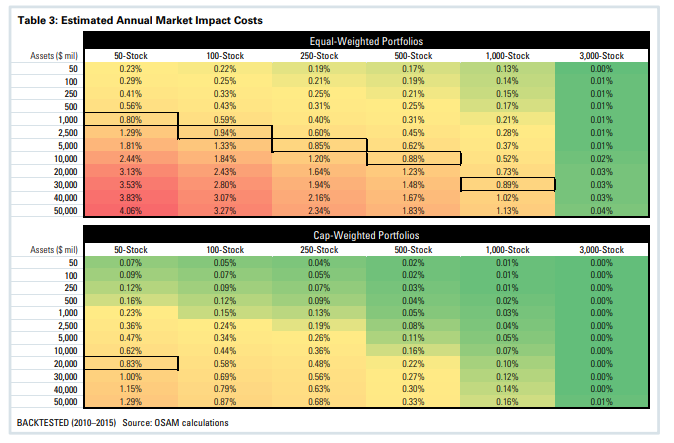
The cost estimates reported in Table 3 (above) are based on five years of simulated trading in the actual value portfolios between 2010 and 2015.9 These are based on actual, not hypothetical, market conditions. We’ve drawn boxes denoting the points where impact (annualized) crosses one percent. For the cap-weighted portfolios, you reach $30 billion in the most concentrated portfolio before crossing one-percent impact costs. But in the equal weighted portfolios, you reach the one-percent threshold much more quickly in the more concentrated portfolios. We’ve already seen that equal-weighting and concentration have delivered better results. This table proves that the more concentrated value portfolios literally cannot accommodate the kind of scale that large asset managers are after. If you are seeking alpha, you’d equal-weight and you’d be willing to have fewer names in the portfolio. If you were seeking assets, you’d do what the industry has done: build broader Smart Beta indexes that focus on the large cap market or weight based on market cap.
Why Scale Spells Trouble: When Measures Become Targets
We’ve seen that scale and excess return are mortal enemies. As Warren Buffett said in his 1994 letter to shareholders, cautioning them about lower future growth rates for Berkshire Hathaway, “a fat wallet … is the enemy of superior investment results.” But this is part of an even bigger problem.
In Vietnam, under colonial French rule, there was a rat problem. To solve the rat infestation, the French offered a bounty on rats, which could be collected by delivering a rat’s tail as proof of murder. Many bounties were paid out but the rat problem didn’t improve. Officials soon noticed rats running around without tails–people were cutting off the tails and releasing the rats to breed, so as to increase the pool of potential bounty revenue for themselves. The same thing happened in Colonial India (apocryphally): a bounty was offered on cobras because they were attacking people, which caused people to breed cobras for more bounties—ultimately resulting in a higher cobra population when the government abandoned the bounty system and breeders released their suddenly worthless snakes.
Goodhart’s law says “when a measure becomes a target, it ceases to be a good measure.” Rats’ tails and dead cobras were measures of progress against vermin overpopulation in Vietnam and India. But those measures later became the targets of enterprising citizens, and in the process ceased to be good measures.
Stock indexes (including value and growth “style” indexes, which were the original forms of Smart Beta) were first designed as reference points to measure the market’s success. But now they are also the targets for the most popular investing strategies in the world, for both pure indexers and Smart Beta strategies. If broad indexes and Smart Beta factors are now both measures and primary targets, we should get concerned. Let’s look at an example in the world of value investing.
Price-to-Book: Measure, Then Target
Price-to-book has been the most common measure of valuation. It was the factor originally used by Eugene Fama and Ken French in their seminal 1993 paper “Common Risk Factors in the Returns on Stocks and Bonds.” It is also the factor that is used to define value in the most prominent style indexes: the Russell Growth and Value indexes. Hundreds of billions of dollars are invested based on the price-to-book factor alone. Other than market cap, it is likely the single most important factor used by investors.
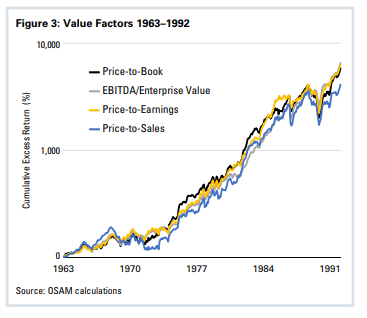
Figure 3 shows the cumulative excess return of the cheapest decile of stocks by four different measures of value between 1963 and 1992, when Fama and French published their paper. Figure 4 shows the cumulative excess for the same factors between 1993 and 2015.
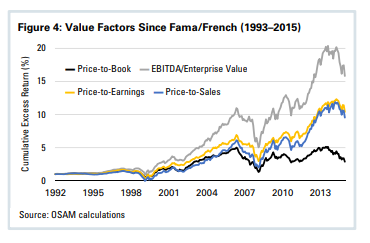
Price-to-book was a key measure. Then it became the target around which hundreds of billions in assets built value portfolios and indexes and along the way has decoupled from other major value factors. Everything else—sales, earnings, EBITDA, free cash flow, total yield—has proven to be a better indicator of value since price-to-book was first held out as the definitive value factor
Back to Smart Beta
Price-to-book was arguably the first Smart Beta factor. Science fiction master William Gibson wrote in his book Pattern Recognition that “commodification will soon follow identification.” In another passage from the same book, Gibson is talking about clothes, but he could very well be talking about Smart Beta ETFs:
This stuff is simulacra of simulacra of simulacra. A diluted tincture of Ralph Lauren, who had himself diluted the glory days of Brooks Brothers, who themselves had stepped on the product of Jermyn Street and Savile Row, flavoring their ready-to-wear with liberal lashings of polo knit and regimental stripes. But Tommy surely is the null point, the black hole. There must be some Tommy Hilfiger event horizon, beyond which it is impossible to be more derivative, more removed from the source, more devoid of soul.
Smart Beta is the commodification of the most common historically proven factors. By definition, a commodity must be widely available. In asset management, that means it must be able to accommodate lots of invested money. We haven’t seen many active strategies with hundreds of billions of dollars behind them consistently beat a simple market index. Even Warren Buffett has been slowed—though not stopped—by scale.
Factor investing has huge potential benefits. Factor investing strategies tend to be cheaper than traditional active management. Properly managed, factor-investing strategies are also highly disciplined. But if a given strategy can accommodate $100 billion in assets, you may want to look elsewhere. Always avoid saturated strategies. For most of history, the individual factors behind Smart Beta strategies weren’t big targets. Now they are. Beware of popularity, beware scalability, and beware newly accepted “measures” of a strategy or idea. Too often, popular measures become targets and then lose their meaning and their edge.
Factor Alpha
The philosophical roots of the Factor Alpha approach are notably different than those of Smart Beta.
First, what you don’t own matters. If Apple or Microsoft don’t look attractive, we believe you should own none of either in your portfolio. We start with a weight of zero in every stock, not with the market weight. Stocks are guilty until proven innocent. This naturally leads to higher active share and a portfolio with a greater overall potential for alpha.
Second, alpha comes from the relative advantage a portfolio has versus the market, measured across key factors. Greater spreads—like bigger discounts or higher shareholder yields10—have led to better excess returns through time. Portfolios should focus on just the stocks with the most attractive factor profiles. To achieve these big factor advantages, portfolios should be more concentrated than has become typical for Smart Beta strategies.
Sample the most popular Smart Beta ETFs and you’ll find the opposite: high overlap with the S&P 500 or Russell 1000. USMV, the popular “low volatility” ETF has an active share of 46 percent to the S&P 500. That means it has more in common with the S&P 500 than it does with an equal-weighted version of the S&P 500 with an active share around 50 percent. Strategies designed for Factor Alpha have high active shares (e.g., O’Shaughnessy Market Leaders Value or Small Cap Value). They are still well diversified but more diversification is not always better. In the case of factor investing, diversification often means diluted factor exposures. If factors work most reliably at their extremes, then diversification means moving away from your edge and toward the market return.
Often, a picture tells the story better than words can. Below, we show the unmistakable difference between popular Smart Beta approaches and our approach. We recreate the spirit of a Morningstar style box, but instead of using market cap and value versus growth as the dimensions on the chart, we instead use the themes that we’ve found to be most predictive of future excess return: Shareholder Yield and Quality (where quality is a combination of valuation, earnings growth, earnings quality, and financial strength).
The goal is to show where the different portfolios plot on the yield and quality continuum. A portfolio in the lower left would have the strongest relative readings on both quality and yield. The central dot in each circle represents the average current shareholder yield and quality readings for the portfolio and the surrounding circle encompasses 75 percent of the portfolio’s weight. The trend is clear. As you move from the broad Russell 1000 to the Russell 1000 Value, then to the biggest “fundamental index” Smart Beta approach (PRF), you see a tilt toward a very broad exposure to factors. The Factor Alpha approach is entirely different by design: a much better and tighter exposure to what we believe are the best factors. This differentiation is a byproduct of our two-decade-old philosophy: factors should be used to earn alpha, not provide beta.

Into the Future
Indexes and Smart Beta factors are affected and changed by asset flows into strategies that target those indexes. Hundreds of billions of dollars flowed into low price-to-book strategies and price-to-book has suffered as a result.11 Fund flows affect everything.
Mark Twain said, “I was seldom able to see an opportunity until it had ceased to be one.” We often become aware of market strategies only after they’ve been identified, commodified, and scaled away. Smart Beta factors are a commodity. There is an ETF for everything, from value, to obesity, to put writing. When making an investment, consider the motivations of the manager or sponsor company. Are they oriented toward gathering assets or earning alpha over time? If you believe in value, is a market cap-weighted value portfolio the best expression of that factor?
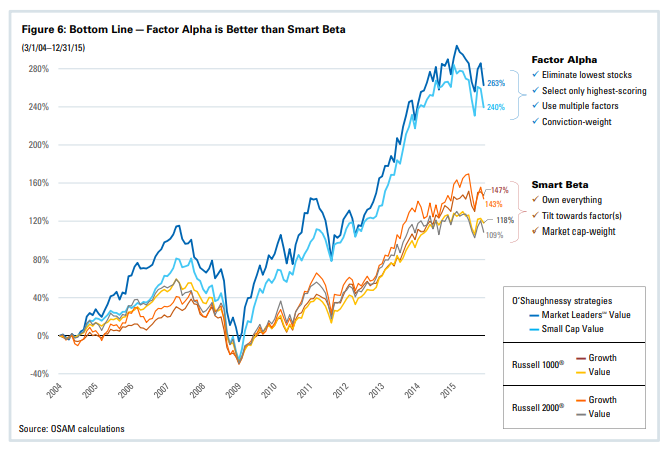
In closing, we compare the live results for six strategies: two strategies that have followed the Factor Alpha philosophy laid out in the previous section (OSAM’s Market Leaders Value and Small Cap Value strategies) along with four of the original “smart beta” strategies (the four Russell Style indexes). These real-time results highlight the potential of focusing on alpha over beta. Viewed through this lens, the Russell 1000 Growth, Russell 1000 Value, Russell 2000® Growth, and Russell 2000 Value appear similar. This apparent clustering happens because only so much return differentiation is possible when strategies are built for scale. Factor Alpha has won for investors in the past and we believe will continue to win in the future.
General Legal Disclosures & Hypothetical and/or Backtested Results Disclaimer
The material contained herein is intended as a general market commentary. Opinions expressed herein are solely those of O’Shaughnessy Asset Management, LLC and may differ from those of your broker or investment firm.
Please remember that past performance may not be indicative of future results. Different types of investments involve varying degrees of risk, and there can be no assurance that the future performance of any specific investment, investment strategy, or product (including the investments and/or investment strategies recommended or undertaken by O’Shaughnessy Asset Management, LLC), or any non-investment related content, made reference to directly or indirectly in this piece will be profitable, equal any corresponding indicated historical performance level(s), be suitable for your portfolio or individual situation, or prove successful. Due to various factors, including changing market conditions and/or applicable laws, the content may no longer be reflective of current opinions or positions. Moreover, you should not assume that any discussion or information contained in this piece serves as the receipt of, or as a substitute for, personalized investment advice from O’Shaughnessy Asset Management, LLC. Any individual account performance information reflects the reinvestment of dividends (to the extent applicable), and is net of applicable transaction fees, O’Shaughnessy Asset Management, LLC’s investment management fee (if debited directly from the account), and any other related account expenses. Account information has been compiled solely by O’Shaughnessy Asset Management, LLC, has not been independently verified, and does not reflect the impact of taxes on non-qualified accounts. In preparing this report, O’Shaughnessy Asset Management, LLC has relied upon information provided by the account custodian. Please defer to formal tax documents received from the account custodian for cost basis and tax reporting purposes. Please remember to contact O’Shaughnessy Asset Management, LLC, in writing, if there are any changes in your personal/financial situation or investment objectives for the purpose of reviewing/evaluating/revising our previous recommendations and/or services, or if you want to impose, add, or modify any reasonable restrictions to our investment advisory services. Please Note: Unless you advise, in writing, to the contrary, we will assume that there are no restrictions on our services, other than to manage the account in accordance with your designated investment objective. Please Also Note: Please compare this statement with account statements received from the account custodian. The account custodian does not verify the accuracy of the advisory fee calculation. Please advise us if you have not been receiving monthly statements from the account custodian. Historical performance results for investment indices and/or categories have been provided for general comparison purposes only, and generally do not reflect the deduction of transaction and/or custodial charges, the deduction of an investment management fee, nor the impact of taxes, the incurrence of which would have the effect of decreasing historical performance results. It should not be assumed that your account holdings correspond directly to any comparative indices. To the extent that a reader has any questions regarding the applicability of any specific issue discussed above to his/her individual situation, he/she is encouraged to consult with the professional advisor of his/her choosing. O’Shaughnessy Asset Management, LLC is neither a law firm nor a certified public accounting firm and no portion of the newsletter content should be construed as legal or accounting advice. A copy of the O’Shaughnessy Asset Management, LLC’s current written disclosure statement discussing our advisory services and fees is available upon request.
The risk-free rate used in the calculation of Sortino, Sharpe, and Treynor ratios is 5%, consistently applied across time.
The universe of All Stocks consists of all securities in the Chicago Research in Security Prices (CRSP) dataset or S&P Compustat Database (or other, as noted) with inflation-adjusted market capitalization greater than $200 million as of most recent year-end. The universe of Large Stocks consists of all securities in the Chicago Research in Security Prices (CRSP) dataset or S&P Compustat Database (or other, as noted) with inflation-adjusted market capitalization greater than the universe average as of most recent year-end. The stocks are equally weighted and generally rebalanced annually. Hypothetical performance results shown on the preceding pages are backtested and do not represent the performance of any account managed by OSAM, but were achieved by means of the retroactive application of each of the previously referenced models, certain aspects of which may have been designed with the benefit of hindsight. The hypothetical backtested performance does not represent the results of actual trading using client assets nor decision-making during the period and does not and is not intended to indicate the past performance or future performance of any account or investment strategy managed by OSAM. If actual accounts had been managed throughout the period, ongoing research might have resulted in changes to the strategy which might have altered returns. The performance of any account or investment strategy managed by OSAM will differ from the hypothetical backtested performance results for each factor shown herein for a number of reasons, including without limitation the following:
- Although OSAM may consider from time to time one or more of the factors noted herein in managing any account, it may not consider all or any of such factors. OSAM may (and will) from time to time consider factors in addition to those noted herein in managing any account.
- OSAM may rebalance an account more frequently or less frequently than annually and at times other than presented herein.
- OSAM may from time to time manage an account by using non-quantitative, subjective investment management methodologies in conjunction with the application of factors.
- The hypothetical backtested performance results assume full investment, whereas an account managed by OSAM may have a positive cash position upon rebalance. Had the hypothetical backtested performance results included a positive cash position, the results would have been different and generally would have been lower.
- The hypothetical backtested performance results for each factor do not reflect any transaction costs of buying and selling securities, investment management fees (including without limitation management fees and performance fees), custody and other costs, or taxes – all of which would be incurred by an investor in any account managed by OSAM. If such costs and fees were reflected, the hypothetical backtested performance results would be lower.
- The hypothetical performance does not reflect the reinvestment of dividends and distributions therefrom, interest, capital gains and withholding taxes.
- Accounts managed by OSAM are subject to additions and redemptions of assets under management, which may positively or negatively affect performance depending generally upon the timing of such events in relation to the market’s direction.
- Simulated returns may be dependent on the market and economic conditions that existed during the period. Future market or economic conditions can adversely affect the returns.


