Using Market Volatility to Reduce Taxes: A Case Study in Tax Loss Harvesting
By OSAM Research Team
April 2021
In a world where passive investing is in vogue and alpha is hard to come by, proper tax management can be a valuable boost to portfolio “return.” Most financial advisors are doing some form of tax loss harvesting (TLH) today, but TLH can be executed in a wide variety of ways and the most sophisticated solutions typically yield more tax alpha. Below, we dive into the value and nuance of tax loss harvesting with a specific focus on:
1. 2020 was a boon for tax loss harvesting.
2. Harvesting is a year-round endeavor: NOT only for December!
3. Owning individual securities creates more opportunity.
4. Sophisticated TLH is difficult and should be done using a systematic process and technology.
2020 was a boon for tax loss harvesting
2020 was an ideal year for tax-managed strategies and investors that used them likely saw huge tax savings. This is because volatility and market drawdowns create increased opportunity for loss harvesting and 2020 had both in big numbers. The US Large Cap market was up +5.4% early in the year, collapsed in March to a low of -31.1%, and then rallied to end the year up +20.8%.1
In 2020, we harvested $250,000 in losses on a $1,000,000 US Large Cap Direct Index Canvas® account, or 25% of the portfolio.2 From a tax perspective, these losses could be used to reduce the investor’s expected 2020 tax bill and/or carried forward as excess losses to book against future capital gains. To quantify this, a high-tax bracket investor with equivalent short-term gains elsewhere in their portfolio would have saved over $100,000 on their 2020 tax bill or over the lifetime of the account per $1,000,000 invested in the strategy.3
The graph below shows cumulative harvests for the $1,000,000 Direct Index Canvas account next to the cumulative return of a passive U.S. Large Cap index. Over the course of the year, 22 opportunistic trades were made adding up to $254,208 in realized losses in the account.
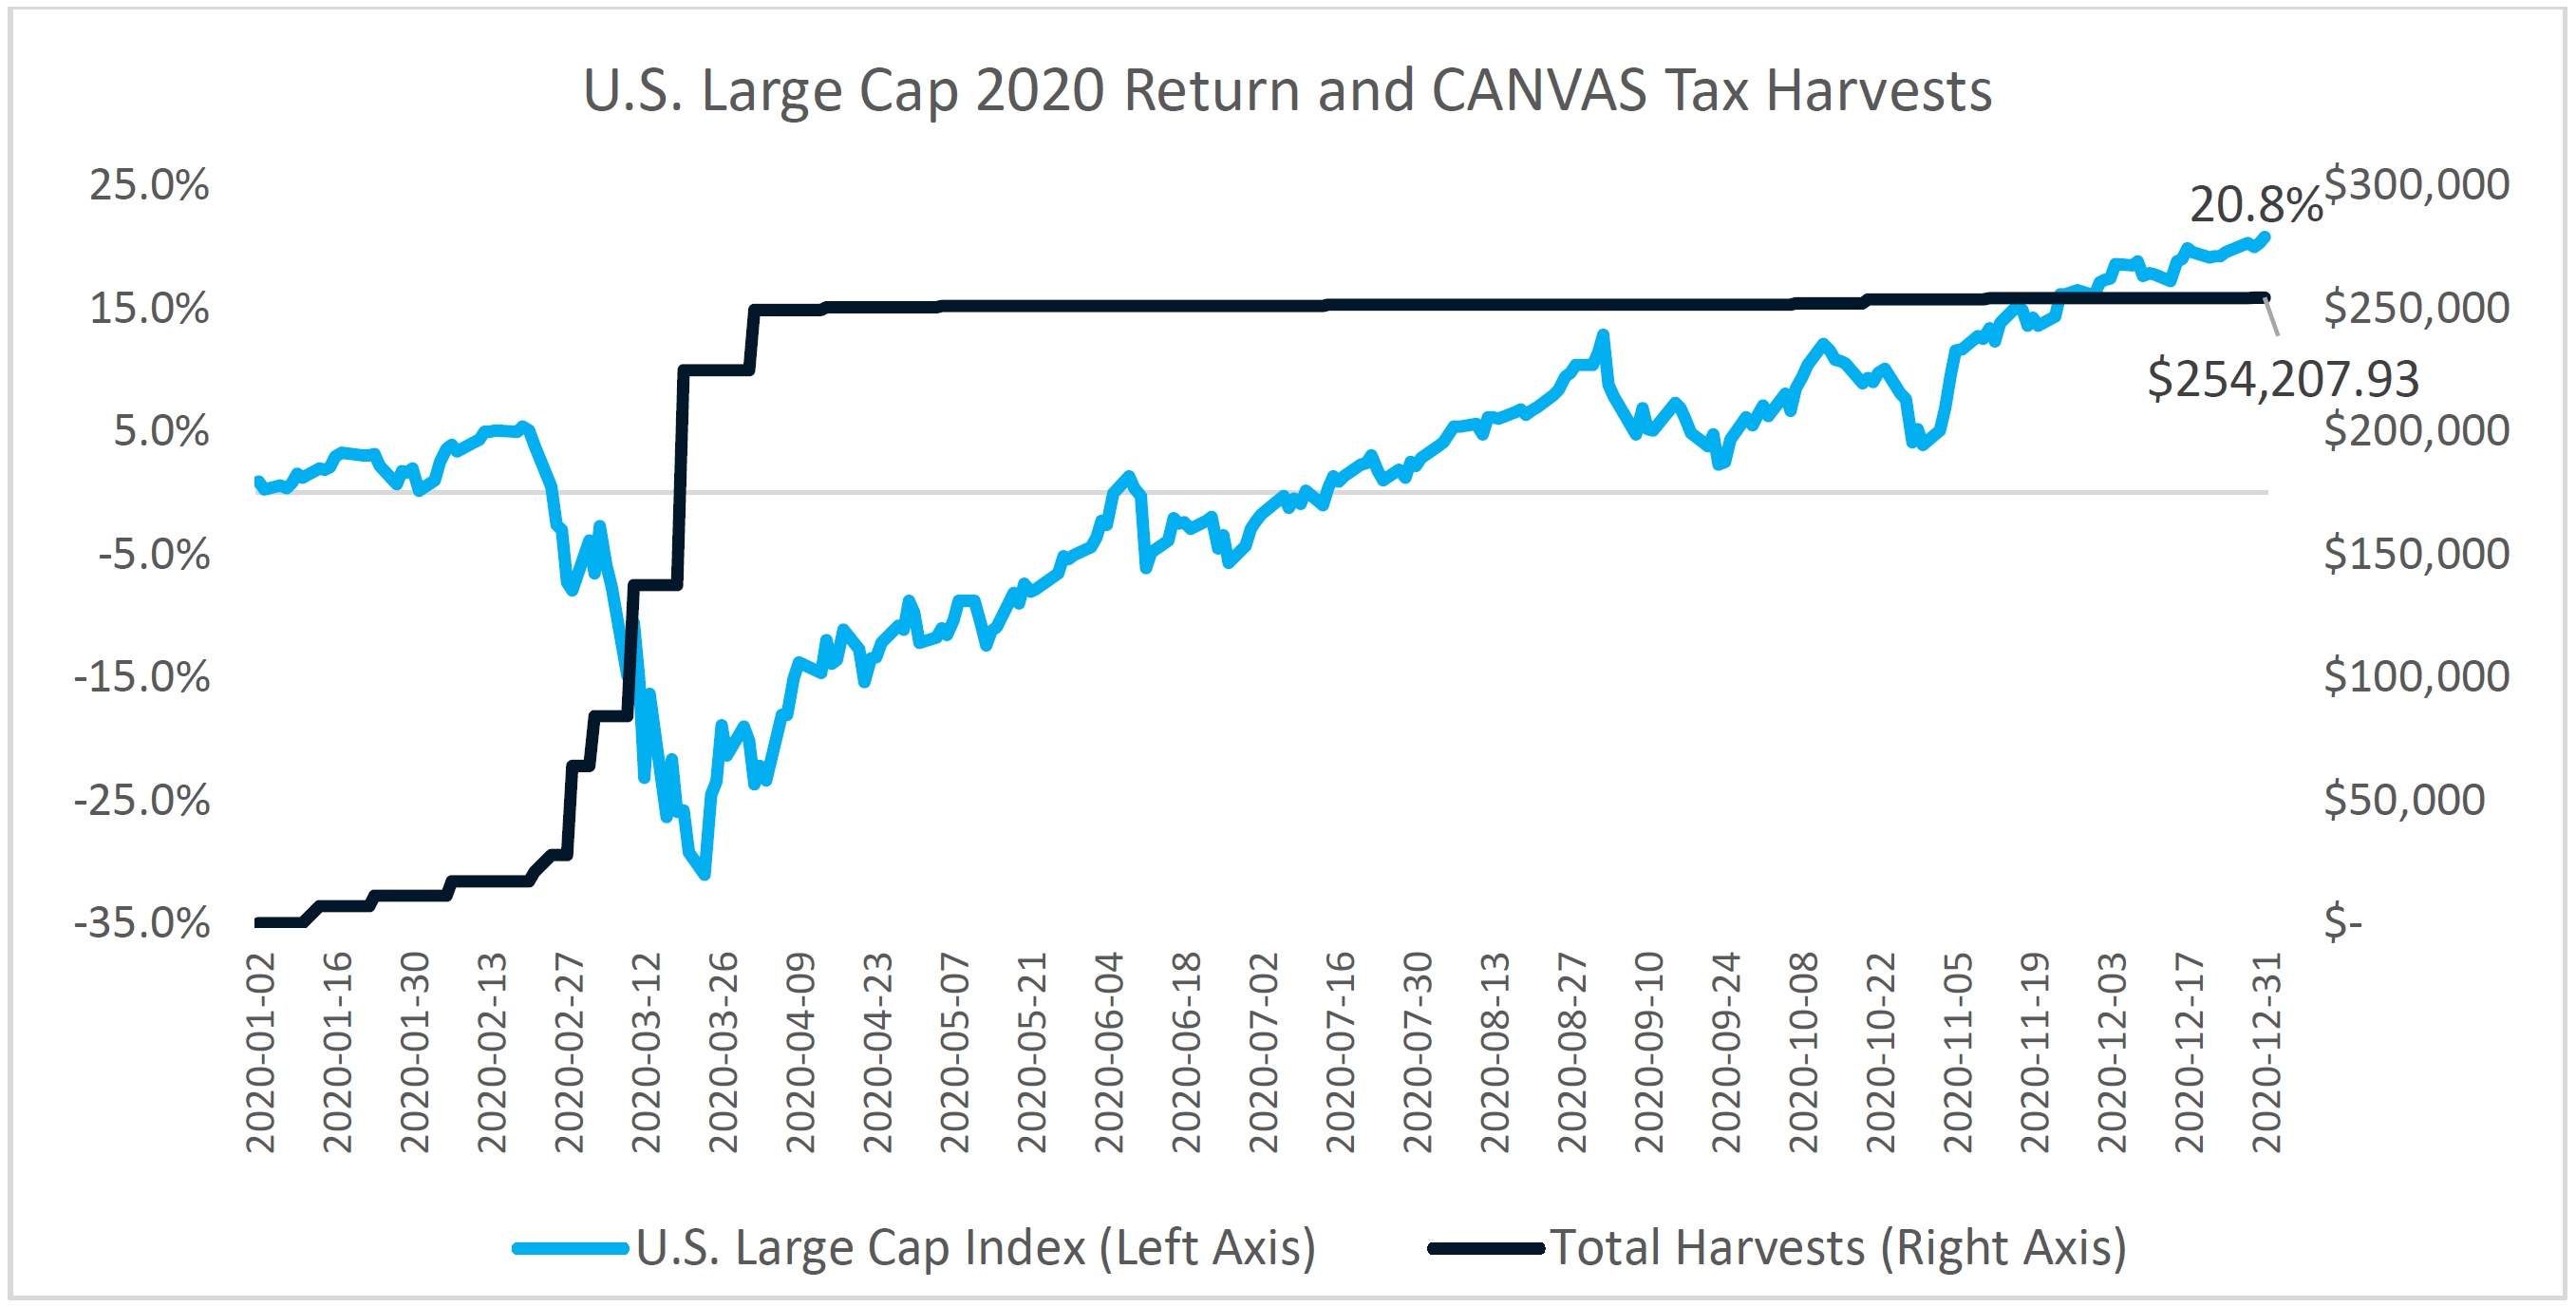
As evident, tax loss harvesting can save investors significant money by generating losses to offset gains that subsequently reduce their tax bill. Though nobody enters the market hoping for losers, there will always be down positions and when managed appropriately, losers can be turned into a tax asset. In this case, the bulk of harvesting occurred as we approached the year’s low in March, but after the market bounce-back, there were still smaller opportunities to generate losses. All in all, 2020 was a good year for tax-managed strategies, but investors were primarily rewarded if they were invested in strategies that were actively harvesting during the volatile drawdown.
Harvesting is a year-round endeavor: NOT only for December!
Looking at the above, an investor using comingled products like mutual funds or ETFs that only harvest in December would have booked $0 as opposed to the ~$250,000 in losses. In 2020 there were no loss-harvesting opportunities for ETF investors that were not actively harvesting in the first 7 months as their ETFs would have been in positive territory for the final 5 months. Realizing losses quarterly would have been beneficial but still less favorable than the Direct Index results. Specifically, a strategy that reviewed for TLH opportunities quarterly leveraging only ETFs would have yielded a wide range of outcomes – from as low as $80,000 to as high as $202,000.
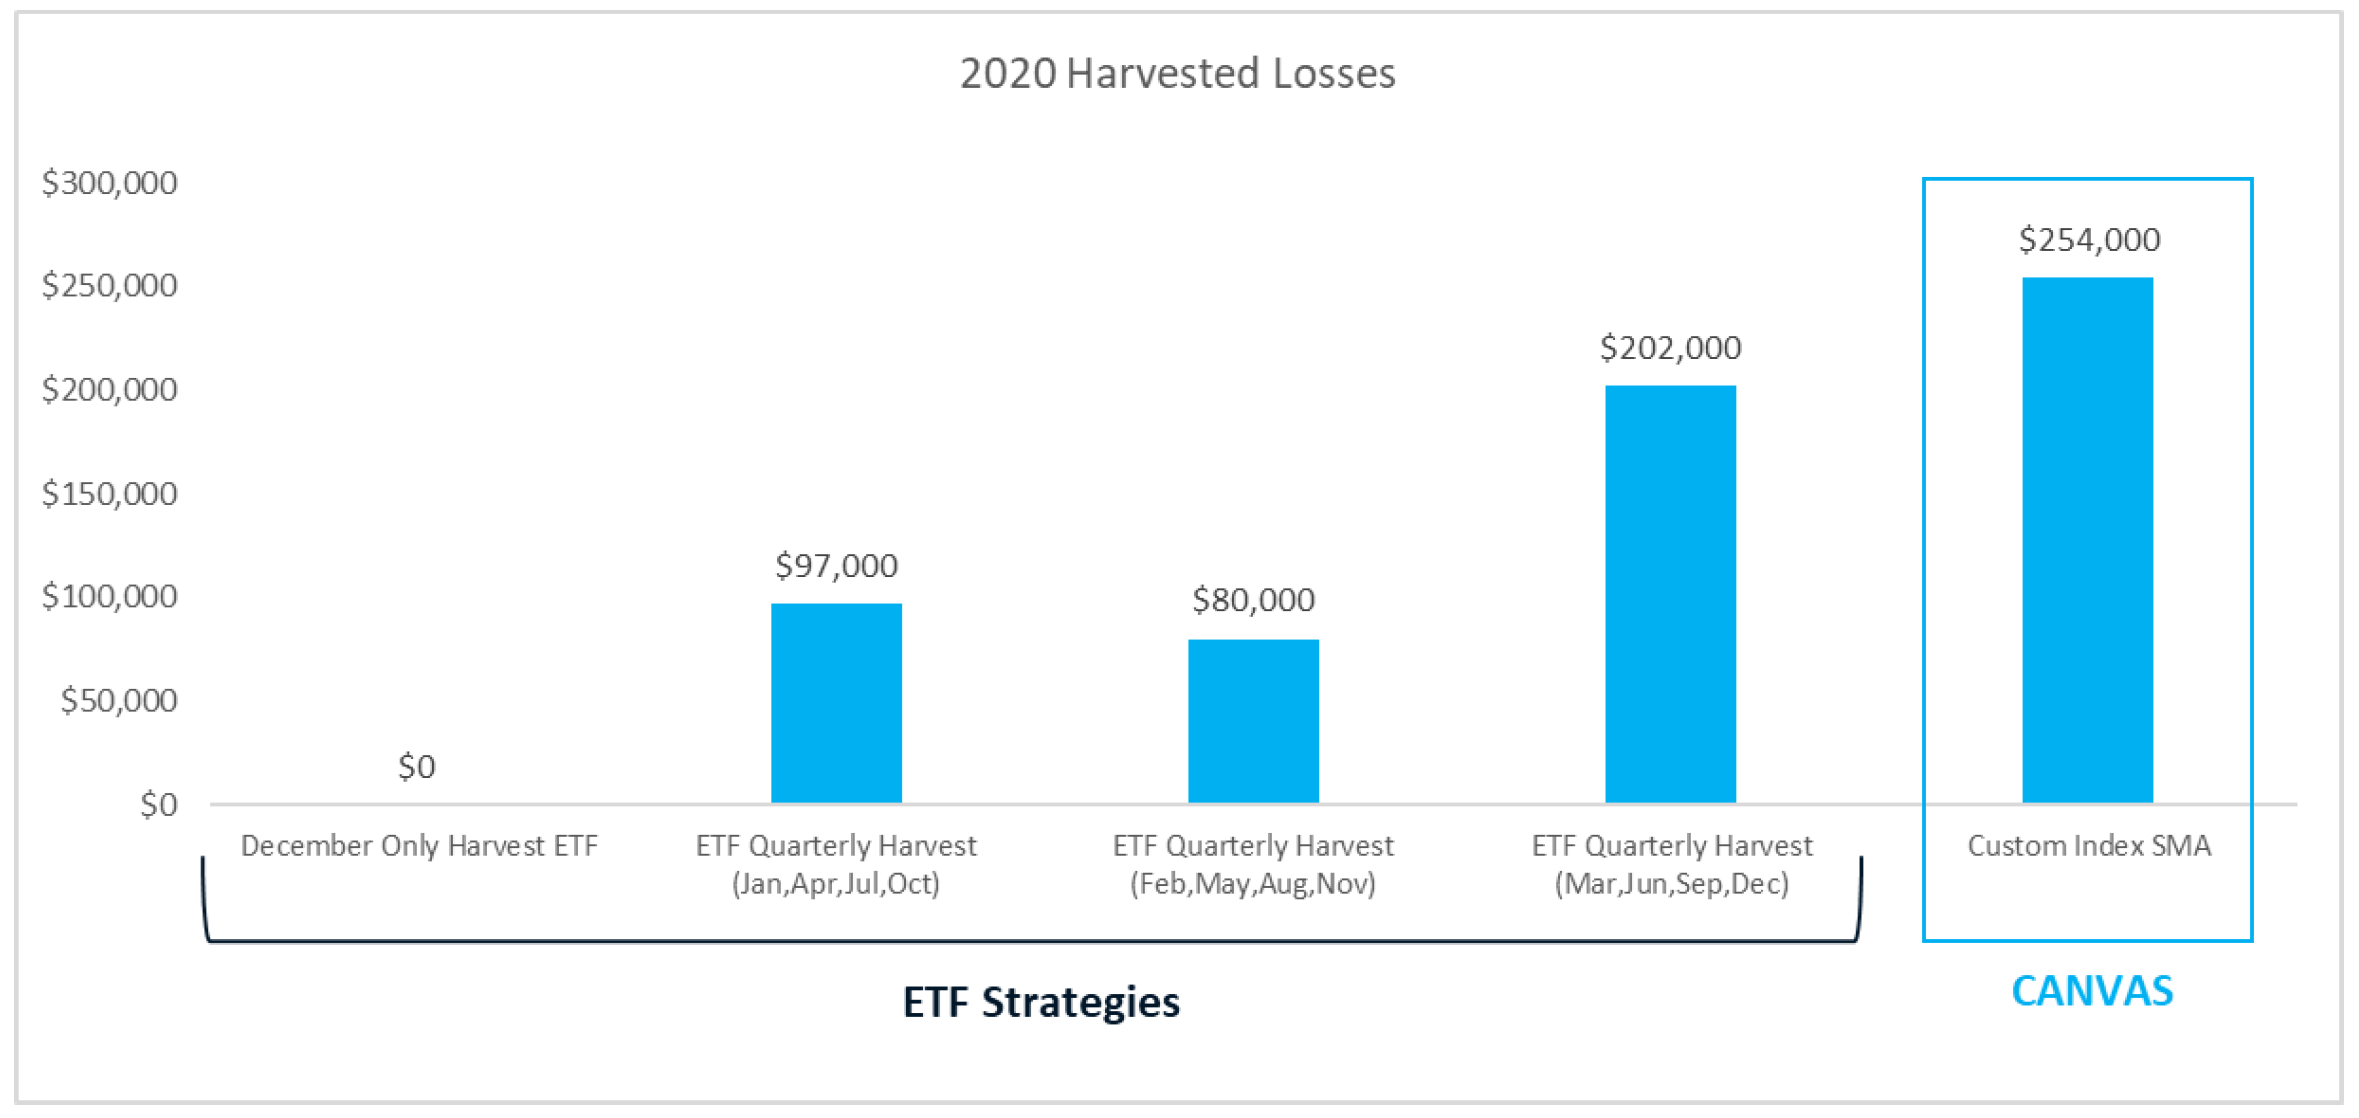
In summary, not all tax loss harvesting techniques are created equal. We recommend advisors choose a strategy that regularly monitors for harvesting opportunities as the market moves, rather than only at year-end or some other preset interval.
Owning individual securities creates more opportunity
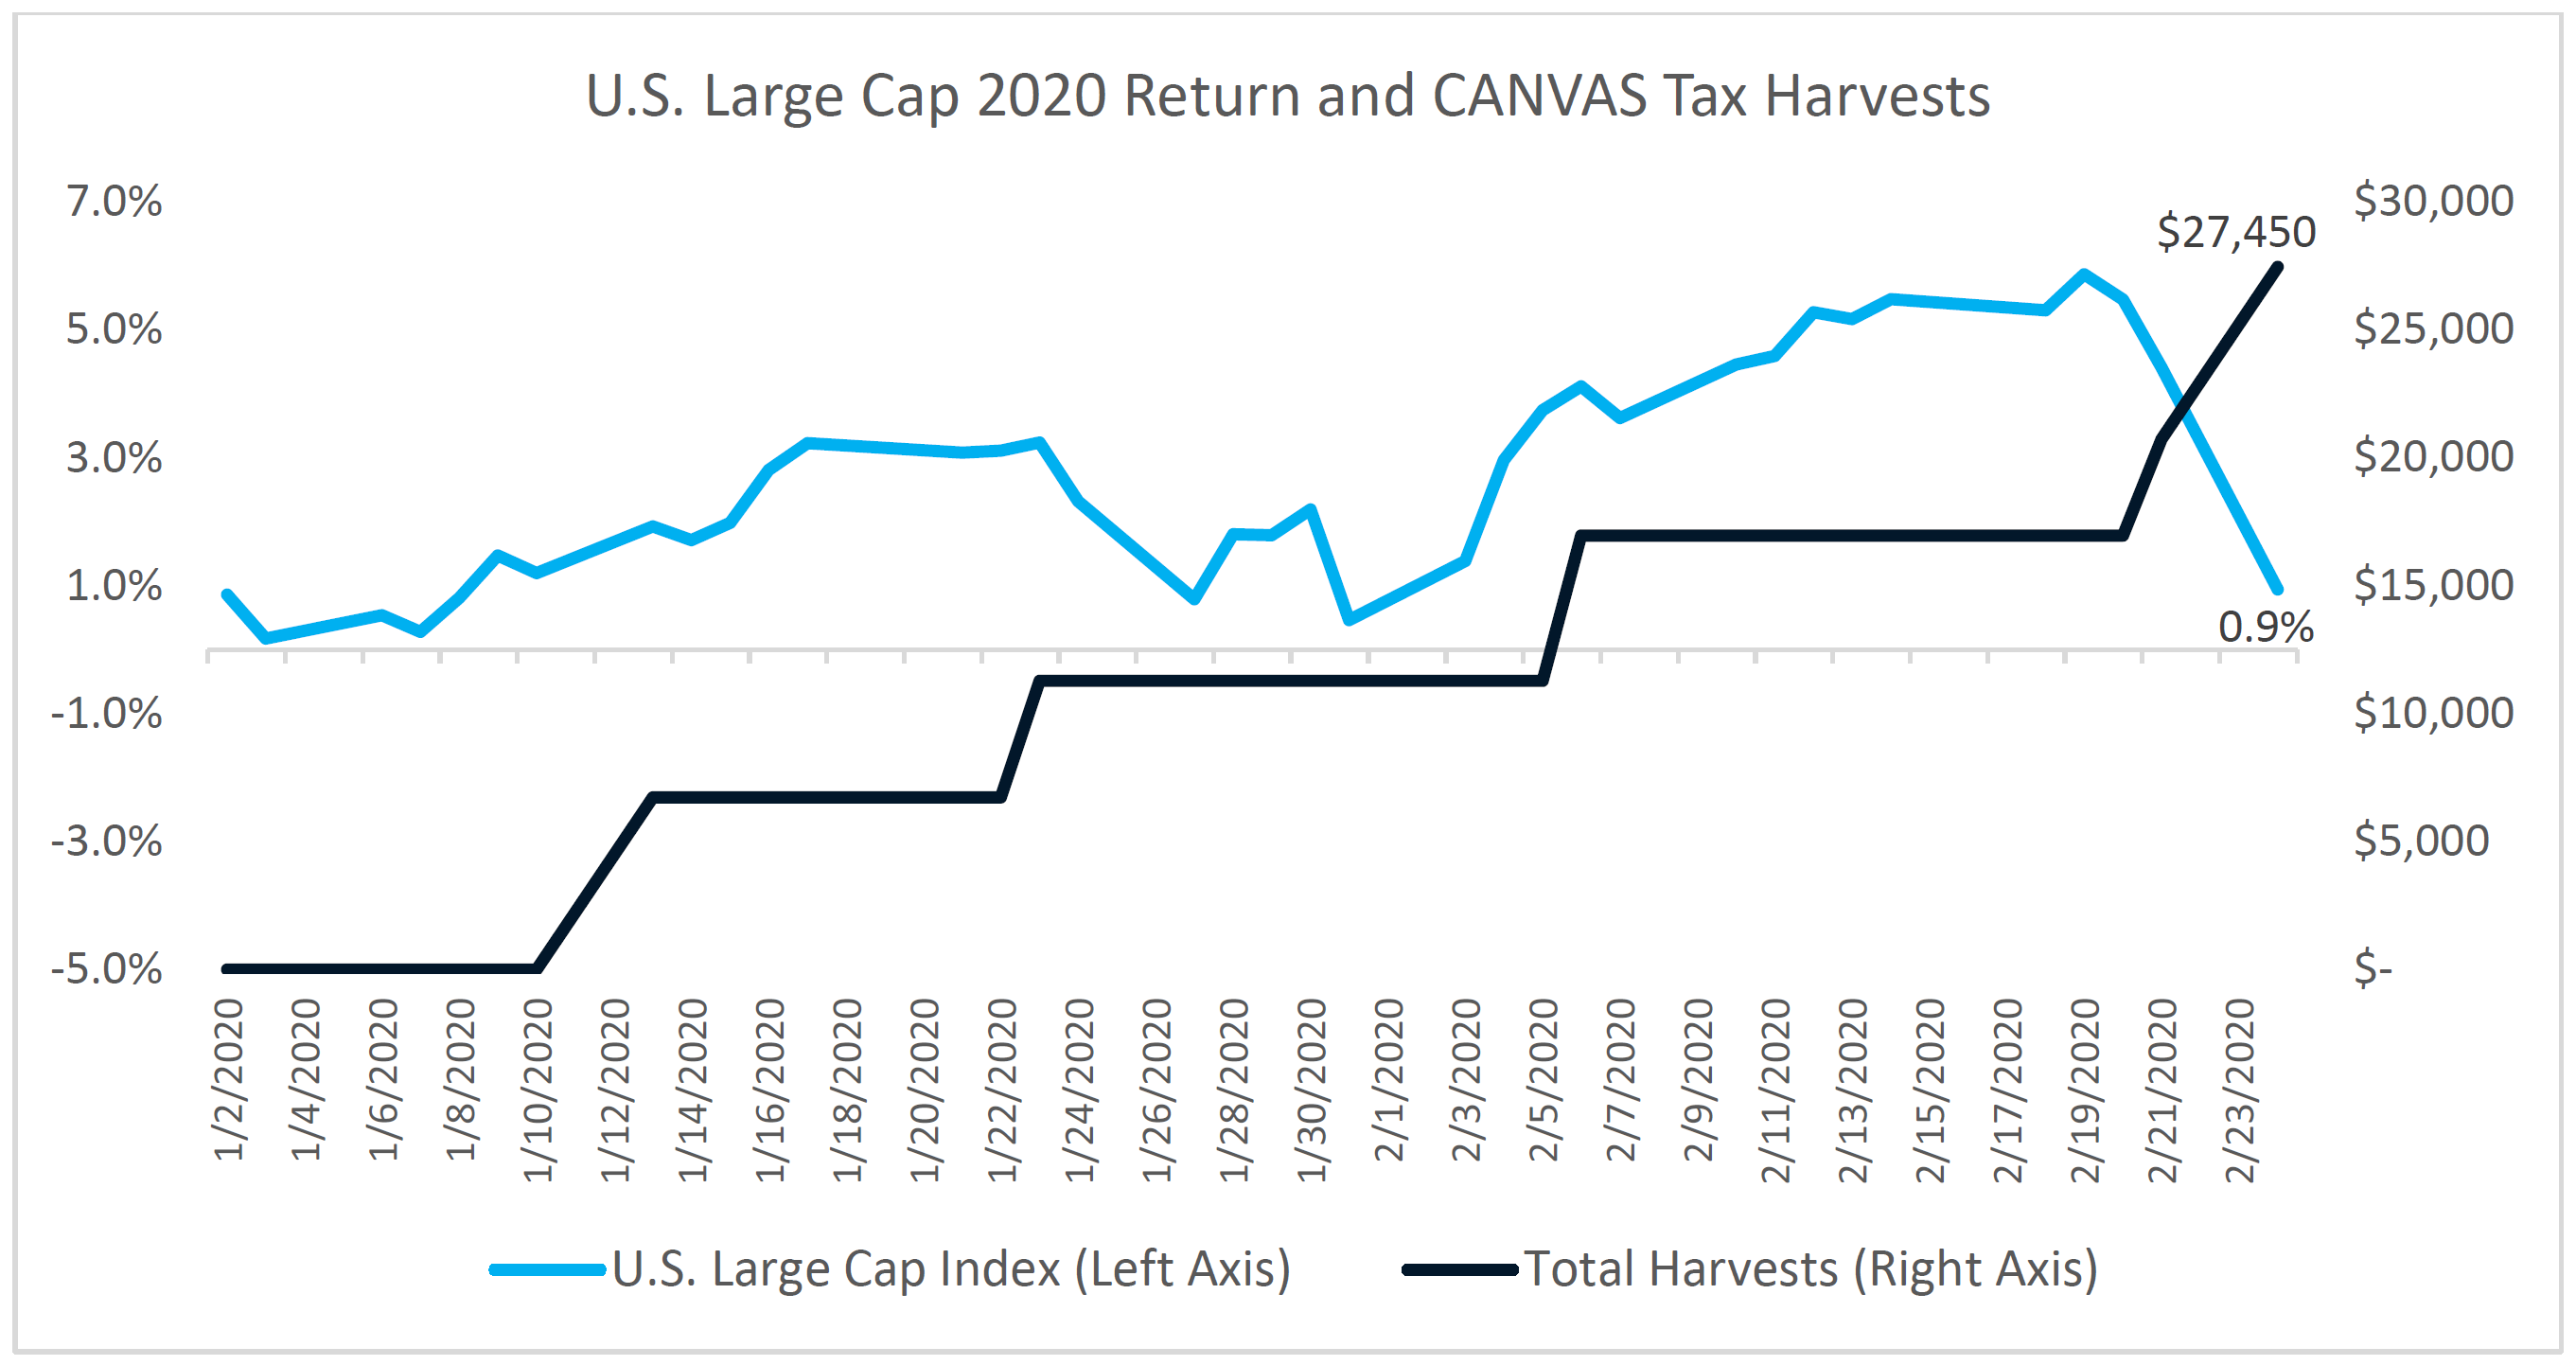
Below highlights the first two months of 2020. The market did not turn negative until February 25th. In the two-month period without a negative close, the Canvas Direct Index harvested $27,450 in losses. This was achieved by owning individual securities emulating the desired index, rather than fund shares of the index-tracking product. An ETF or mutual fund can only tax loss harvest if the whole fund is down, limiting its tax efficiency.
Diving deeper, the graph below plots individual companies in the Russell 1000 index broken out into YTD return buckets as of February 6th. On this date, IWB (an ETF tracking the Russell 1000) was up +3.8% YTD, so a taxable ETF investor who incepted on 1/1/20 had no opportunity to harvest losses. But if we examine the underlying constituents of the index, 41.8% of the holdings were negative, with 9.0% of those names down -10% or more. In essence, if you owned the individual names in the R1000 index rather than an ETF, the entire left side of the chart was available for loss harvesting. On this day alone we harvested $6,000 in the representative Direct Index Canvas account.
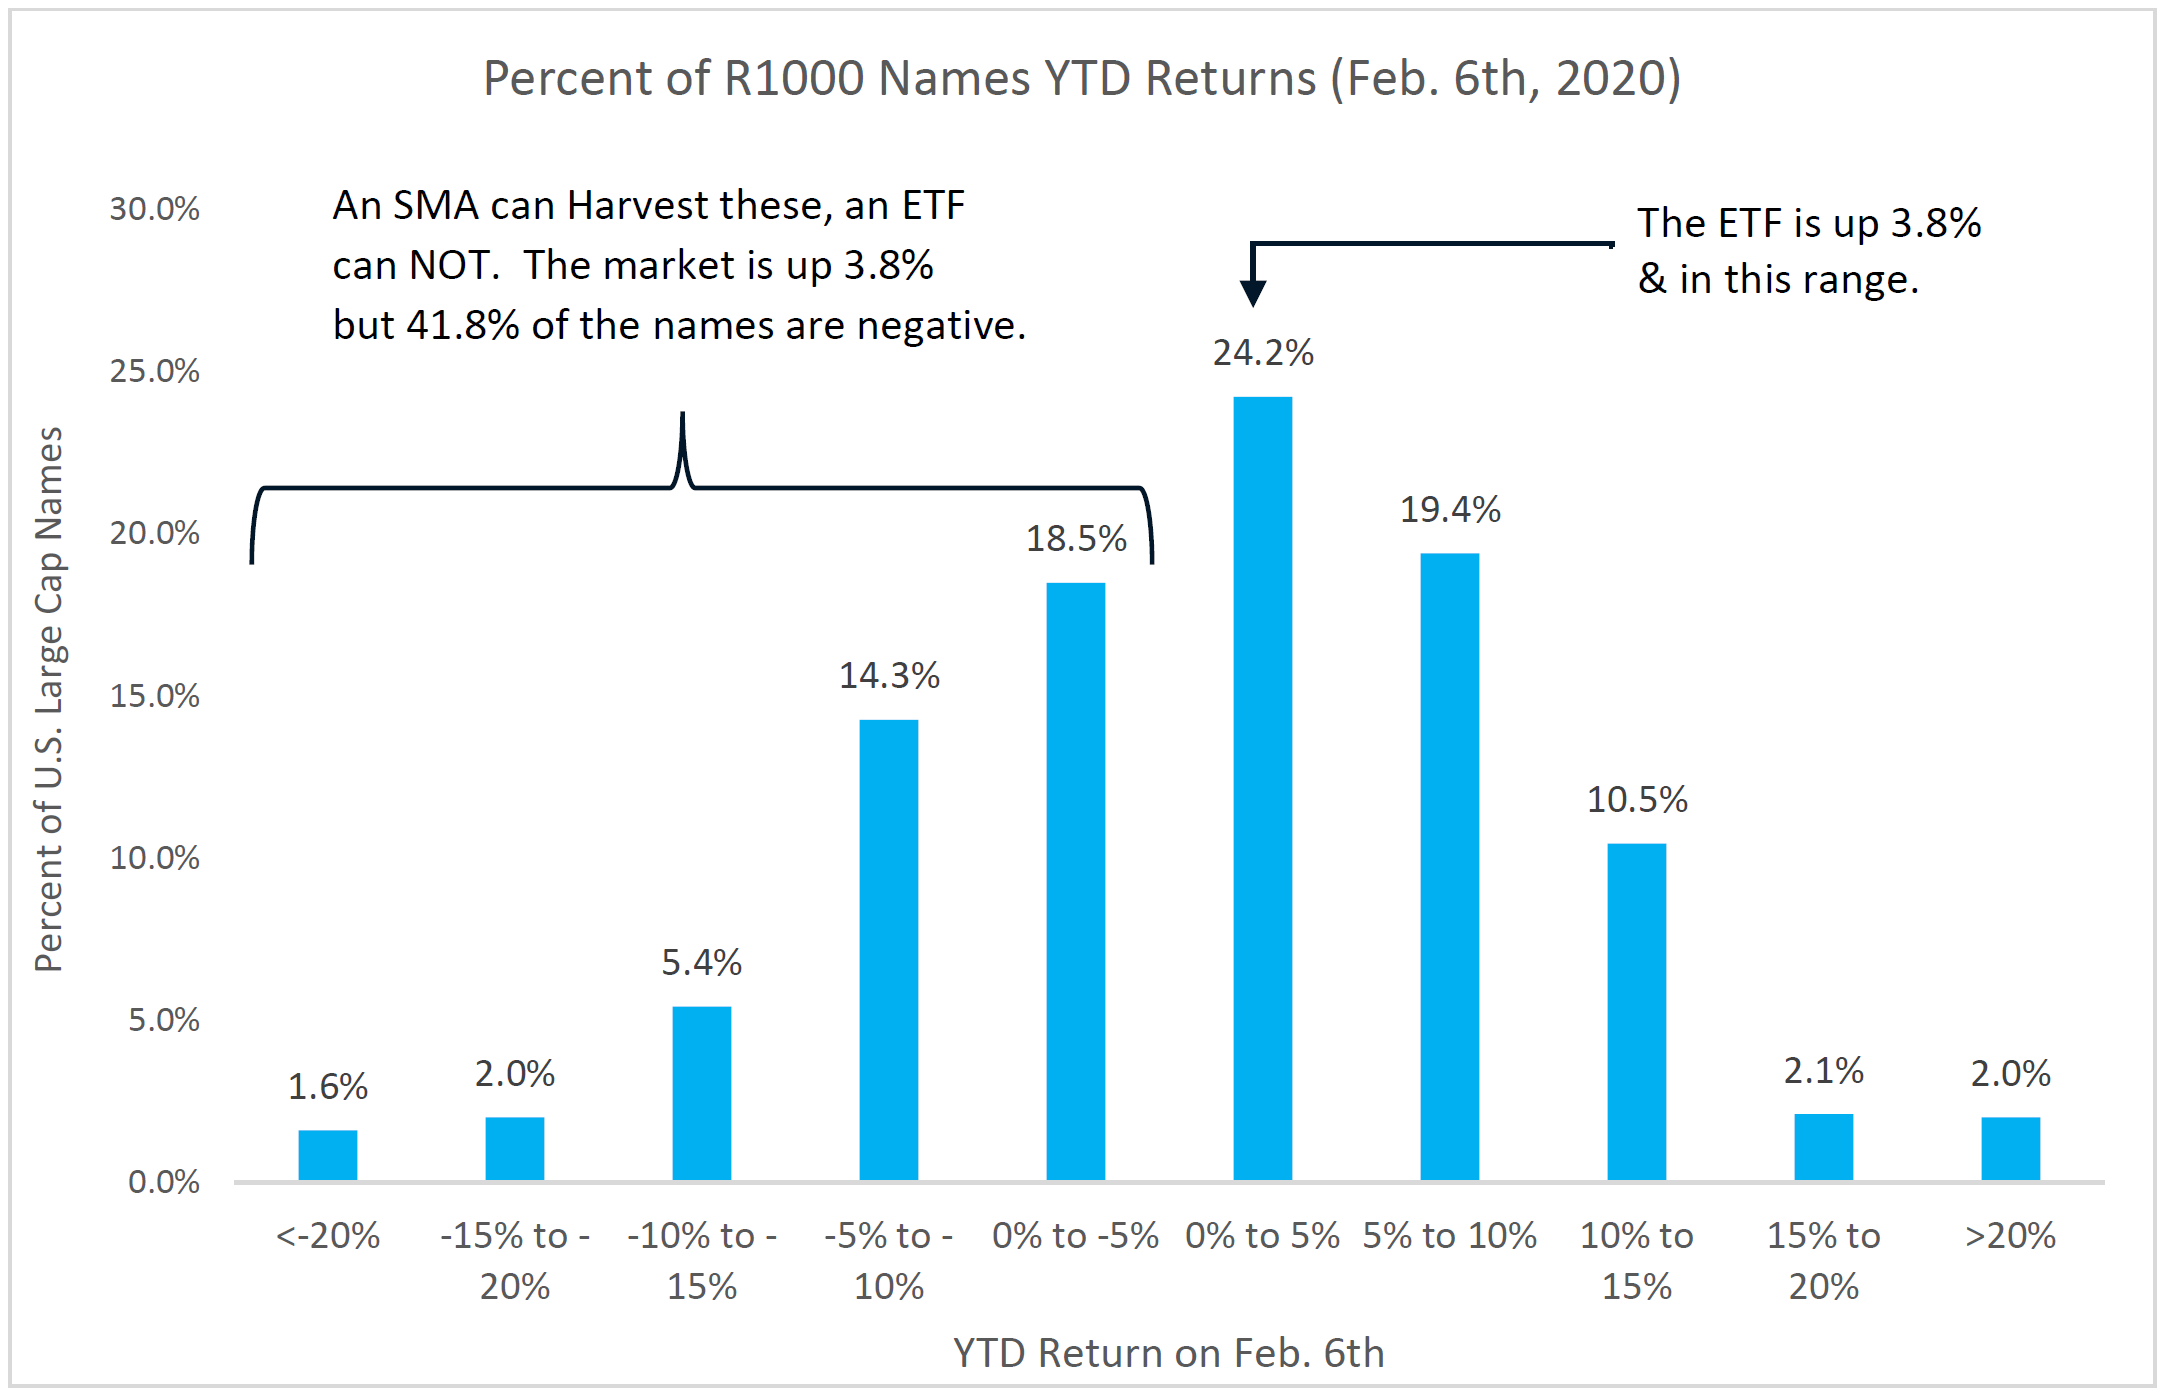
As alluded to earlier, even when a market-tracking product is up, 40% or more of the individual names may be down. Historically, the U.S. Large Cap market has been positive in 71% of calendar years but in each of those years, an average of 36% of stocks have delivered a negative return. Therefore, investors that choose to own the individual names through a separately managed account will likely be able to realize available losses even when the market is up – boosting after-tax return.
Sophisticated TLH is difficult and should be done using a systematic process and technology
Individual holdings and opportunistic harvesting offer many benefits to investors but tax loss harvesting at this level is exponentially more difficult. Loss harvesting with ETFs involves swapping one ETF for another that tracks a very similar yet different index (like the S&P500 (SPY) for the Russell 1000 (IWB)) to maintain the efficacy of underlying fundamentals while generating tax offsets. Sophisticated TLH at the individual stock level is not as simple as trading one stock for another: it is not trading Coke for Pepsi. This example offers a comprehendible explanation of what TLH is but is oversimplified since TLH in SMAs is not optimized via a 1-for-1 swap and must be able to account for many variables at once.
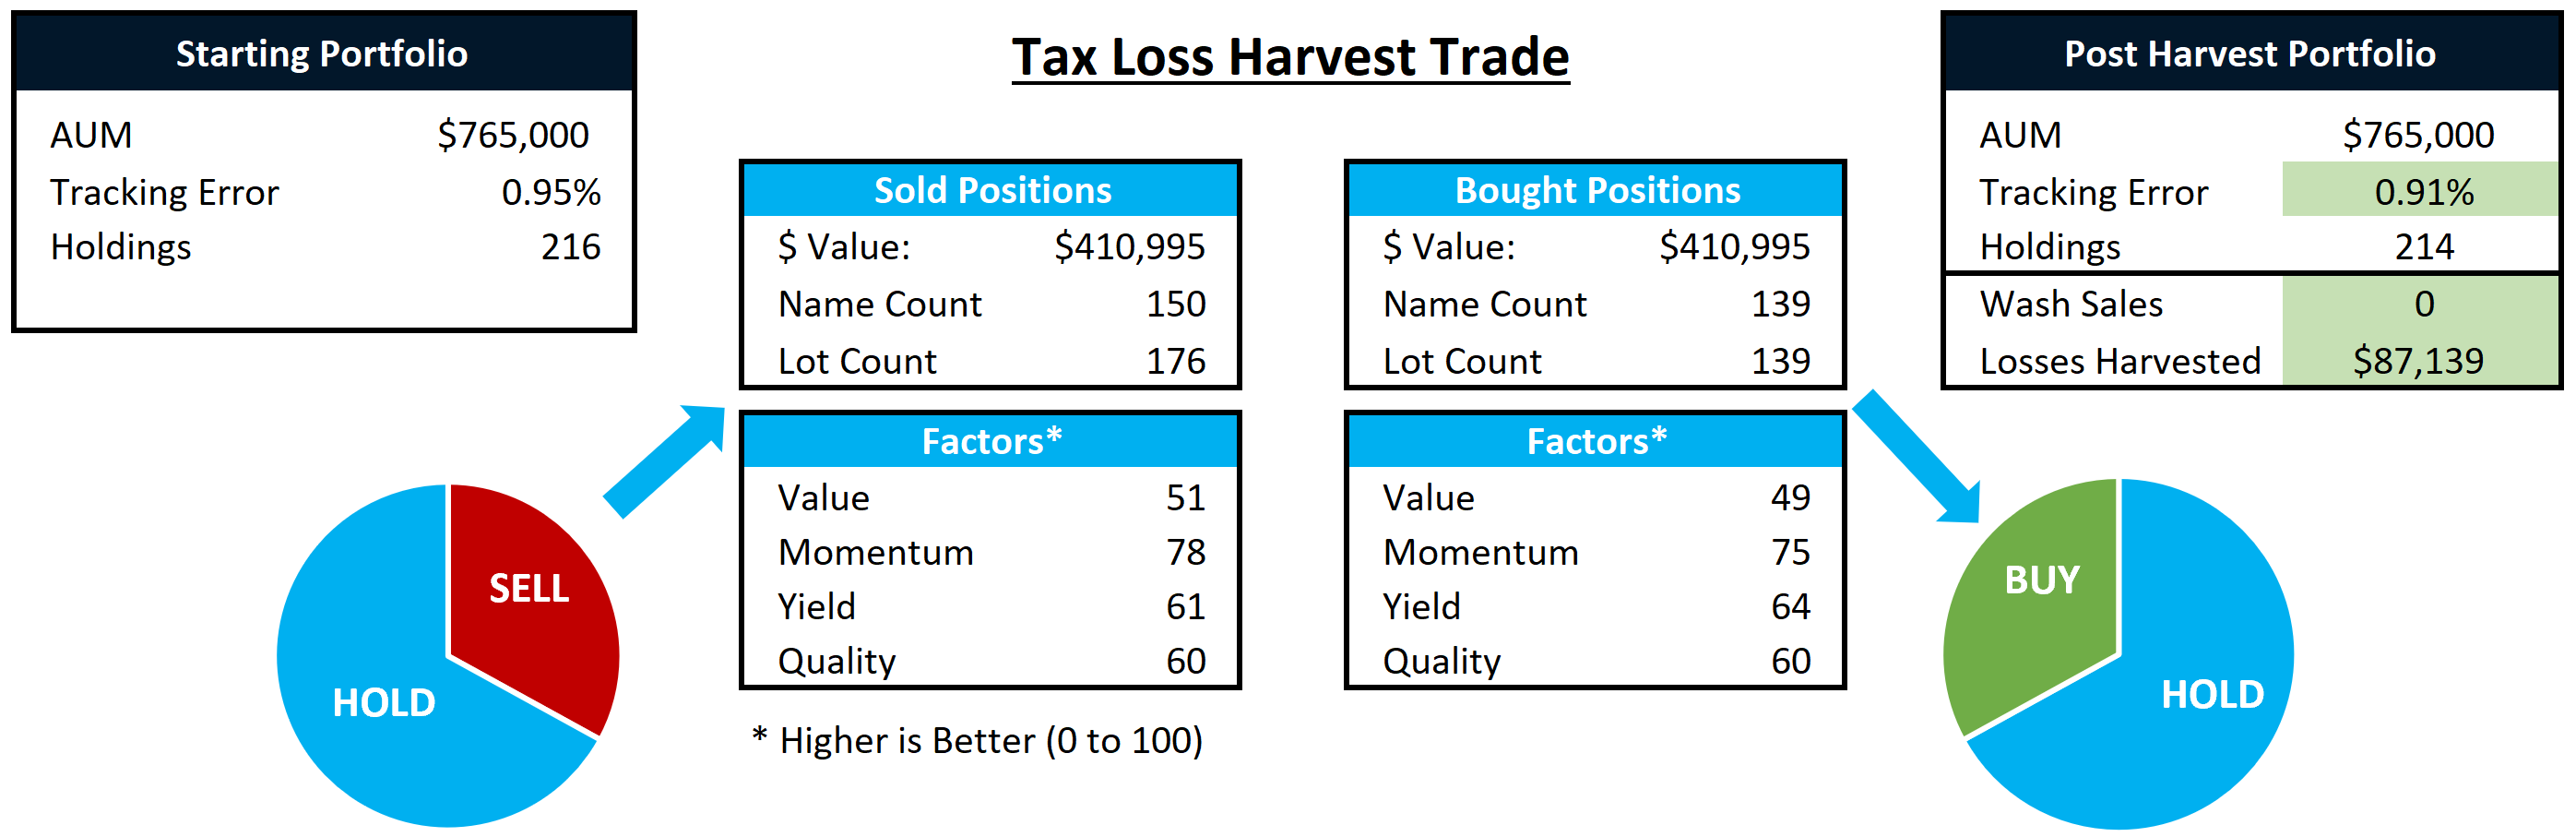
Take for example, the Canvas process which systematically sells a basket of securities at a loss and replaces it with a new basket of securities while controlling for 50+ risk characteristics, sectors, market caps, regions, etc.; minimizing Tracking Error to the target model/index; minimizing market impact and trading costs; avoiding wash sales (sometimes across multiple accounts); and maintaining custom factor and ESG preferences where applicable. In essence, this systematic process works to create the “same” portfolio through different names and weights while simultaneously building a tax asset.
Below is an example of a specific trade for the Direct Index we’ve been discussing. The March 20th trade sold 150 securities. The basket was replaced with 139 names. The result generated over $87,000 in harvested losses, reduced Tracking Error to the model portfolio, created no wash sales, maintained the underlying factor characteristics (return profile), and stayed within our defined risk controls.
As described above, this complex process must be done opportunistically and potentially across thousands of accounts at once. It is impossible to predict with any precision when the best opportunities to harvest will present themselves. Therefore, a software-based process that continually monitors for opportunities is better positioned to maximize tax alpha.
In the past, TLH could be a full-time job for one team member or more likely, not monitored at a frequency to maximize its full potential. When leveraging software like Canvas, advisors can save time and outsource this complex and time-intensive process so they can focus on building and deepening client relationships, knowing their client accounts are being optimally tax-managed according to client desires.
Conclusion
Tax loss harvesting can significantly reduce investor tax bills. But some market conditions present more opportunity than others (like we saw in March of 2020) and some approaches can better capitalize than others. When choosing a tax management strategy, make sure that it continually monitors for losses, utilizes individual holdings (not comingled funds like an ETF), and leverages systematic software with a paramount focus on speed, precision, and value. We’ve built Canvas to do just this so we can help financial advisors save on tax dollars and generate strong after-tax return for their clients.
Click Here to Sign-Up For Your Canvas Demo Today.
1 Here we are using a popular ETF IWB that tracks the U.S. Large Cap Market via the Russell 1000 Index. We could use any U.S. Large Cap ETF and results would be very similar, SPY, VOO, etc.
2 For this example, we are using a hypothetical Canvas representative account that funded January 1st with a $1,000,000 account size. All our taxable accounts in US Large Stocks had imbedded gains or losses on January 1, 2020 which makes comparisons to live accounts difficult.
3 Assumes 40.8% on short-term capital gains, 23.8% on long-term capital gains, and dividends taxed at a 20% rate. State and city-level considerations are not applied to the analysis.
GENERAL LEGAL DISCLOSURES & HYPOTHETICAL AND/OR BACKTESTED RESULTS DISCLAIMER
The material contained herein is intended as a general market commentary. Opinions expressed herein are solely those of O’Shaughnessy Asset Management, LLC and may differ from those of your broker or investment firm.
Please remember that past performance may not be indicative of future results. Different types of investments involve varying degrees of risk, and there can be no assurance that the future performance of any specific investment, investment strategy, or product (including the investments and/or investment strategies recommended or undertaken by O’Shaughnessy Asset Management, LLC), or any non-investment related content, made reference to directly or indirectly in this piece will be profitable, equal any corresponding indicated historical performance level(s), be suitable for your portfolio or individual situation, or prove successful. Due to various factors, including changing market conditions and/or applicable laws, the content may no longer be reflective of current opinions or positions. Moreover, you should not assume that any discussion or information contained in this piece serves as the receipt of, or as a substitute for, personalized investment advice from O’Shaughnessy Asset Management, LLC. Any individual account performance information reflects the reinvestment of dividends (to the extent applicable), and is net of applicable transaction fees, O’Shaughnessy Asset Management, LLC’s investment management fee (if debited directly from the account), and any other related account expenses. Account information has been compiled solely by O’Shaughnessy Asset Management, LLC, has not been independently verified, and does not reflect the impact of taxes on non-qualified accounts. In preparing this report, O’Shaughnessy Asset Management, LLC has relied upon information provided by the account custodian. Please defer to formal tax documents received from the account custodian for cost basis and tax reporting purposes. Please remember to contact O’Shaughnessy Asset Management, LLC, in writing, if there are any changes in your personal/financial situation or investment objectives for the purpose of reviewing/evaluating/revising our previous recommendations and/or services, or if you want to impose, add, or modify any reasonable restrictions to our investment advisory services. Please Note: Unless you advise, in writing, to the contrary, we will assume that there are no restrictions on our services, other than to manage the account in accordance with your designated investment objective. Please Also Note: Please compare this statement with account statements received from the account custodian. The account custodian does not verify the accuracy of the advisory fee calculation. Please advise us if you have not been receiving monthly statements from the account custodian. Historical performance results for investment indices and/or categories have been provided for general comparison purposes only, and generally do not reflect the deduction of transaction and/or custodial charges, the deduction of an investment management fee, nor the impact of taxes, the incurrence of which would have the effect of decreasing historical performance results. It should not be assumed that your account holdings correspond directly to any comparative indices. To the extent that a reader has any questions regarding the applicability of any specific issue discussed above to his/her individual situation, he/she is encouraged to consult with the professional advisor of his/her choosing. O’Shaughnessy Asset Management, LLC is neither a law firm nor a certified public accounting firm and no portion of the newsletter content should be construed as legal or accounting advice. A copy of the O’Shaughnessy Asset Management, LLC’s current written disclosure statement discussing our advisory services and fees is available upon request
The risk-free rate used in the calculation of Sortino, Sharpe, and Treynor ratios is 5%, consistently applied across time
The universe of All Stocks consists of all securities in the Chicago Research in Security Prices (CRSP) dataset or S&P Compustat Database (or other, as noted) with inflation-adjusted market capitalization greater than $200 million as of most recent year-end. The universe of Large Stocks consists of all securities in the Chicago Research in Security Prices (CRSP) dataset or S&P Compustat Database (or other, as noted) with inflation-adjusted market capitalization greater than the universe average as of most recent year-end. The stocks are equally weighted and generally rebalanced annually
Hypothetical performance results shown on the preceding pages are backtested and do not represent the performance of any account managed by OSAM, but were achieved by means of the retroactive application of each of the previously referenced models, certain aspects of which may have been designed with the benefit of hindsight
The hypothetical backtested performance does not represent the results of actual trading using client assets nor decision-making during the period and does not and is not intended to indicate the past performance or future performance of any account or investment strategy managed by OSAM. If actual accounts had been managed throughout the period, ongoing research might have resulted in changes to the strategy which might have altered returns. The performance of any account or investment strategy managed by OSAM will differ from the hypothetical backtested performance results for each factor shown herein for a number of reasons, including without limitation the following:
- Although OSAM may consider from time to time one or more of the factors noted herein in managing any account, it may not consider all or any of such factors. OSAM may (and will) from time to time consider factors in addition to those noted herein in managing any account.
- OSAM may rebalance an account more frequently or less frequently than annually and at times other than presented herein.
- OSAM may from time to time manage an account by using non-quantitative, subjective investment management methodologies in conjunction with the application of factors.
- The hypothetical backtested performance results assume full investment, whereas an account managed by OSAM may have a positive cash position upon rebalance. Had the hypothetical backtested performance results included a positive cash position, the results would have been different and generally would have been lower.
- The hypothetical backtested performance results for each factor do not reflect any transaction costs of buying and selling securities, investment management fees (including without limitation management fees and performance fees), custody and other costs, or taxes – all of which would be incurred by an investor in any account managed by OSAM. If such costs and fees were reflected, the hypothetical backtested performance results would be lower.
- The hypothetical performance does not reflect the reinvestment of dividends and distributions therefrom, interest, capital gains and withholding taxes.
- Accounts managed by OSAM are subject to additions and redemptions of assets under management, which may positively or negatively affect performance depending generally upon the timing of such events in relation to the market’s direction.
- Simulated returns may be dependent on the market and economic conditions that existed during the period. Future market or economic conditions can adversely affect the returns.
Please Note: Socially Responsible Investing Limitations. Socially Responsible Investing involves the incorporation of Environmental, Social and Governance considerations into the investment due diligence process (“ESG). There are potential limitations associated with allocating a portion of an investment portfolio in ESG securities (i.e., securities that have a mandate to avoid, when possible, investments in such products as alcohol, tobacco, firearms, oil drilling, gambling, etc.). The number of these securities may be limited when compared to those that do not maintain such a mandate. ESG securities could underperform broad market indices. Investors must accept these limitations, including potential for underperformance. Correspondingly, the number of ESG mutual funds and exchange traded funds are few when compared to those that do not maintain such a mandate. As with any type of investment (including any investment and/or investment strategies recommended and/or undertaken by OSAM), there can be no assurance that investment in ESG securities or funds will be profitable, or prove successful.


