Climbing the Maturity Wall of Worry
By Ehren Stanhope, Jesse Livermore+
December 2023
The recent increase in interest rates has generated questions in the investment community about the potential impact that rising debt costs might have on corporate earnings. Thus far, the impact has been minimal, given that companies termed a significant portion of their debt out to longer maturities during the low-rate period that preceded and persisted through the Covid pandemic. Still, in every area of the U.S. equity space, there are maturities coming due in the next few years. If current interest rate conditions are in place when they arrive, what will the effect on earnings be?
In this piece, we’re going to use our research database to answer that question.1 We’re going to examine the debt structures of 22 different indexes—the S&P 500, a proprietary U.S. Small-Mid Cap index (US SMID), similar to the Rusell 2500, and 10 sector sub-indexes within each—to quantify the earnings losses that are likely to occur over time as a result of debt refinancings under different interest rate conditions.
Though we do not have a specific view on the future path of rates, when we assume that current interest conditions will persist in the coming years 2, we reach the following conclusions:
1. the impact on S&P 500 earnings will be small-to-moderate,
2. the impact on US SMID earnings will be larger, and
3. the impact on the earnings of specific sectors within those indexes will be quite large—potentially large enough to warrant the price corrections that those sectors have been experiencing.
Trends in Profit Margins: Motivating the Question
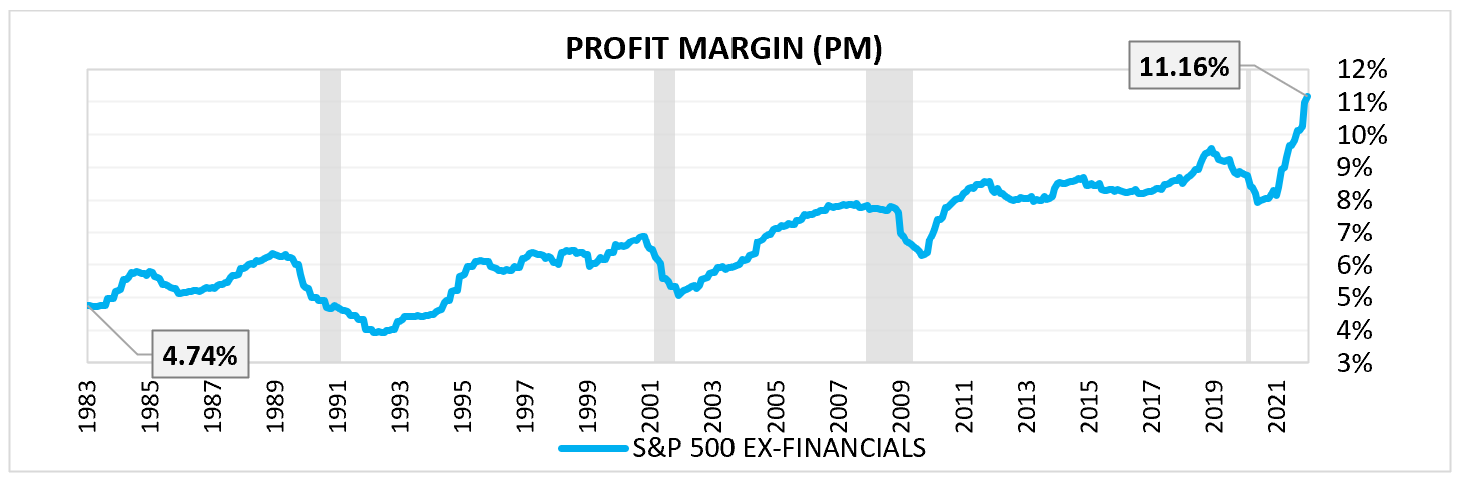
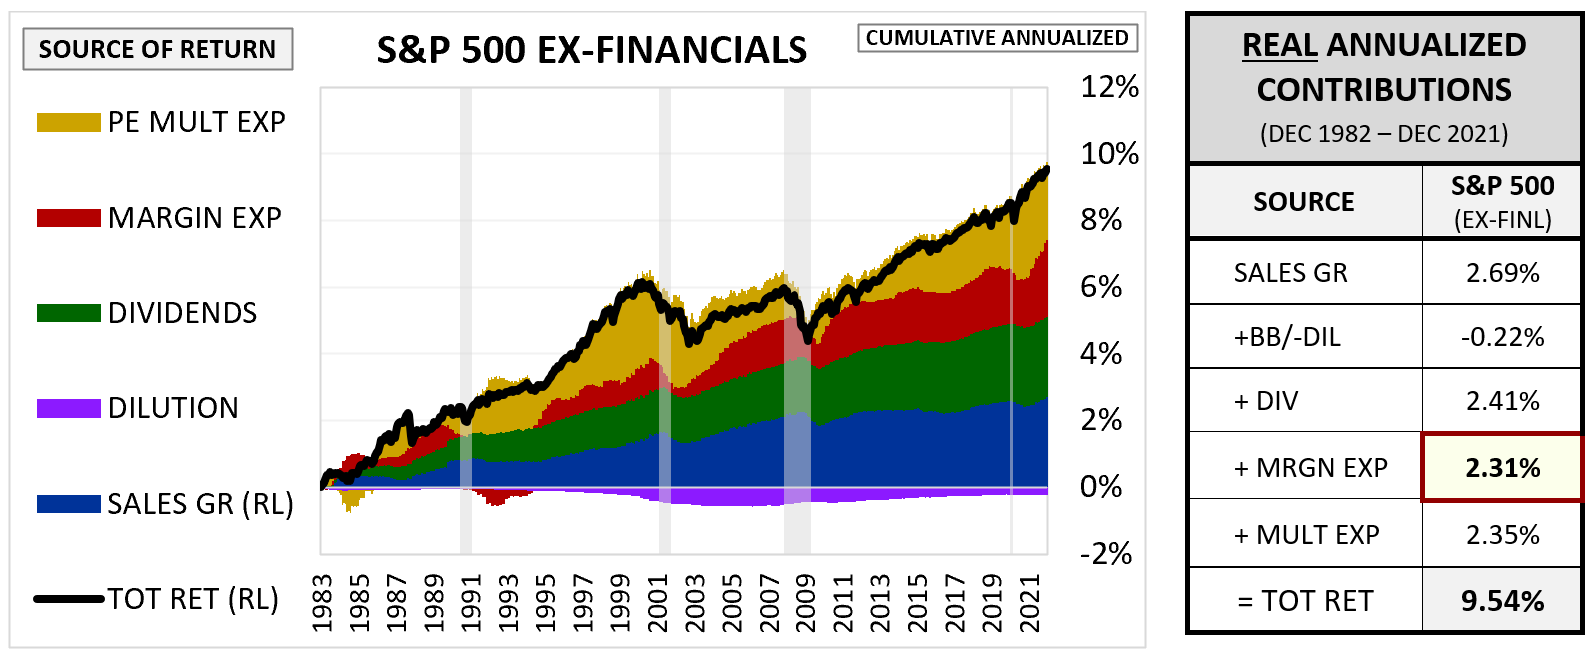
Before we begin, it’s worth clarifying why the “cost” aspect of interest rates represents a source of risk that investors should consider. From 1982 through 2021, the net profit margins of S&P 500 companies more than doubled.3
On a real annualized basis, this doubling accounted for 2.31% of the index’s 9.54% total return, more than half of the “extra” return that the index generated relative to its multi-century average of 6%.4
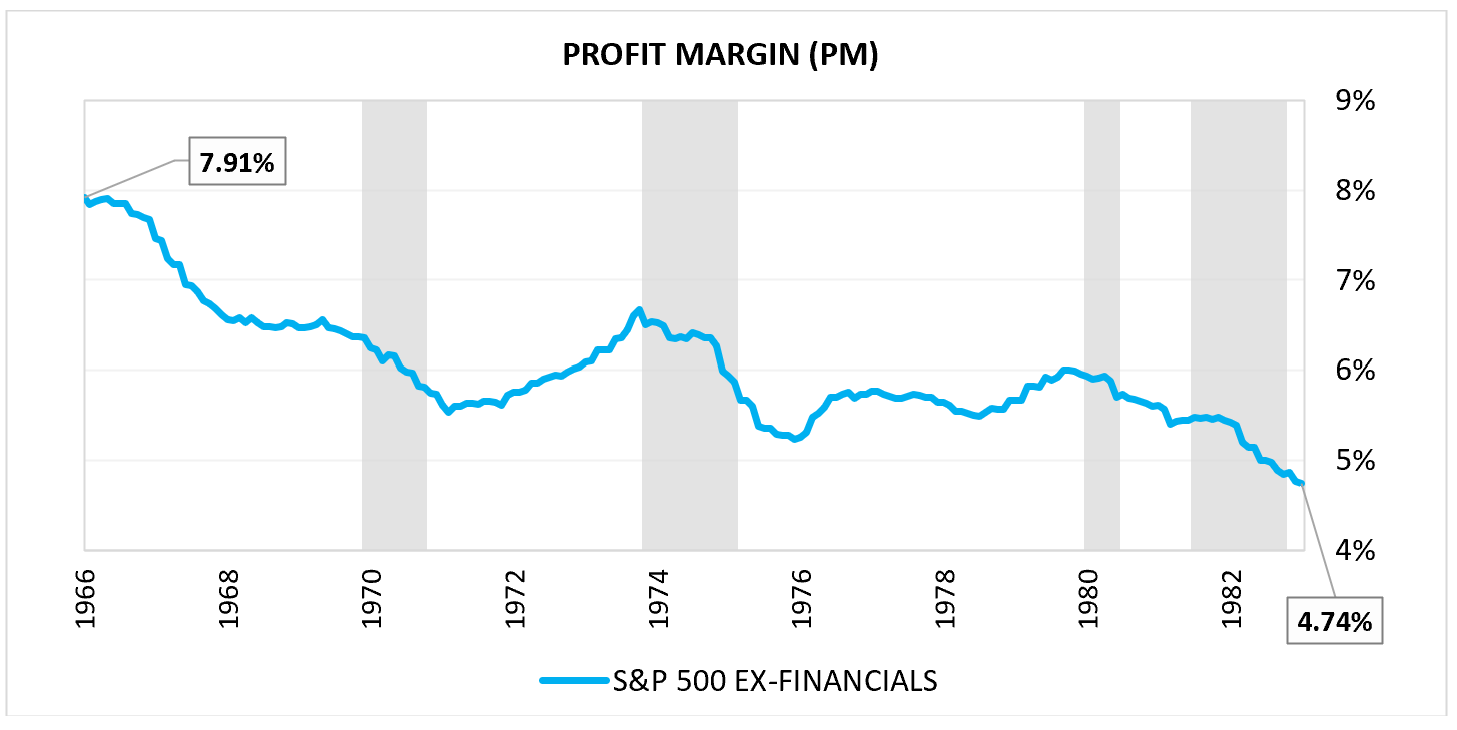
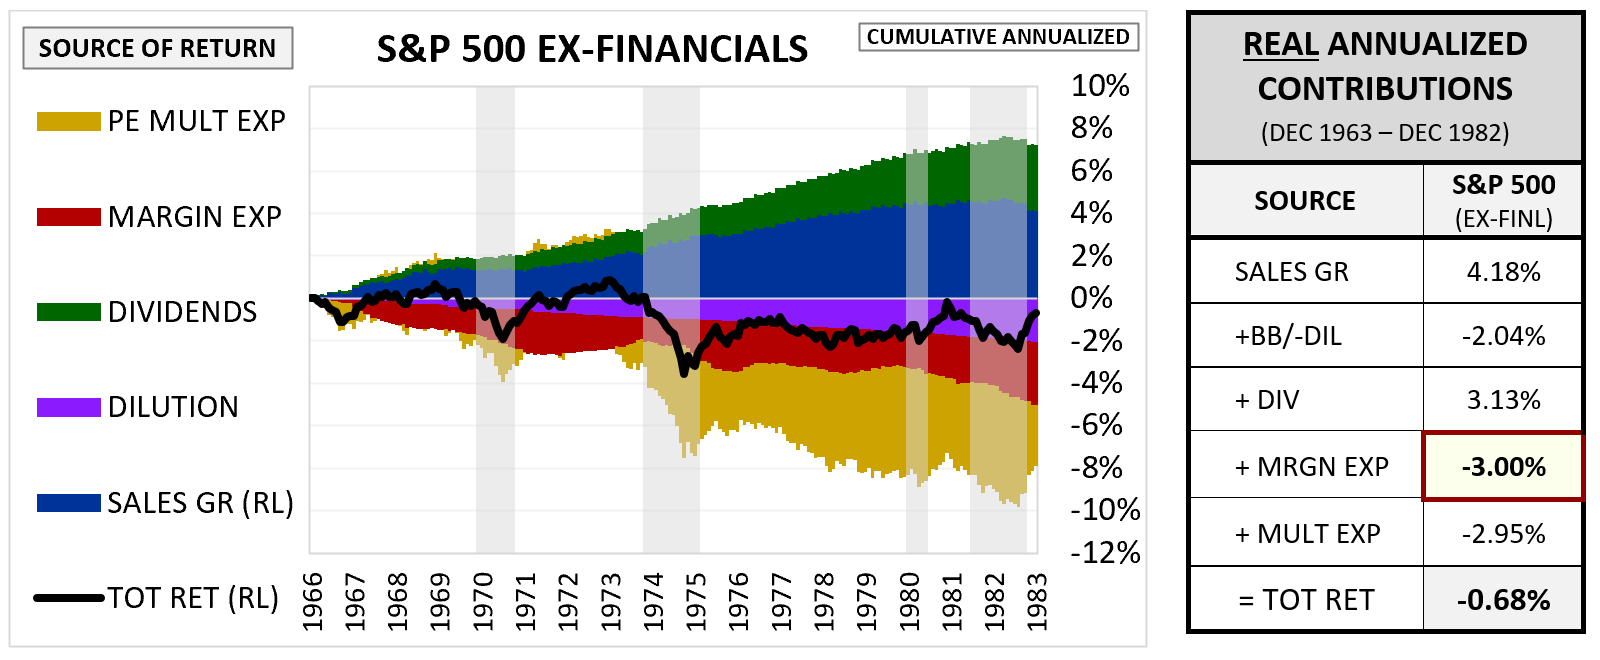
Given the persistently rising trend in profit margins that occurred from the early 1980s through the recent peak, it’s tempting to conclude that profit margins always naturally follow that trend, that they always go up over the long-term, as an economic rule. But prior periods of history firmly refute that conclusion. Profit margins can go down just as easily as they go up, and they actually have gone down for extended periods of time across diverse market regimes. From December 1965 through December 1982, for example, they fell in a rolling line from 7.91% down to 4.74%.
This decline reduced the total return over the period by 3.00% per year and helped secure an abysmal multi-decade outcome in which investors in the index received no real return at all.
Now, as the reader surely knows, something impactful happened from 1965 to 1982. Interest rates—more specifically, the market-based corporate interest rates that U.S. companies borrow at—woke up from the sleepy levels of the post-WW2 period and embarked on an unprecedented upward climb that took them well into the double digits. Something similarly impactful happened from 1982 through the end of 2021, but in the opposite direction: interest rates reversed course and entered into a generational decline that took them to lows that had never before been seen in any period of U.S. history.
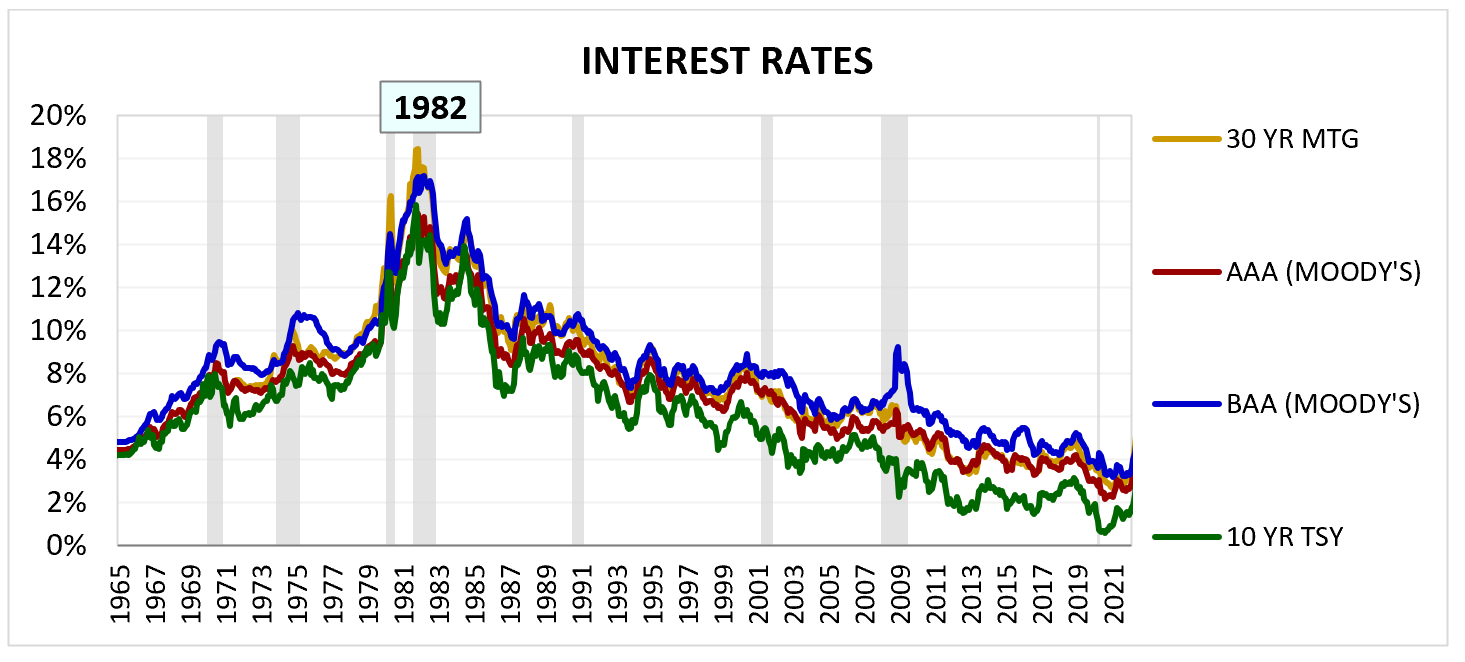
Given the peculiar coincidence in timing, it’s reasonable to ask the question: did the interest rate increases that occurred from 1965 to 1982 cause the profit margin declines that were observed during that period? Similarly, did the interest rate declines that occurred from 1982 to 2021 cause the profit margin increases that were subsequently observed?
The experience from the end of 2021 to now appears to support a yes answer. In that period, interest rates and profit margins once again changed course together, with interest rates rising and profit margins falling.
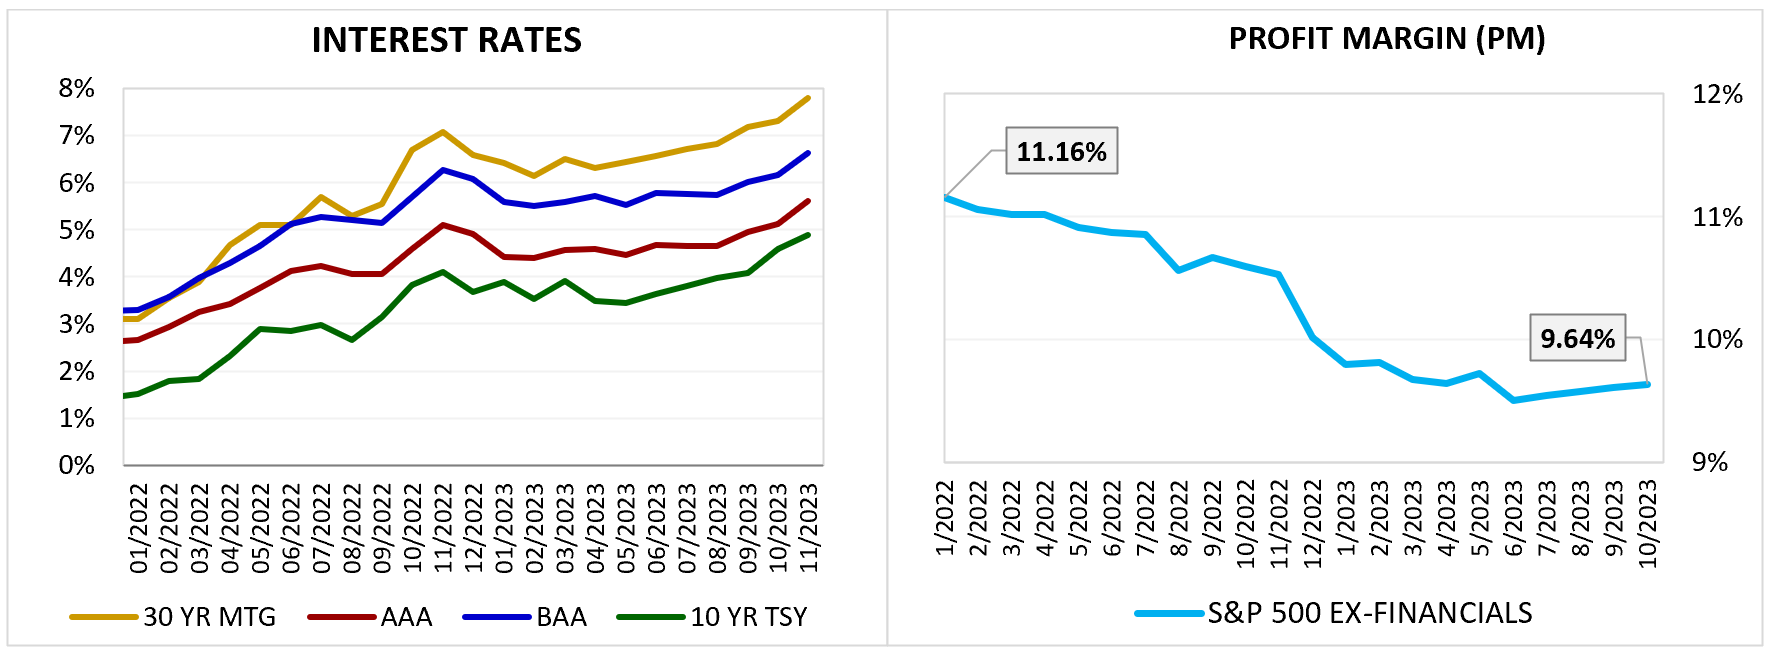
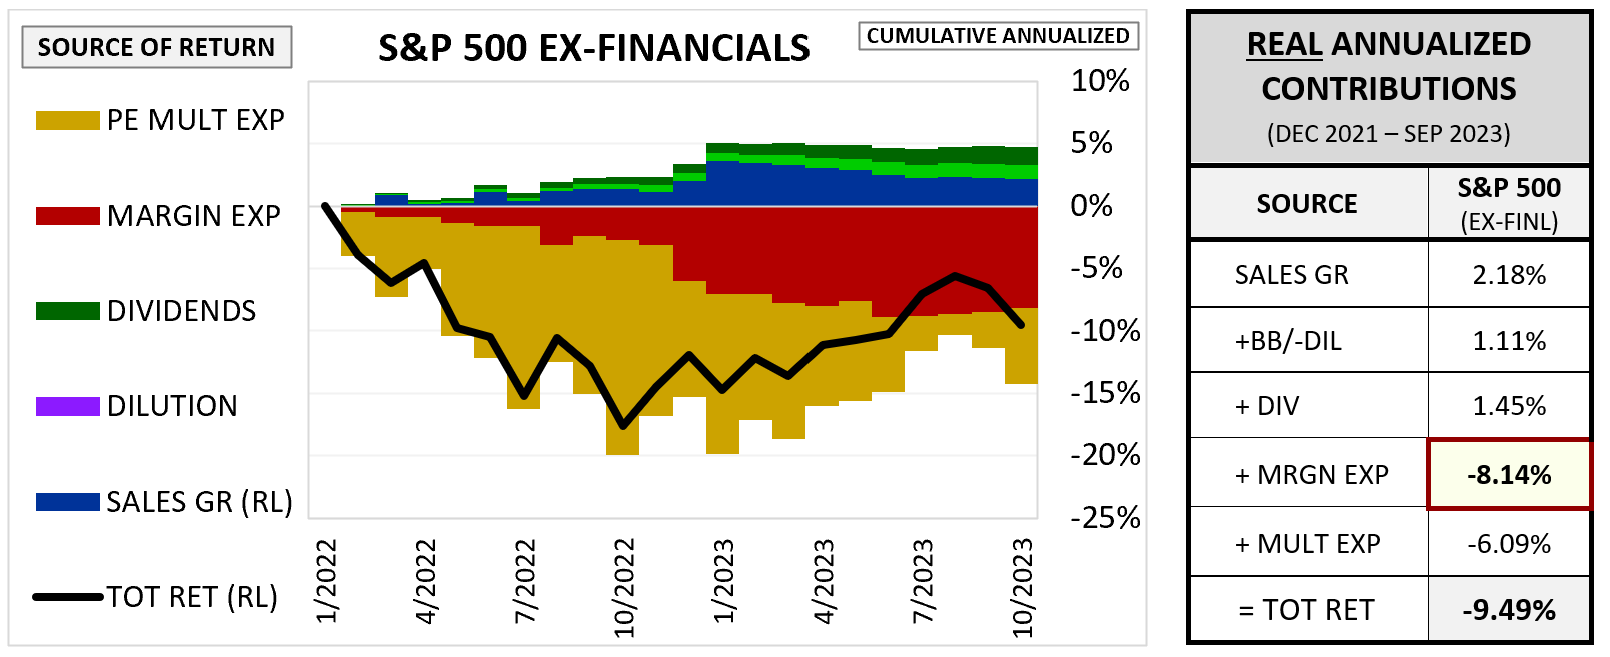
Since 2021, profit margin decline has been the single largest contributor to the S&P 500’s negative overall performance. From the end of December 2021 through the end of September 2023, it accounts for 8.14% of the index’s 9.49% annualized loss after inflation.5
To push back against the suggestion here, we know that the interest rate increase observed since December 2021 cannot have been a direct cause of the profit margin decline experienced since then, because the increase has not yet generated a meaningful increase in what the corporate sector is actually paying. As the chart below confirms, increases in interest rates translate into increases in corporate interest expense with a significant lag, and that lag has not yet arrived.
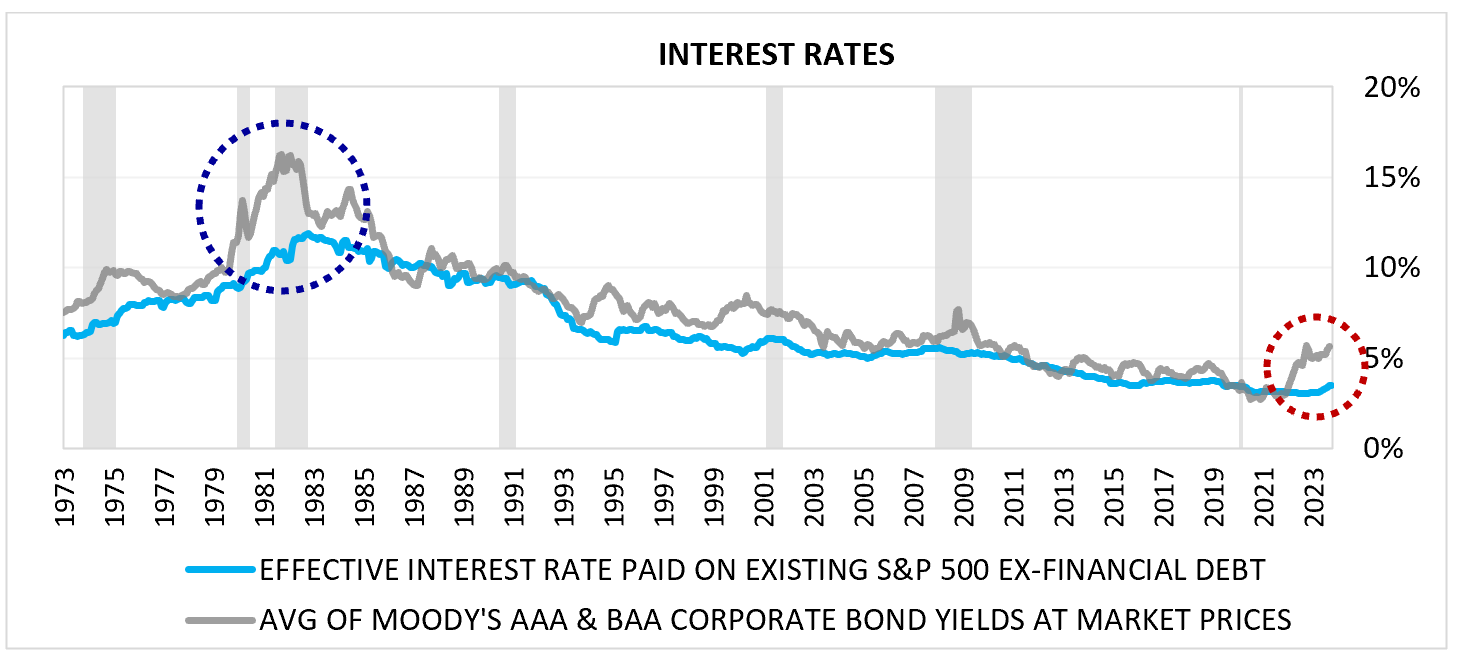
The reason for the lag is clear: corporations tend to borrow money at fixed rates over the medium and long-term. When market yields rise, it takes time for their existing stocks of debt to mature and roll over at the new higher rates.
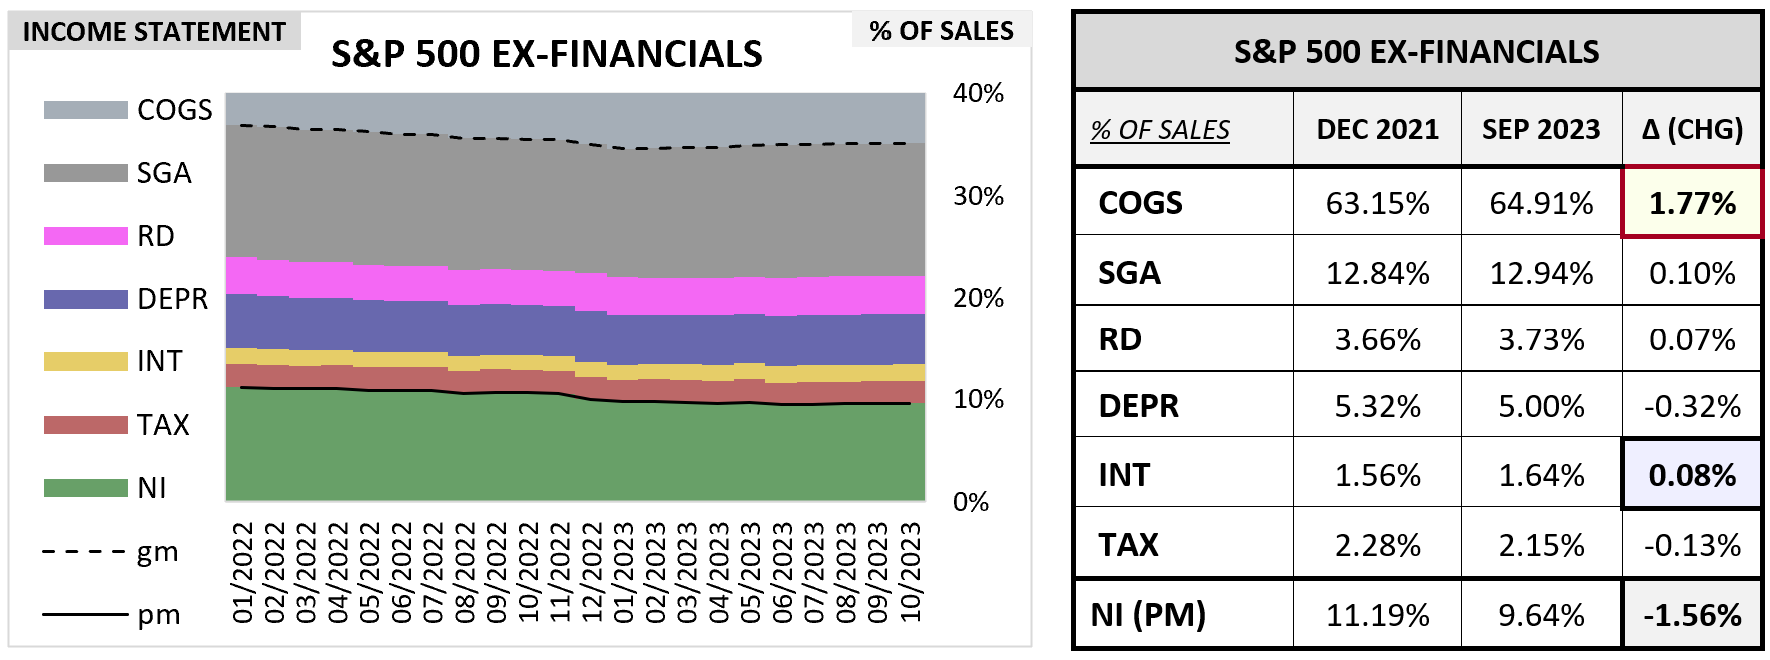
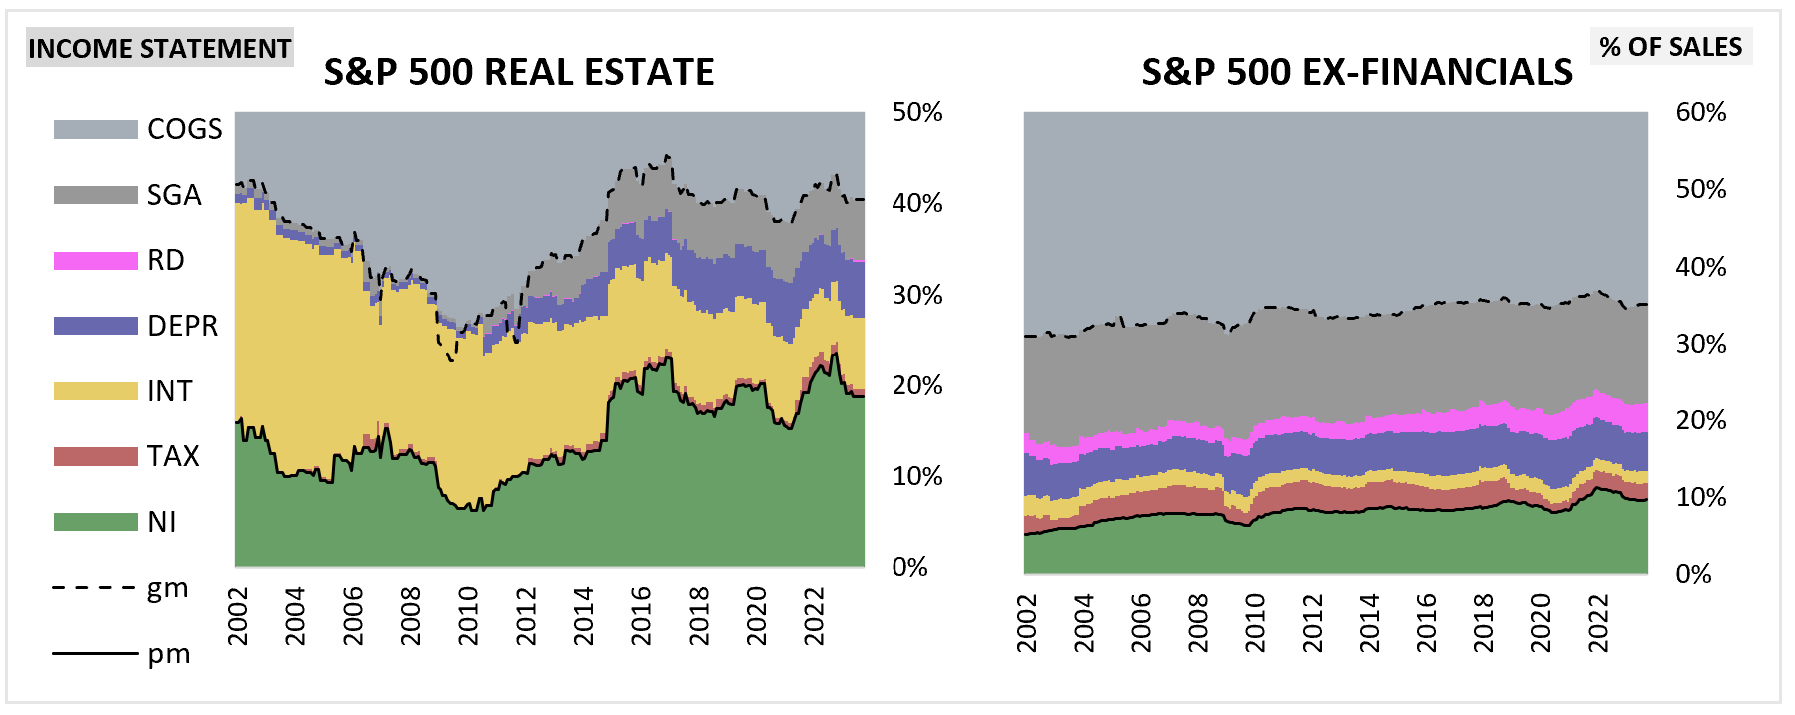
As illustrated in the chart and table below, the driver of the profit margin decline since the end of 2021 has been increases in the cost of goods sold (COGS), which the corporate sector hasn’t been able to fully pass on in pricing, leading to a compression in gross margins that has carried down to profit margins. Every other component of the S&P 500’s expense structure, including interest expense, has remained essentially unchanged as a percentage of total sales.
It’s hard to get reliable income statement data at a granular level for the period before the mid-1970s, but if we look at the period from the mid-1970s through the end of 1982, we see that rising interest expense (as a percentage of sales) made a greater contribution to the profit margin decline of that period.
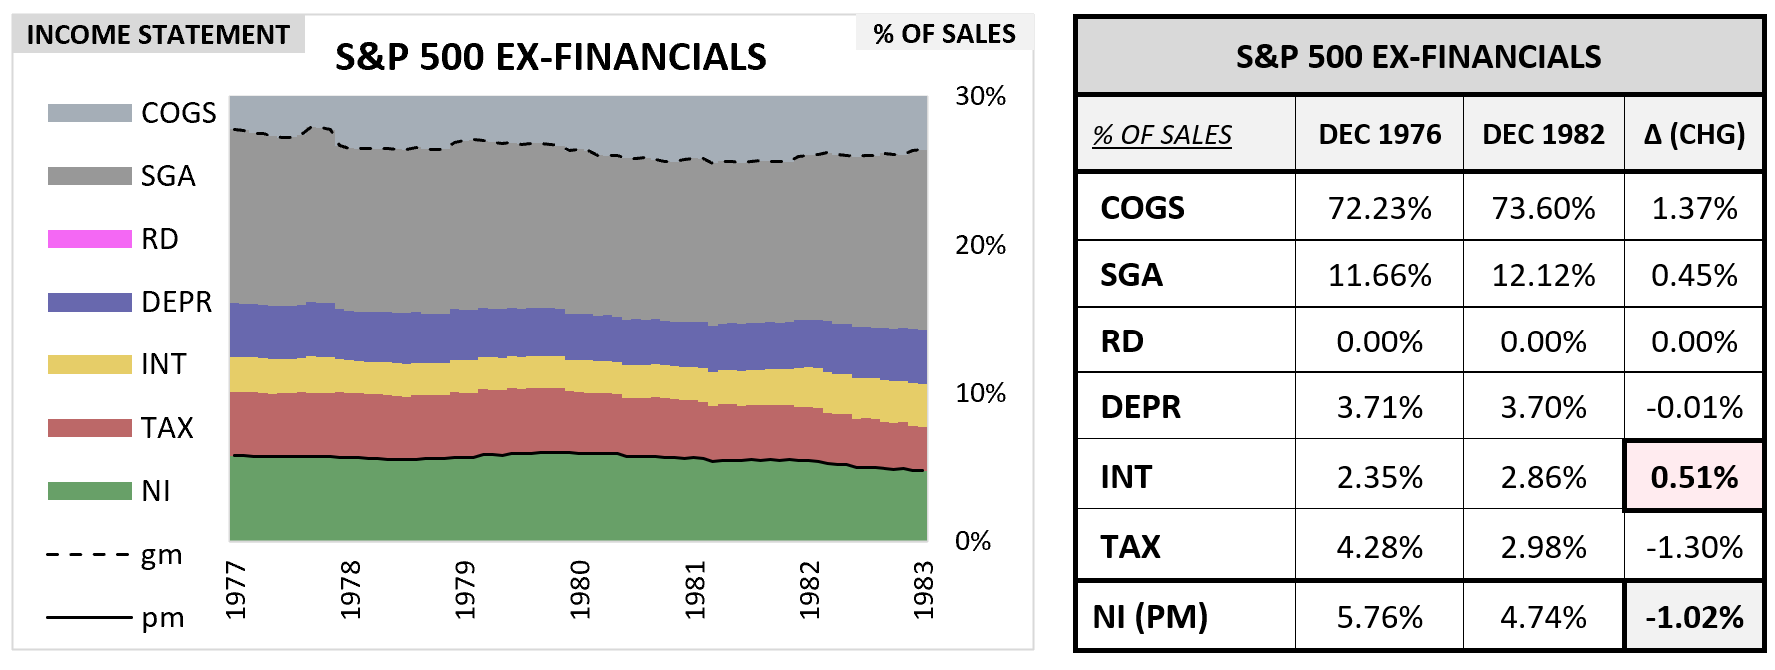
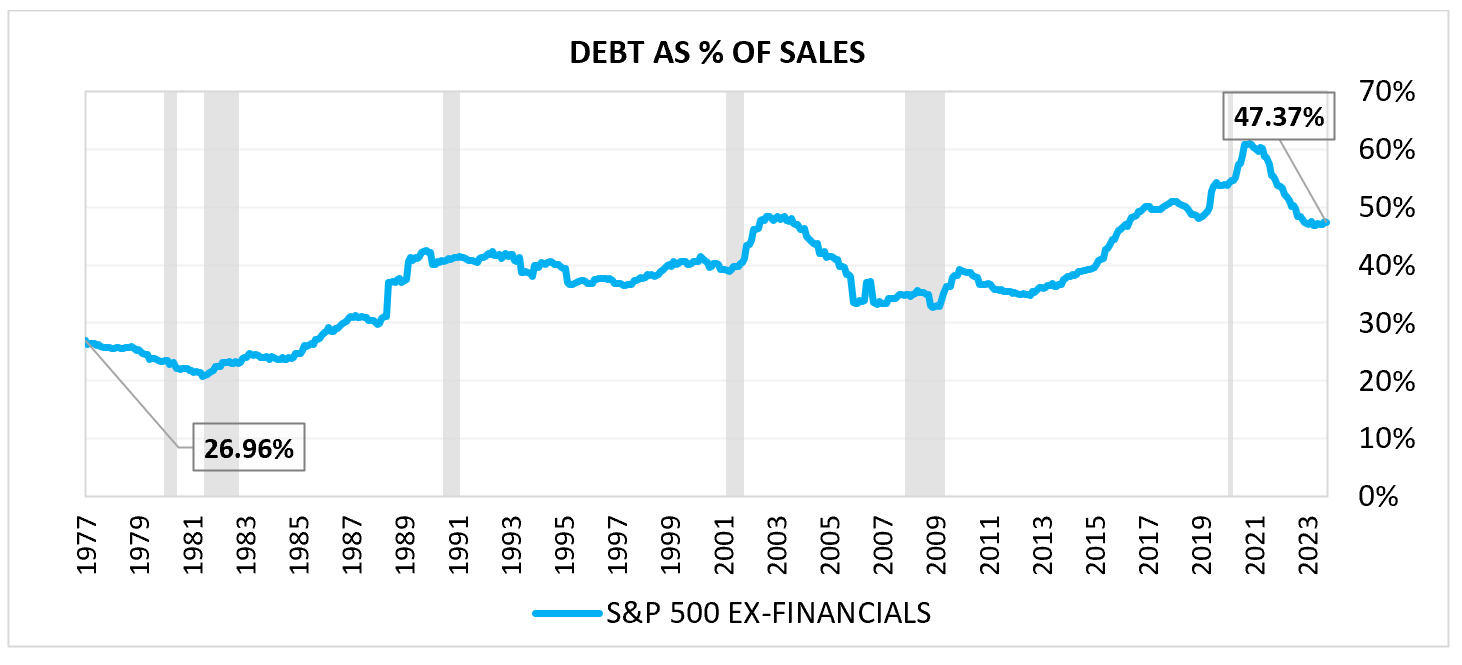
At +0.51%, the increase in interest expense during the period is smaller than what most of us would have expected, but we have to remember that interest rates are not the only factor that determine total interest expense. The other factor is the debt level. In the 1970s and early 1980s, the S&P 500’s debt level, measured as a percentage of its sales, was relatively low, half of what it is today, which is what allowed the index to absorb the sharp increase in interest rates without an outsized effect on its profit margin.
The outcome from the end of 1982 through the end of 2021, however, was quite different from these other two periods. In that period, falling interest rates made a substantial contribution to both the profit margin expansion and the earnings growth that occurred.
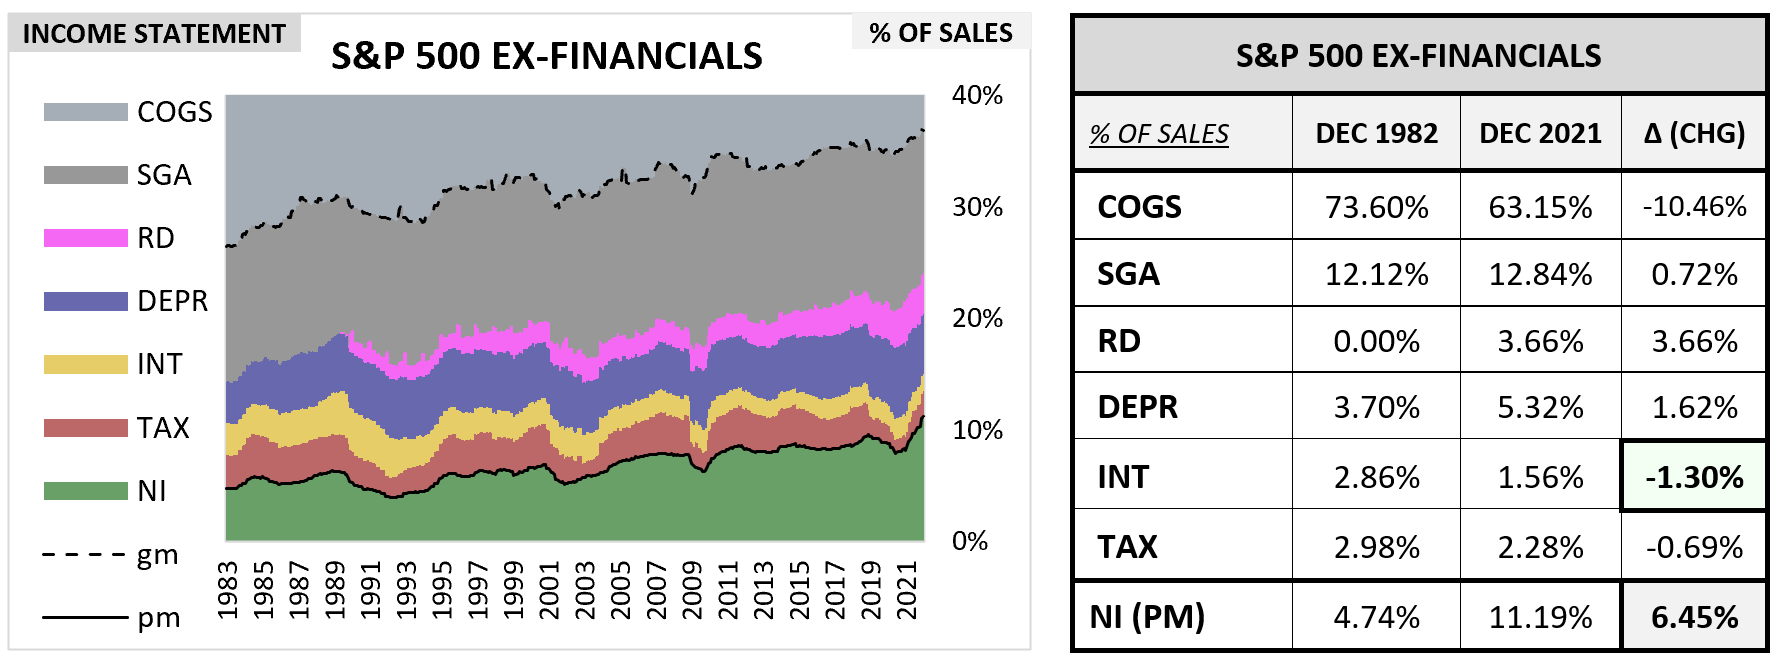
Interest expense declined by 1.30% of sales, adding 1.30% to the profit margin. And this change doesn’t fully capture the impact of the interest rate decline, since debt levels for the index effectively doubled relative to sales during the period in which it occurred. The interest rate decline was impactful enough to bring down total interest expense by 1.30% of sales even with the doubling of debt.
What makes today’s situation risky is that the corporate sector is entering a period of elevated interest rates not from the depressed debt levels of 1982, but from levels that are almost twice as high. How much profit margin and earnings power would the corporate sector lose if it were forced to pay current market rates on that debt? That’s the question that we want to answer.
Impact on Profit Margins and Earnings
Right now, the corporate sector is temporarily insulated from the immediate effects of interest rate increases by the fact that it issued substantial amounts of medium and long-term debt under the low interest rate conditions of the last decade. For the S&P 500, the charts below show the schedule by which that debt will mature.
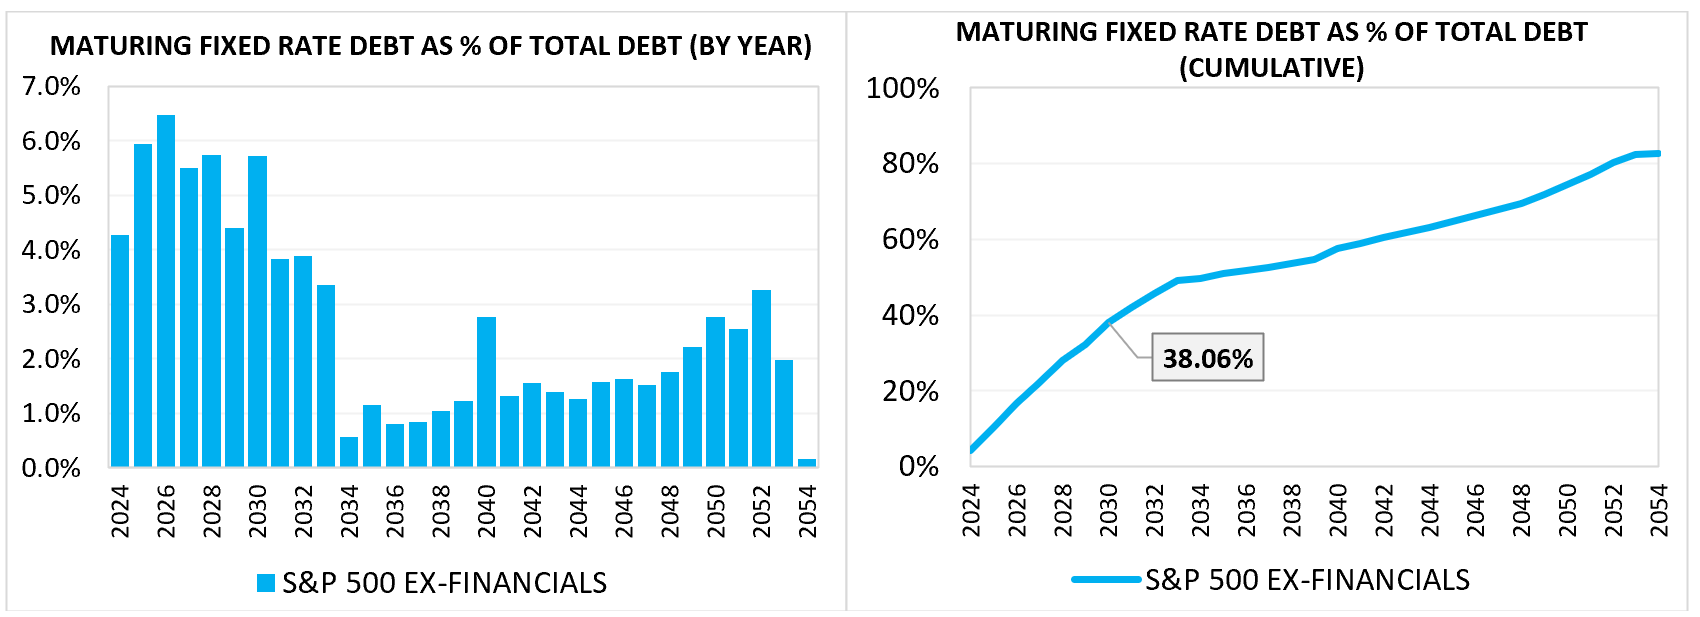
The chart on the left, sometimes referred to as a chart of the “maturity wall”, shows the stock of existing fixed rate S&P 500 debt that is set to mature in each year as a percentage of the total existing stock of S&P 500 debt, both variable and fixed rate. The chart on the right shows the cumulative stock of existing fixed rate debt that will have matured through each year as a percentage of that same total.
To describe the charts in plain language, in 2024, about 4% of S&P 500 debt will mature. In 2025, about 6% will mature. In 2026, about 6.5% will mature. And so on. Through 2030, a year that we’re going to arbitrarily use as a cutoff point for the analysis, roughly 38% of the total existing stock of S&P 500 debt will have matured.6
To measure the earnings impact of the arrival of these maturities, we need two primary pieces of information: (1) the amount of existing debt that will be maturing, expressed as a percentage of sales, and (2) the difference between the current coupon rate paid on that debt and the future rate that will be paid, when the debt is refinanced at market yields. From these two pieces of information, we can calculate the profit margin change (i.e. the change in interest expense as a percentage of sales) and the change in earnings that it will equate to, with other variables held constant.
We can obtain (1) from charts that we’ve already presented. All we need to do is multiply the percentage of debt maturing each year by the total debt as a percentage of sales. For a broad index, we can approximate (2) by assuming that the increase in interest rates paid upon refinancing will mirror the overall increase in corporate interest rates that has occurred.
The chart below shows the increase in interest rates for four major categories of fixed rate debt relative to (minus) the average interest rate on that debt from 2012 to 2023, with current values boxed on the right:
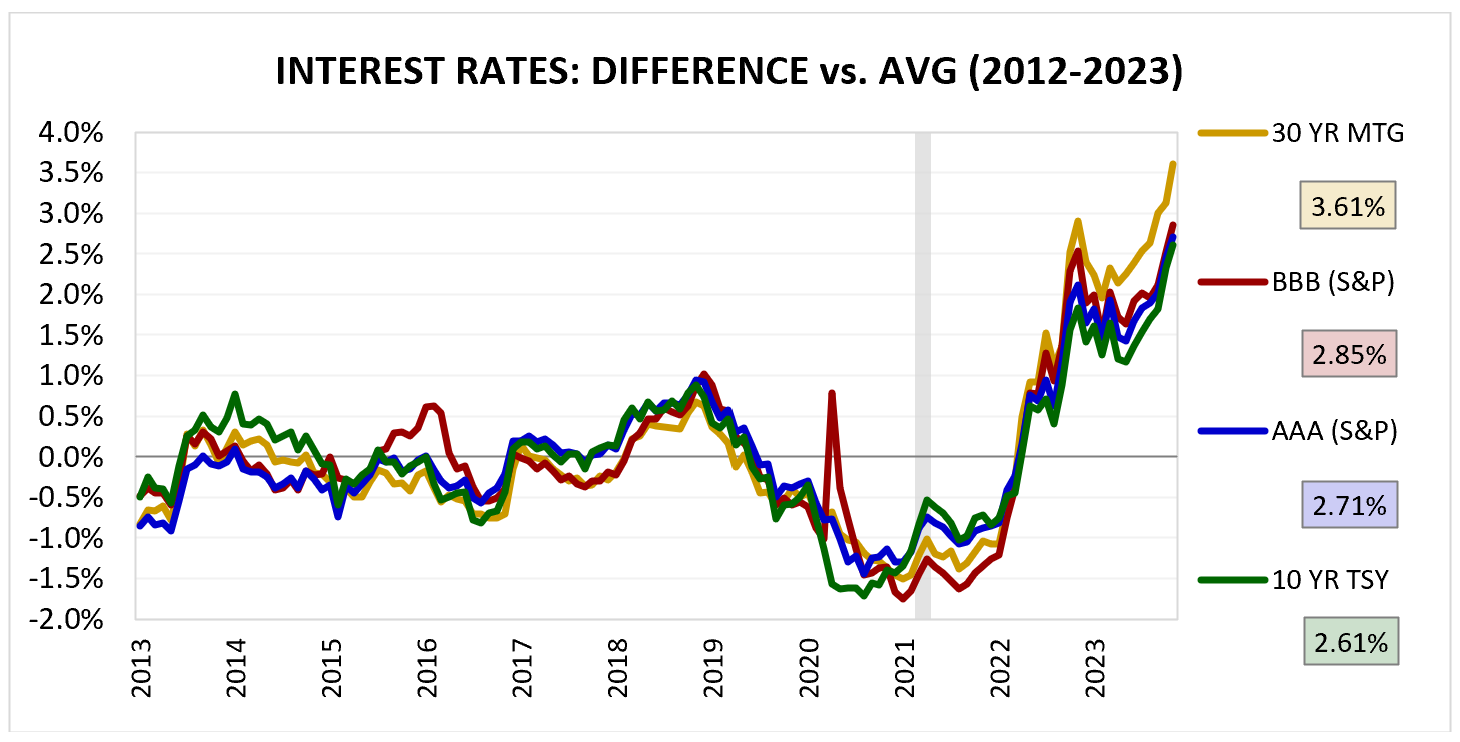
As of the end of October, the BBB (S&P) corporate yield and AAA (S&P) corporate yields were 2.85% and 2.71% above their averages for the period, respectively. If we assume that existing corporate debt, on average, was taken out at interest rates near the average levels for the period, we can infer that the change in the rate paid upon refinancing will mirror those two numbers. To be conservative, we’re going to round them up to 3% and use that single number as the assumed interest rate increase that the index will incur upon refinancing. Of course, not every company in the index will experience that increase—those whose financial conditions have deteriorated will see a higher increase, and those whose financial conditions have improved a lower one. But, on average, for the index as a whole, the number should suffice, particularly as a conservative assumption used for the purposes of placing an upper bound on the impact.
Running the calculation using a 3% increase in the rate paid, we get the following result:
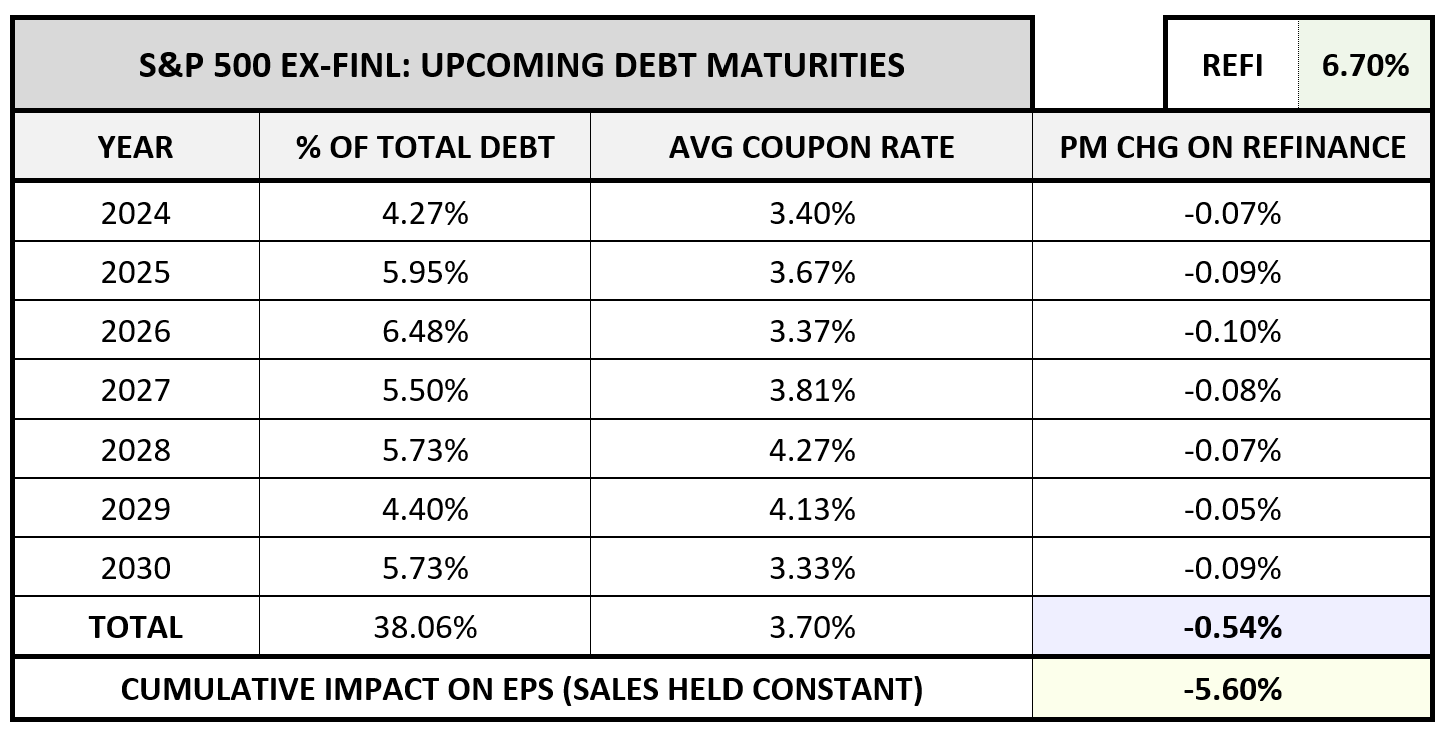
Over the next 7 years, from 2024 through 2030, the calculated cumulative profit margin decline comes out to 0.54%. Relative to the current profit margin level of 9.64%, this decline translates into a percentage decline of 5.60%, and by extension, a 5.60% decline in earnings and earnings per share (EPS), assuming that all other relevant variables—sales, share counts, etc.—stay constant through the period. Of course, those other variables are not going to stay constant through the period; they’re going to change as the S&P 500 grows and delivers returns to shareholders. But the point is, they aren’t going to change directly because of the interest rate increase, and therefore we can accurately describe the interest rate increase’s effect on earnings and EPS as being equal to the effect on the profit margin—a 5.60% decline.
Importantly, this 5.60% decline is not the decline that will occur in one year, nor is it the decline that will occur per year over the period. Rather, it’s the cumulative decline that will occur over the course of all 7 years, from today through the end of 2030. On an annualized basis, it only amounts to a drag of around 0.82% per year—enough to tangibly reduce the index’s returns relative to its historical average, but not enough to shatter the index’s overall performance.
Now, for the above calculation, we used a 6.70% nominal refinancing rate. We used that rate because it’s roughly 3% higher than the average 3.70% coupon rate currently paid on the debt that’s set to mature, a number that conservatively matches the general increase in long-term interest rates that has taken place relative to recent averages. However, for all we know, that number could be too generous, particularly if long-term interest rates continue to rise.
To quantify the potential impact of interest rate increases that are larger than our current 3% assumption, the chart below shows the expected total EPS reduction (“drag”) from 2024 to 2030, in annualized terms, for assumed increases all the way up to 10%:
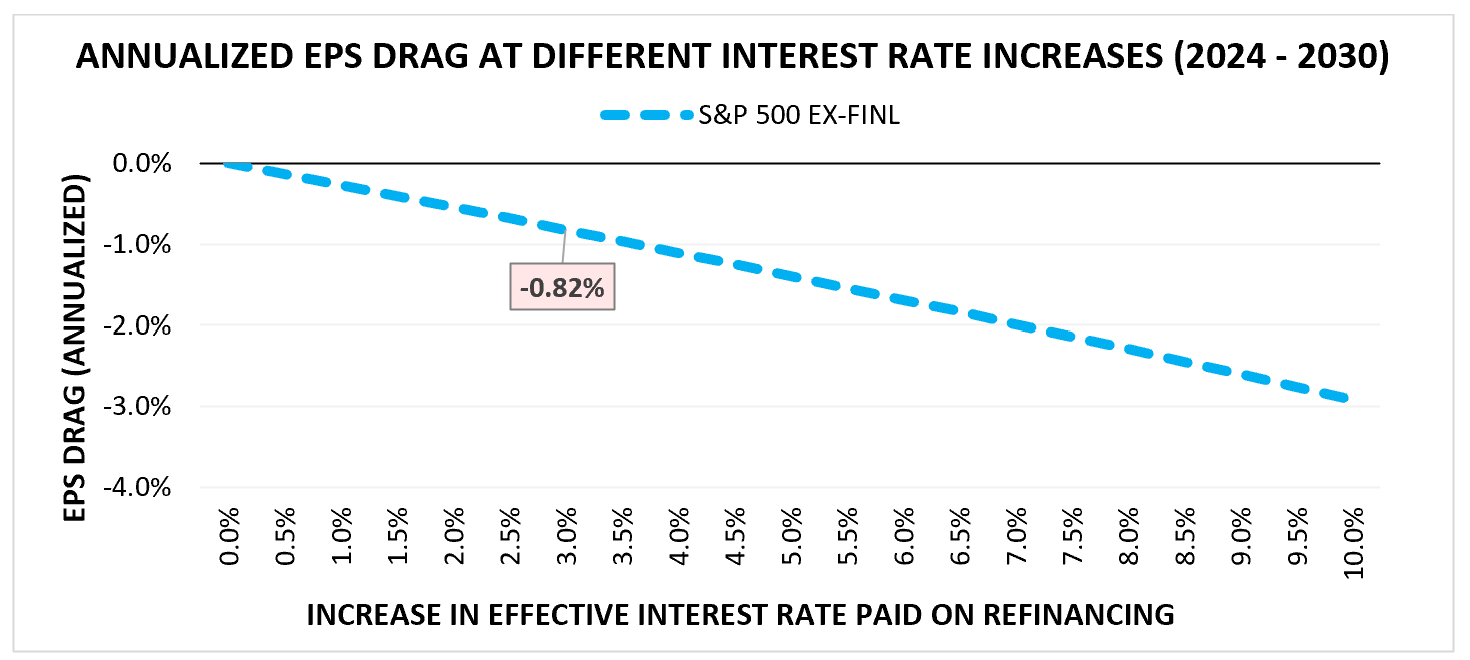
Assuming a 10% increase in the interest rate paid on debt maturing between 2024 and 2030, the estimated EPS drag over the period would come out to -2.92% per year.7
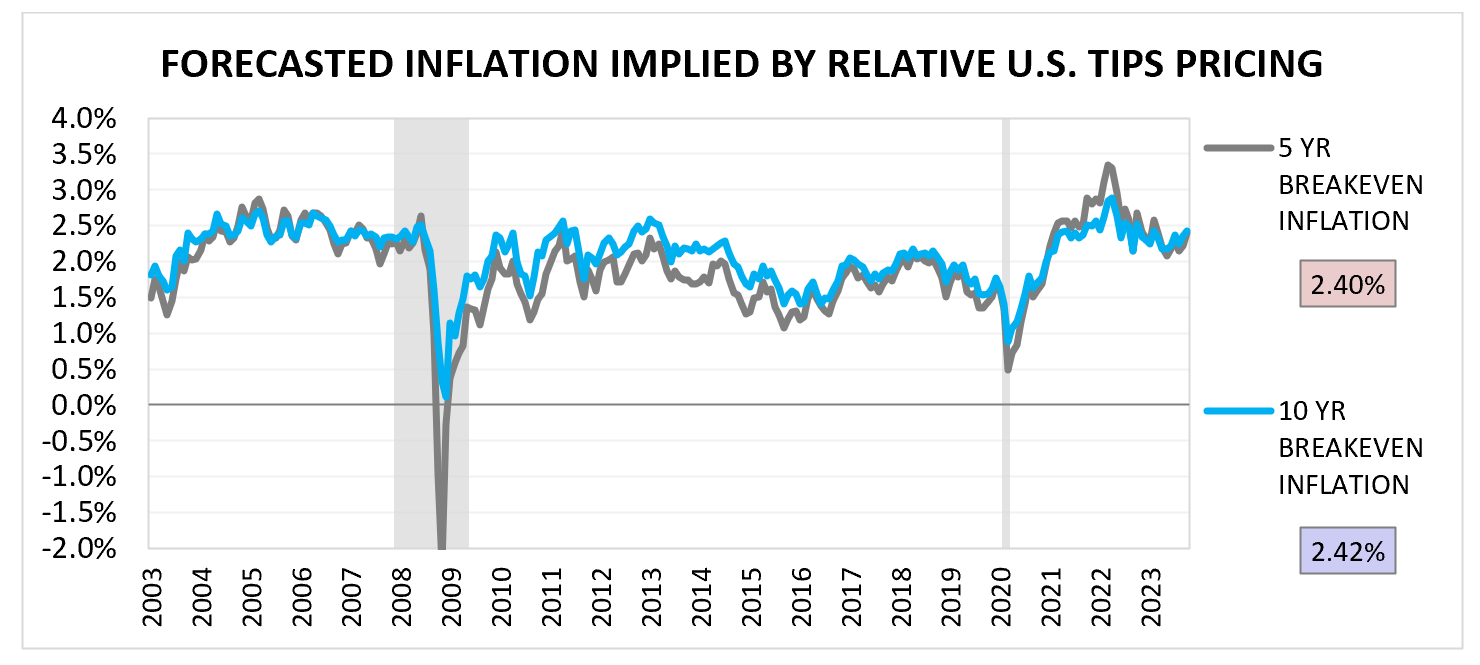
Addressing a Missing Variable: Inflation
An important variable that we haven’t yet considered in the analysis is inflation. Over the coming years, inflation is expected to run slightly hot, around 0.4% to 0.6% above its average from the GFC through the pre-Covid period.
The extra inflation will likely raise the nominal sales of corporations, but the boost that it gives to profit margins and earnings will be limited by corresponding increases in nominal costs—presumably, all costs except interest.8 Interest is special because it’s paid at a rate that we’ve already defined, and that’s tied to a quantity of nominal debt that does not directly increase in nominal terms as a result of inflation (in contrast to inflation-linked debt, which does increase).
If we assume that the unit prices that companies receive and the expenses that they pay out will both rise in proportion to the broader inflation that will be occurring, then the only portion of the “extra” inflationary sales growth that we can reasonably expect them to capture as profit is the portion that reflects the profit margin before interest—currently, 11.28% of sales (equal to a 9.64% current profit margin plus interest expense of 1.64% of sales). Again, interest is special in that respect and must be treated differently because it is the only species of corporate expense that is not tethered to inflation The cost of goods, the cost of SGA, the cost of R&D, the true amount of depreciation loss, and taxes all get boosted as expenses by inflation—only interest is immune, because we’ve already agreed on the rate, without yet knowing what inflation will be.
Applying that 11.28% margin to “extra” annual growth worth 0.6% of sales, we arrive at an annualized inflation-related increase in earnings worth 0.07% of overall sales—in other words, a 0.07% increase in the profit margin (= 11.28% * 0.6% of sales, the annual “extra” added by inflation). Relative to the current profit margin value of 9.64%, this 0.07% increase represents growth of 0.73% (= 0.07% / 9.64%), which is growth that will translate into earnings.
What we find, then, is that the annual earnings boost from the projected increase in inflation, 0.73%, is almost enough to offset the annual drag of the higher interest expense associated with refinancing, 0.82%. It seems, then, that there’s no net effect to worry about—presumably, what we’ll be losing from higher interest expense, we’ll be (mostly) gaining back from higher inflation.
The problem with this way of thinking, of course, is that the extra earnings growth from inflation is supposed to be offsetting the loss that inflation represents, a real loss in our wealth and purchasing power as investors. Thinking in terms of real returns, we’re not breaking even when we’re forced to “treat” inflationary growth (or conceptualize it) as compensation for our increased interest costs. It’s already supposed to be compensation for inflation itself, which is a real loss to us.
In this overall process, we’re losing 0.82% annually to extra interest via the drag on our earnings stream. We’re then gaining 0.73% back from an inflation-related boost to that stream. But amid that boost, we’re also losing 0.6% to inflation. On a net basis, then, we’re still in the red—we’re losing 0.69% annually in real value (=0.73% - 0.82% - 0.6%) relative to what we would be losing if inflation and interest expenses were permanently fixed at their pre-Covid levels.
Now, for those who were expecting “big” effects from the interest rate increase, the 0.82% annual drag implied by the current refinancing situation (or, alternatively, the 0.69% real annual drag net of the additional earnings growth associated with higher expected future inflation) may seem low—and it is low, relative to the kind of drag that other return factors, in particular multiple contraction, could end up generating in the near term. But it’s certainly not nothing. The average real return for the S&P 500 over its full history is around 6%. A 0.69% real drag is roughly 10% of that return. When added to additional potential sources of drag that the S&P 500 is already exposed to, it’s a sound reason to at least consider increasing one’s allocation to alternatives, which can now be found throughout the fixed income space, given the rise in interest rates.
The main reason why the effect is low is that S&P 500 companies as a whole have done a reasonably good job of terming out their maturities. But there’s an additional reason: when calculating potential impacts on earnings, we have to compare the projected increase in interest expense to the current level of earnings. Right now, the current level of earnings is quite elevated on a relative basis, with profit margins near record highs. If the same increase in interest expense had been introduced into the equity market of 1982, when earnings were depressed on a relative basis, or at least less elevated than they are now, the projected decline in earnings, as a percentage of earnings, would have been much larger. Losing a cumulative 0.54% of your sales to increased interest will cause a much greater decline in earnings when earnings are 4.74% of sales (as they were in 1982) than when they are 9.64% of sales (as they are now).
If you happen to believe, then, that profit margins are set to fall for reasons unrelated to interest expense, then the dynamic that we’ve spelled out will translate into a more significant earnings impact, because the same interest increase will be cutting into a smaller earnings number.
Sector Impacts Within the S&P 500: Real Estate as an Outlier
The factors that have helped limit the projected interest-driven earnings drag on the S&P 500 index are not applicable to all sectors within it. The real estate sector, in particular, is sitting in a very different situation with respect to its maturity schedule and its debt load.
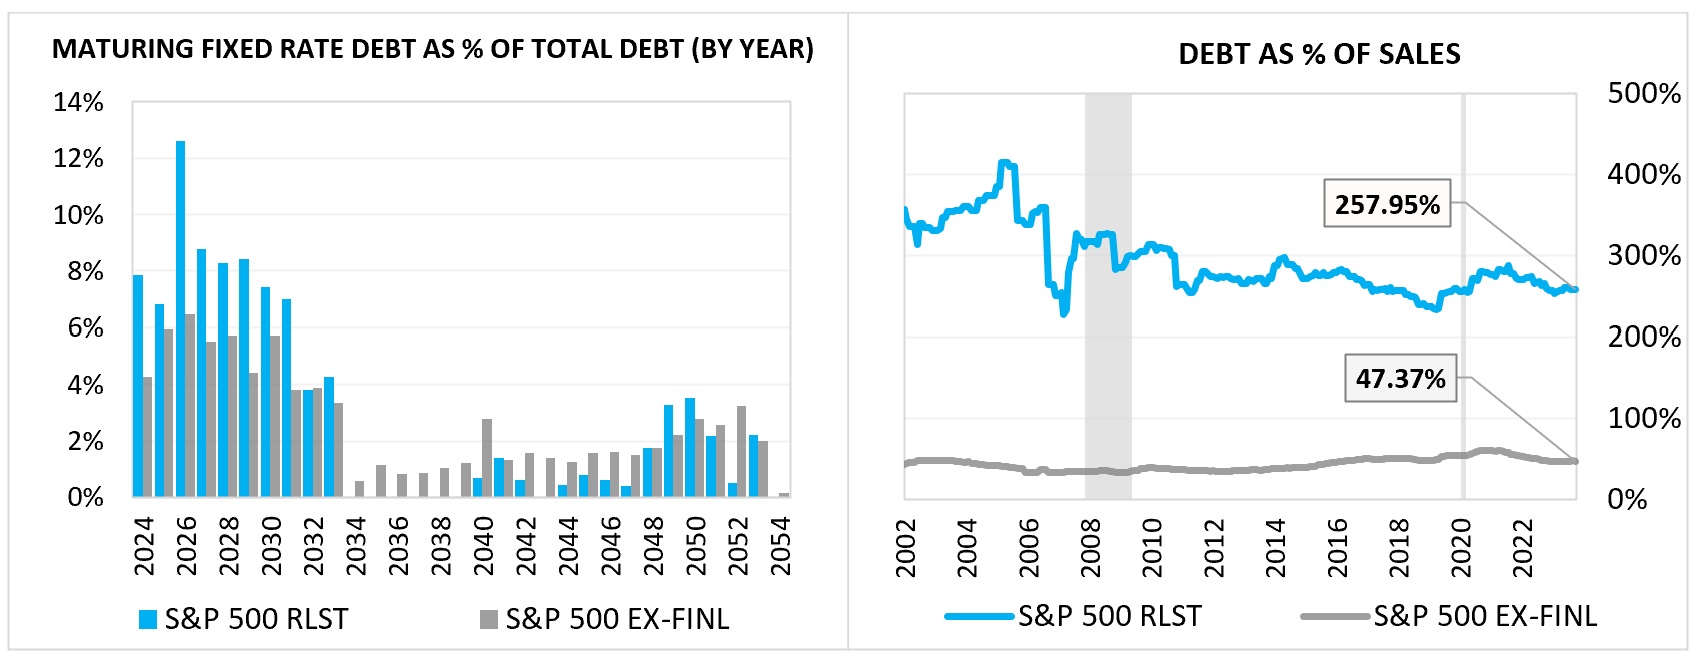
As you can see above, it’s carrying debt that has a much shorter maturity profile than the overall index, with more than 60% of its existing stock of debt scheduled to reach maturity by 2030.9 It’s also a heavily indebted sector, first because it operates on hard assets that can be leveraged (and that often need to be leveraged to deliver acceptable returns), and second because many of its companies are REITs that are legally unable to retain and reinvest the majority of their profits, and that therefore have to rely on external funding, including debt funding, to grow. For these reasons, a given change in the effective interest rates that it has to pay on its debt will tend to translate into a much greater decline in its earnings.
These considerations are partially offset by the fact that the real estate sector has a higher profit margin than the broad S&P 500, and therefore the same increase in its interest expense as a percentage of its sales will drive a smaller relative reduction in its profit margin and its EPS.
Still, the overall near-term sensitivity of the real estate sector’s EPS to impending refinancing at market interest rates is substantially higher than for the broad index.
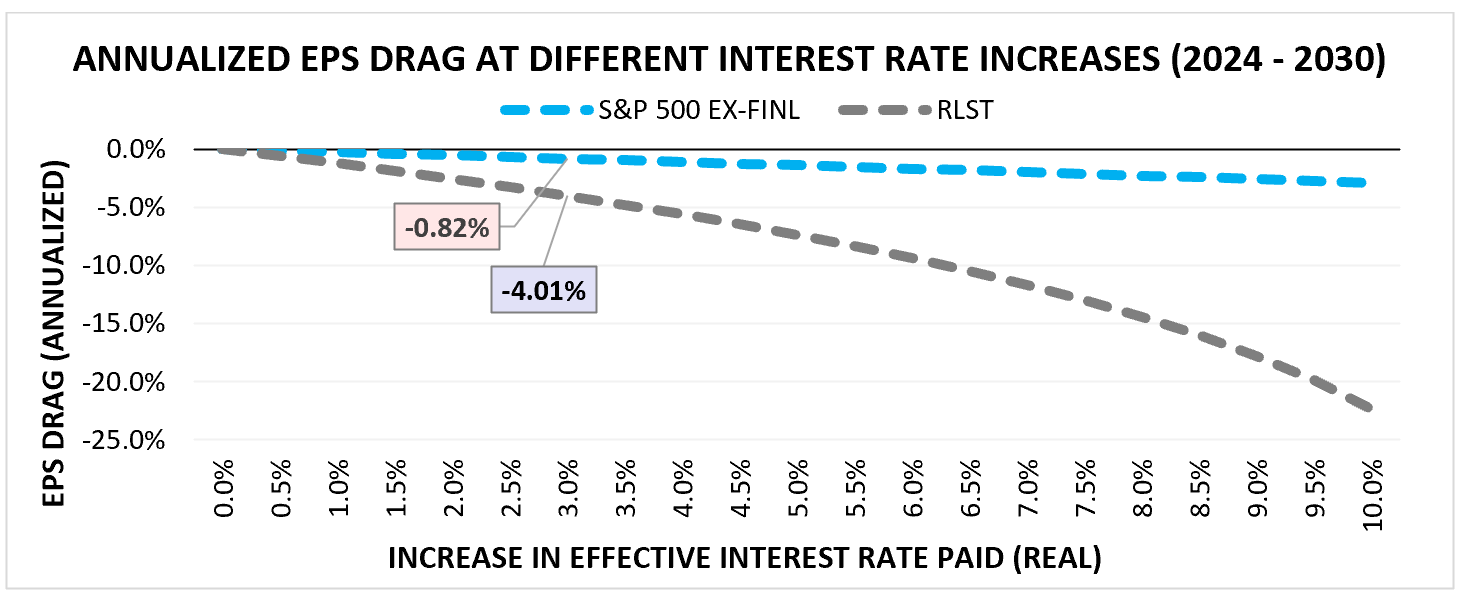
As you can see, the sensitivity is quite high. An assumed 3% increase in the interest rate paid on maturing debt over the next 7 years will translate into a 4.01% annualized decline in EPS (relative to a counterfactual in which the interest rate paid on that debt stays constant at the original rate).
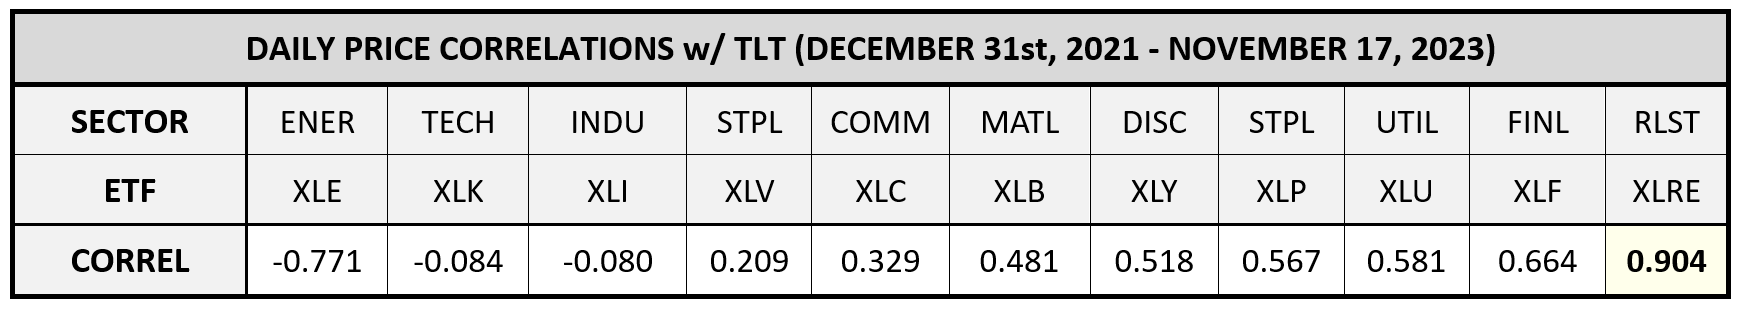
This sensitivity can help us make sense of recent price action in the real estate sector. Using the SPDR Select Real Estate ETF XLRE as a proxy, we see that there’s a very strong correlation between the price of that ETF and the price of the iShares long-term treasury ETF, TLT.
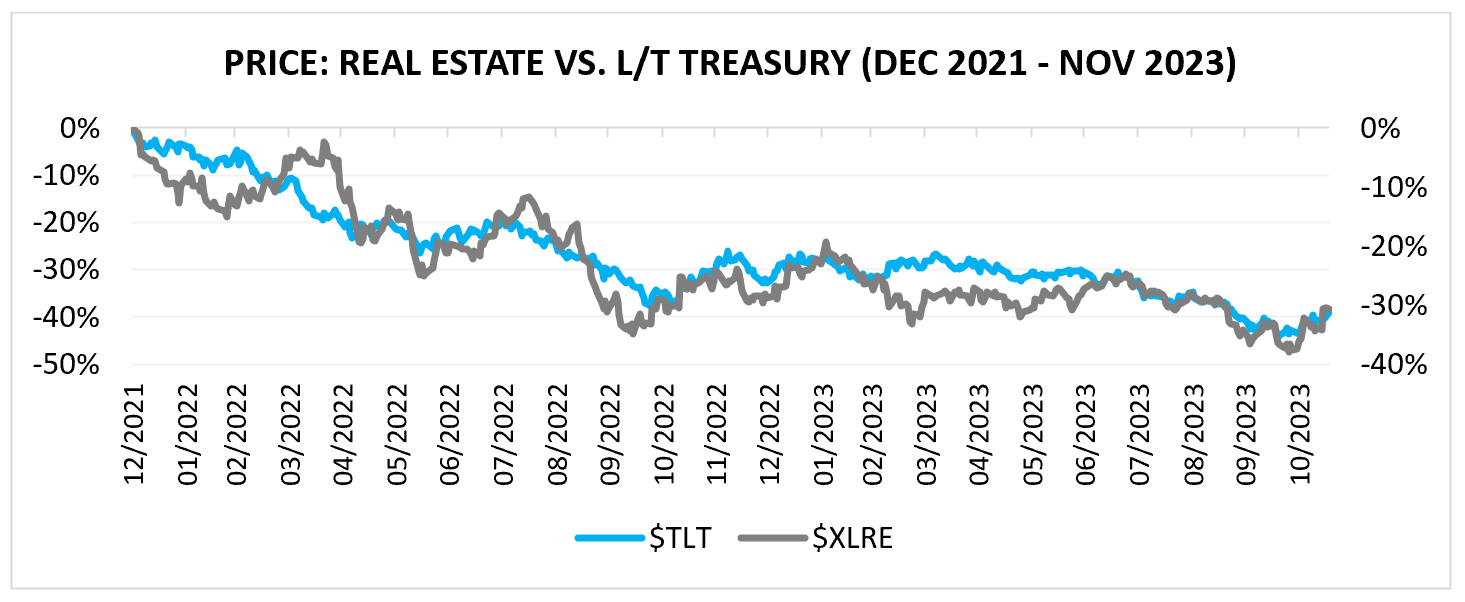
At over 90%, the real estate ETF has the highest correlation with TLT of any SPDR sector ETF.
Investors sometimes wrongly conclude that this strong correlation is attributable to the fact that real estate companies pay out high dividend yields and therefore function as “bond proxies” in the market, rising with the bond market as yields fall and falling with the bond market as yields rise. But this conclusion is misguided. Analytically, the fact that real estate assets have a lot of present cash flow from which they can pay out yields reduces their duration and therefore makes their prices less sensitive to interest rate increases, not more.
To explain using an example, if expected future real interest rates on fixed income securities rise by 2%, market efficiency would suggest that equity prices should fall by an amount that will make implied future equity returns also rise by 2%, so that they can remain competitive. Importantly, the price of an asset like a real estate structure, which has a greater portion of its future cash flow stream set to be delivered in the near-term, won’t have to fall by as much to deliver that additional return as the price of, say, a profitless growth stock—an idea in someone’s basement—that isn’t going to produce cash flows for several decades. This is just the basic logic of discounting—in an efficient market, everything has to offer the same risk-adjusted return, and returns are ultimately just future cash flows discounted in price back to the present. The greater the time it will take to receive those future cash flows, the greater the discount will need to be, in order to generate the same annualized return from buying and holding them over the period.
In truth, the reason why the performance of the real estate sector is highly correlated with the performance of bonds is that the real estate sector is heavily indebted. It’s a sector that aggressively uses debt to generate returns, which makes its net earnings and cash flows highly sensitive to the cost of debt, as the calculations above confirm.
For an illustration of how other sectors might fare in the coming years, the chart below shows the projected EPS drags for all GICS sectors (with the exception of financials) assuming a 3% increase in the interest rates paid on existing debt.
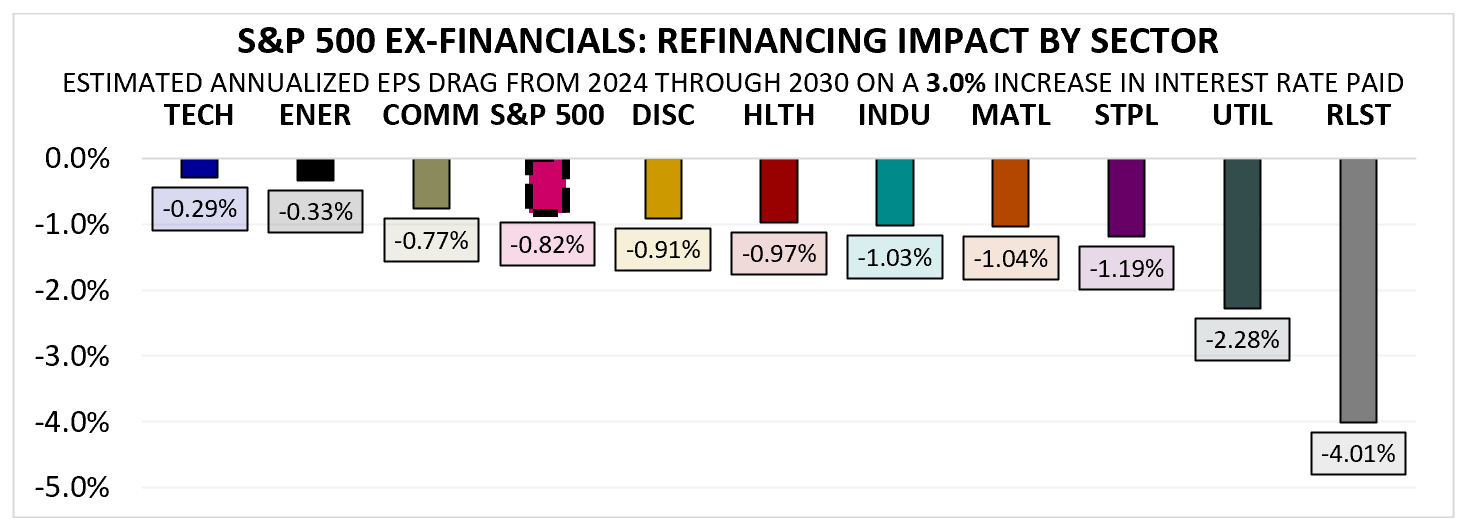
The EPS of the technology sector is relatively insensitive to the effects of the interest rate increases that have occurred because its debt has been termed out into the distant future, with only 31% of the existing stock set to mature in the next 7 years. More importantly, it’s currently operating at very high profit levels relative to other aggregates, which reduces the percentage impact of a given increase in interest expense on its EPS. The EPS of the energy sector will also likely remain relatively insensitive to the effects of the interest rate increases because it’s carrying a much smaller debt load than the market, equal to 23% of sales versus 47% for the broad market.
The two sectors whose earnings will likely be most sensitive to impending increases in interest rates paid are utilities and real estate. In both cases the main culprit is a high debt load. It’s not a coincidence that these two sectors have been among the worst performing sectors in the market since interest rates began to rise.
The Impact of the Financial Sector
We’ve excluded financials (FINL) from our analysis up to this point because they receive interest from the economy in addition to paying it out. An increase in interest rates could therefore boost their earnings just as easily as it might reduce those earnings—the direction of the impact depends on the structure of their balance sheets.
Unfortunately, the financial sector as a whole did not enter the current period with an aggregate balance sheet structure that was well-prepared for the elevated interest rate environment that has ensued.10 The result has been significant underperformance for the sector, with the early part of the year characterized by a number of high-profile bank failures.
The table below quantifies the effect that including financials in the analysis has on the index, assuming that we strictly limit the scope of their impact to debt maturities. In other words, we raise their debt costs by 3% upon maturity and change nothing with respect to their income:
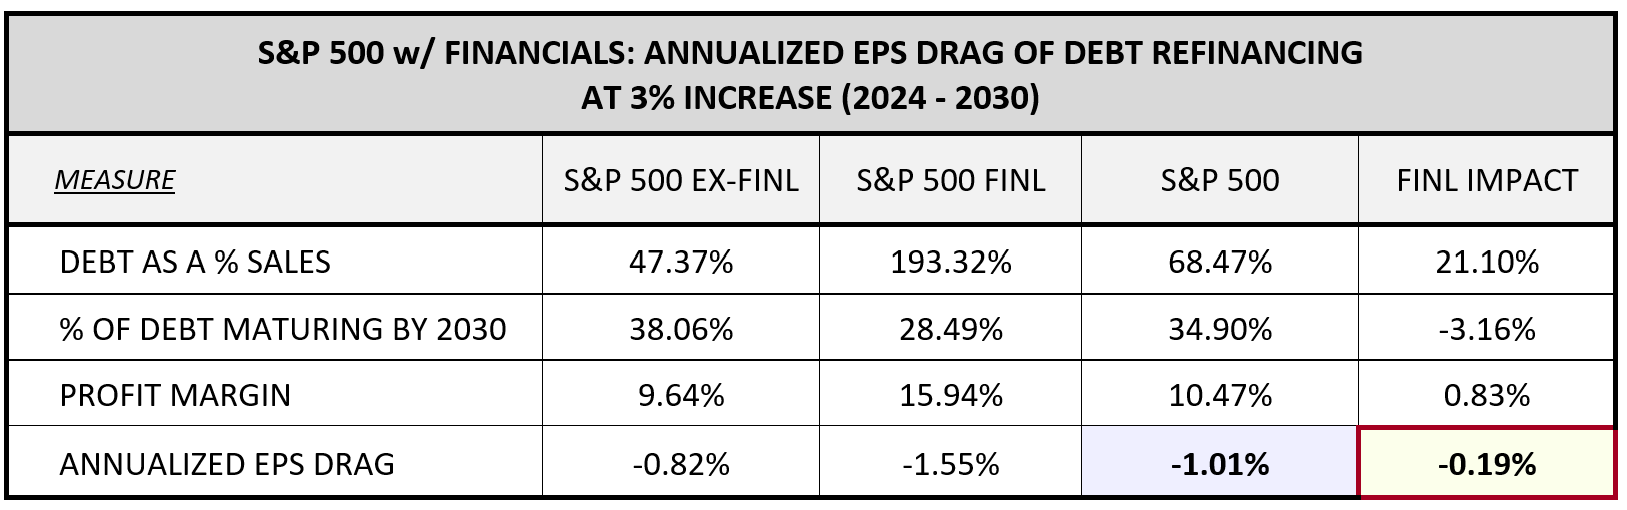
As you can see, the financial sector has significantly more debt relative to its sales than the rest of the market. But a smaller share of that debt will be maturing in the next 7 years. Additionally, the sector has a higher profit margin, so the same increase in its interest expense as a percentage of its sales will generate less change in its EPS.
Out of these three competing factors, the debt size is the most impactful. As a result of its effects, the sector comes out experiencing an annualized EPS drag of 1.55% per year in the analysis, which reduces overall S&P 500 EPS by 0.19% per year (from a 0.82% drag with financials excluded to a 1.01% drag with financials included).
The important caveat that we need to emphasize here is that the above analysis does not include the higher income that financials can expect to receive on the other side of the process, as the low-yield debt securities that they’re holding as assets mature and get reinvested at higher rates. Unlike other sectors, they are on both sides of the maturity equation—they’ve borrowed money from the market that they will have to pay higher rates on as maturities arrive, but the market has also borrowed money from them that it will have to pay them higher rates on as maturities arrive.
Banks as a Wildcard
Banks differ from other segments of the financial sector in that their exposure to interest rate risk comes not only from the debt securities that they have to refinance, but also from the deposits that they issue and hold. Those deposits are unique in that the cost of keeping them varies under different conditions and is not always responsive to changes in interest rates. Quantifying the impact that rising rates will have on that cost is therefore challenging. In contrast to other liabilities, there is no defined maturity schedule or market interest rate that the analysis can use as an input. The outcome is instead determined by the behaviors of bank customers, who have a rational incentive to seek out the better available returns on their cash balances, but who often fail to respond to that incentive.
To conservatively estimate the impact that a prolonged period of time with short-term interest rates at their current levels (federal funds rate at 5.25% - 5.50%) might have on deposit rates and bank earnings, one option is to simply look back at prior periods in which short-term interest rates were at or around those levels, to see what kinds of deposit rates banks had to pay during those periods.
To be fair, there are structural reasons why we might expect current deposit rates to be more resistant to increases now than they were in past periods—in particular, the fact that quantitative easing has saturated the financial system with an extremely large quantity of reserves and associated deposits, reducing the extent to which financially-sound banks have to compete for deposits.
But even then, there’s a powerful incentive in place to drive competition for better rates. With only a few clicks, any customer holding a low-yield cash balance at a bank can take that balance out of the bank and put it into a money market fund, which will then take the balance and deposit it into the Fed’s reverse repo facility, effectively removing it from the banking system. We can presume that human factors—e.g., the natural inertia of needing to focus on other things in life, the friction and hassle associated with having to set it all up, or even a lack of awareness that the option exists—will limit the extent to which bank customers will choose that option. But the fact that they have a strong financial incentive to choose it is reason enough to consider the potential impacts that their choosing it might have.
To help us estimate the potential impacts of a rise in deposit rates, the table below provides information on the aggregate deposit liability structures of the 9 largest banks in the S&P 500:
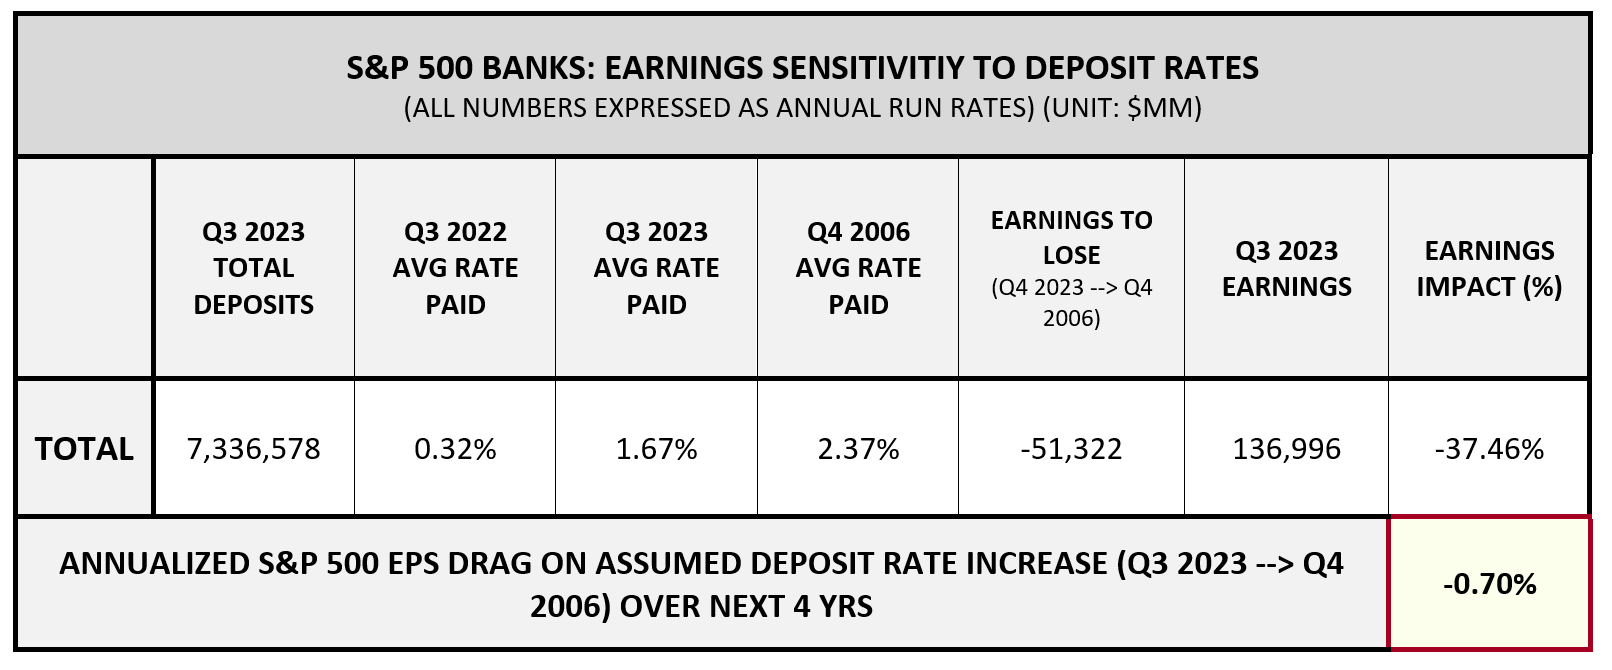
The second column from the left shows the total dollar amount of domestic deposit liabilities for each bank (to include both interest-bearing and non-interest bearing deposits). The third, fourth, and fifth columns from the left show the average annual interest rates paid on those deposits in the third quarter of 2022 (last year), the third quarter of 2023 (this year), and the fourth quarter of 2006.
The fourth quarter of 2006 is a useful comparative data point because the federal funds rate in that quarter was roughly the same as it is in the current quarter—the target was 5.25% then and now sits in a range from 5.25% to 5.50%. It had also been elevated for a substantial period of time, having risen above 4% a year earlier. If we want a semi-conservative estimate of where we can expect deposit rates to go, assuming that policy rates stay at their elevated current levels indefinitely, that quarter and general period would seem to be a reasonable reference point that we can use.
Returning to the table, the sixth column from the left shows the quantity of earnings that banks would lose to increased interest expense if their deposit rates were to rise from current levels to the levels of the fourth quarter of 2006. The seventh and eighth columns show what earnings were for the third quarter of 2023 and what the impact of the lost earnings would be in percentage terms.
As you can see in the table, there are roughly $7.34 trillion worth of deposits in the system. In September of last year, those deposits were paying a rate of 0.32%. As of September of this year, they are paying 1.67%—a rather sharp increase that has obviously been fueled by the Fed’s rate hikes, which have created high-yield alternatives that banks now have to compete with. If deposit rates continue down their current path and reach the levels of the fourth quarter of 2006, banks will be paying 2.37%. The difference there, on a transition from Q3 2023 rates to Q4 2006 rates, is worth 37.46% of current bank earnings, meaning that 37.46% of those earnings would be lost in the transition. Translating this earnings impact to the broader index, if we annualized it over the next four years, would introduce a drag roughly equal to -0.70% per year, on top of the 1.01% drag that the index is set to experience over the next 7 years as a result of debt maturities.
To again be fair to the banking sector, there are counterbalancing considerations that will offset some of this drag. Banks are currently holding a substantial quantity of low-yielding long-duration assets that they purchased during the periods that preceded and followed the pandemic. Over the next several years, a portion of those assets will mature, allowing the proceeds to be reinvested at higher yields, which will offset some of the drag associated with higher deposit rates. But the fact remains that most of those assets are long-duration assets with maturities that extend out beyond ten years. If rates are going to stay where they currently are, and if upward pressure on deposit rates is going to persist, the banking sector could continue to face a challenging earnings environment.
It’s important to note that in sharing these results for the financial sector and for banks in particular, we’re not saying that they should be excluded from U.S. equity portfolios. The attractiveness of any investment is determined by its price, and after substantially underperforming the broad market over the last year, they may already be at a price that sufficiently reflects these considerations. Additionally, interest rates may not stay where they are—they may soon get cut. If they do, all these considerations will then apply in reverse.
US SMID: More Debt, Nearer to Maturity, Lower Profit Margins, Higher EPS Sensitivity to Refinancing
The U.S. Small and Mid-Cap Index (US SMID) is an index that we’ve created to track small and medium-sized publicly-traded companies in the U.S. market—basically, all stocks listed on official U.S. exchanges that are not in the S&P 500. With financials removed, the index currently consists of 1,582 stocks at an average market cap of $3.21B, in comparison with 427 stocks at an average market cap of $77.63B for the S&P 500.
As an index, the EPS of US SMID is significantly more sensitive to interest rate increases, owing to the fact that it has more debt, that its debt is closer to maturity, and that its current profits are lower relative to other aggregates, which means that a given change in its interest expense will induce a larger percentage decline in its profit.
The chart below shows debt as a percentage of sales for US SMID and the S&P 500 from December 1972 to September 2023.
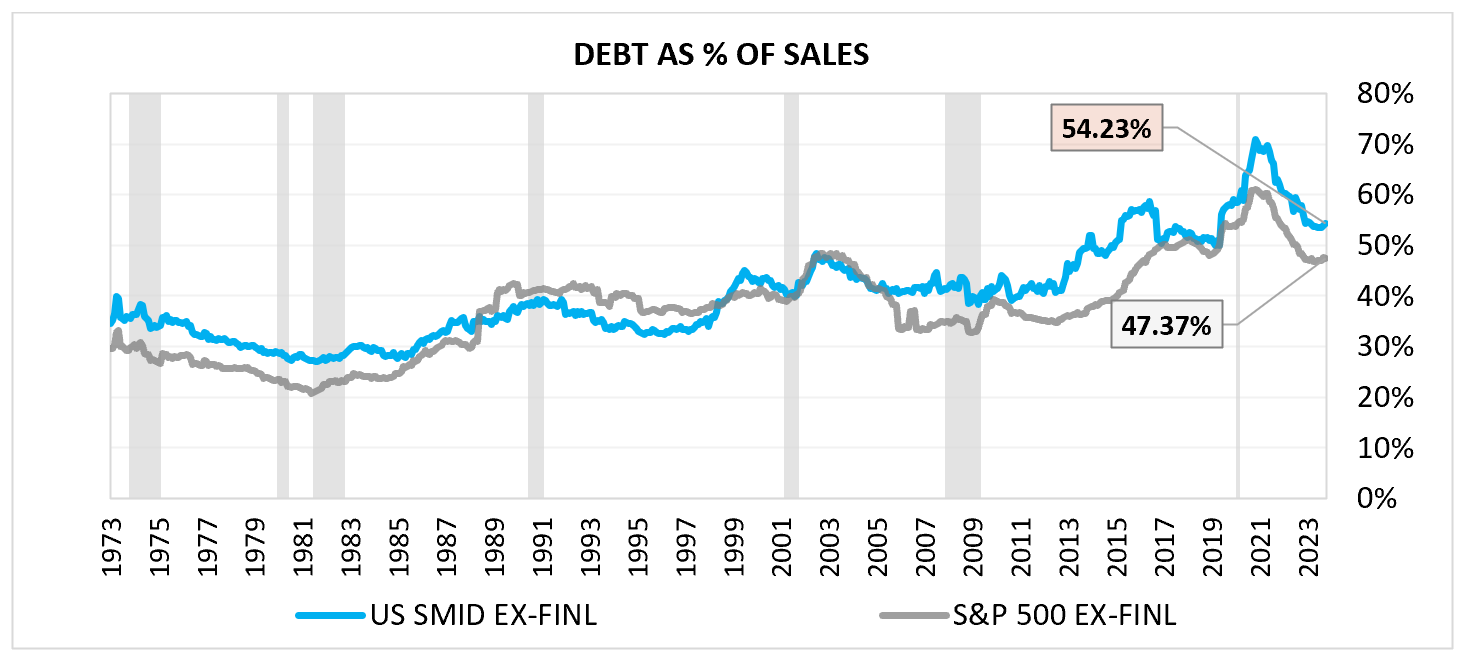
At 54.23% of sales, US SMID’s current debt level is moderately higher than the S&P 500’s debt level of 47.37% of sales. The difference, however, is not enough to make a huge difference to the overall sensitivity.
A more impactful source of difference can be found in the maturity schedules of the two indexes, which are shown below on a per year (left) basis and cumulative (right) basis.
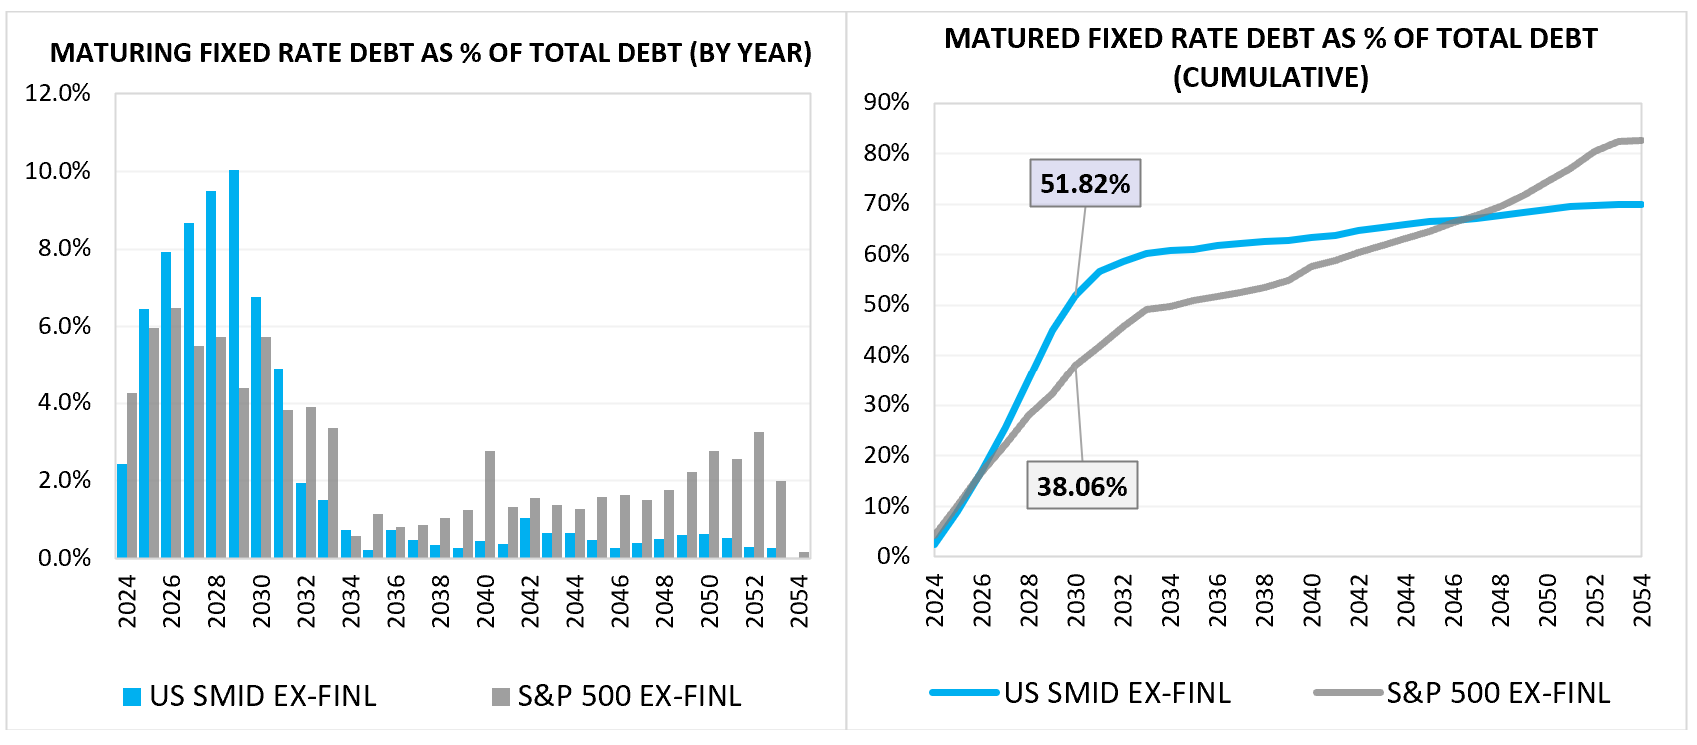
By 2030, roughly 51.82% of existing US SMID debt will have matured, compared to only 38.06% of existing S&P 500 debt.
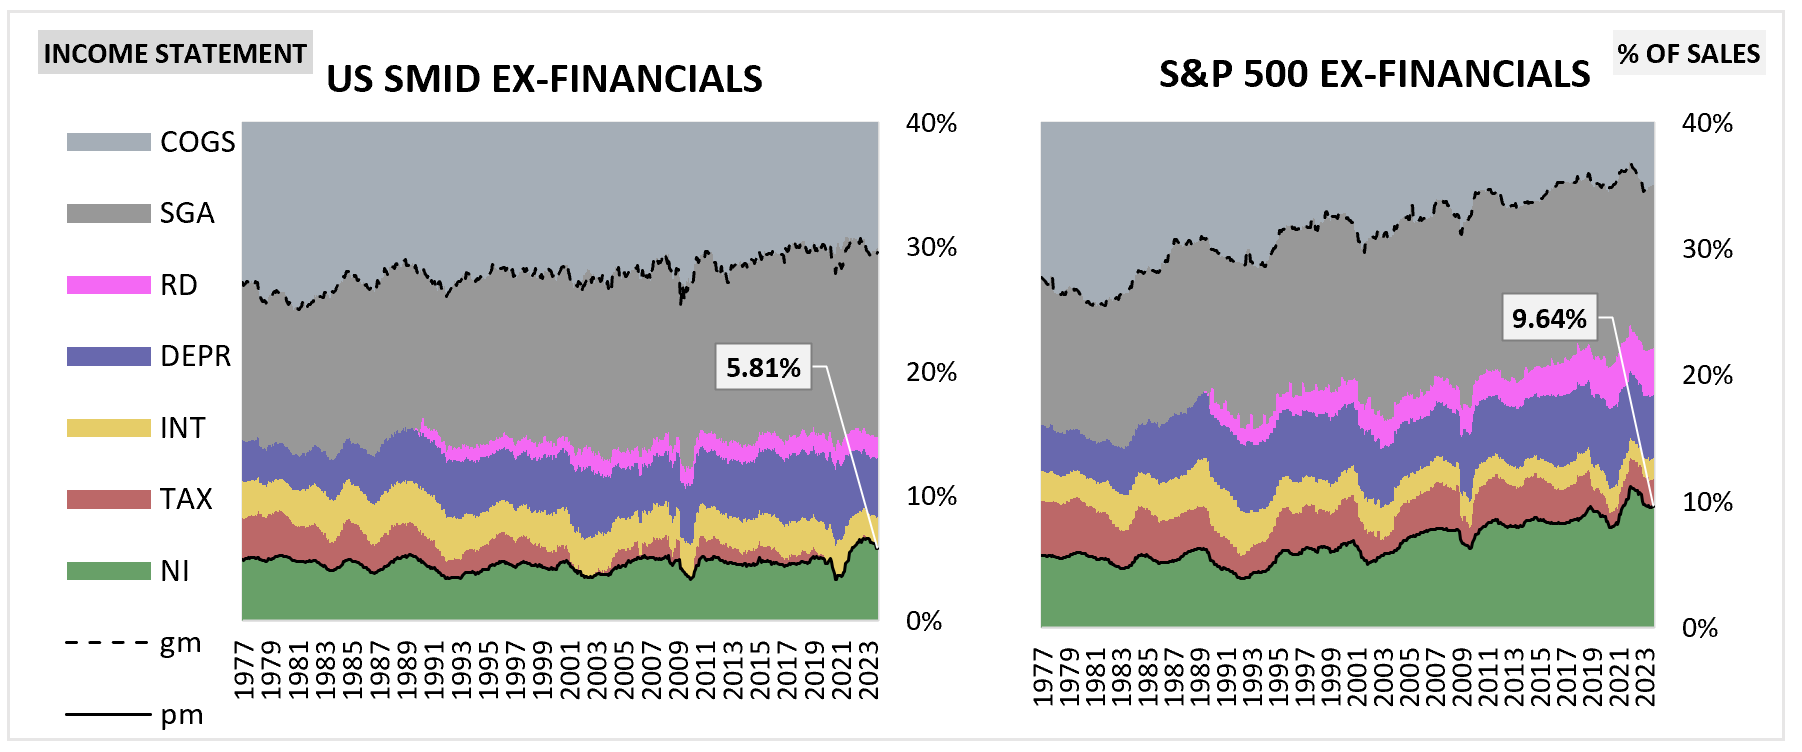
The US SMID index also operates at a significantly lower profit margin than the S&P 500 index. A given increase in its interest expense (as a percentage of its sales) will therefore translate into a larger percentage decline in its profit margin and earnings.
Assuming a 3% increase over the average interest rate paid on the existing debt that will be maturing, we get the following results:
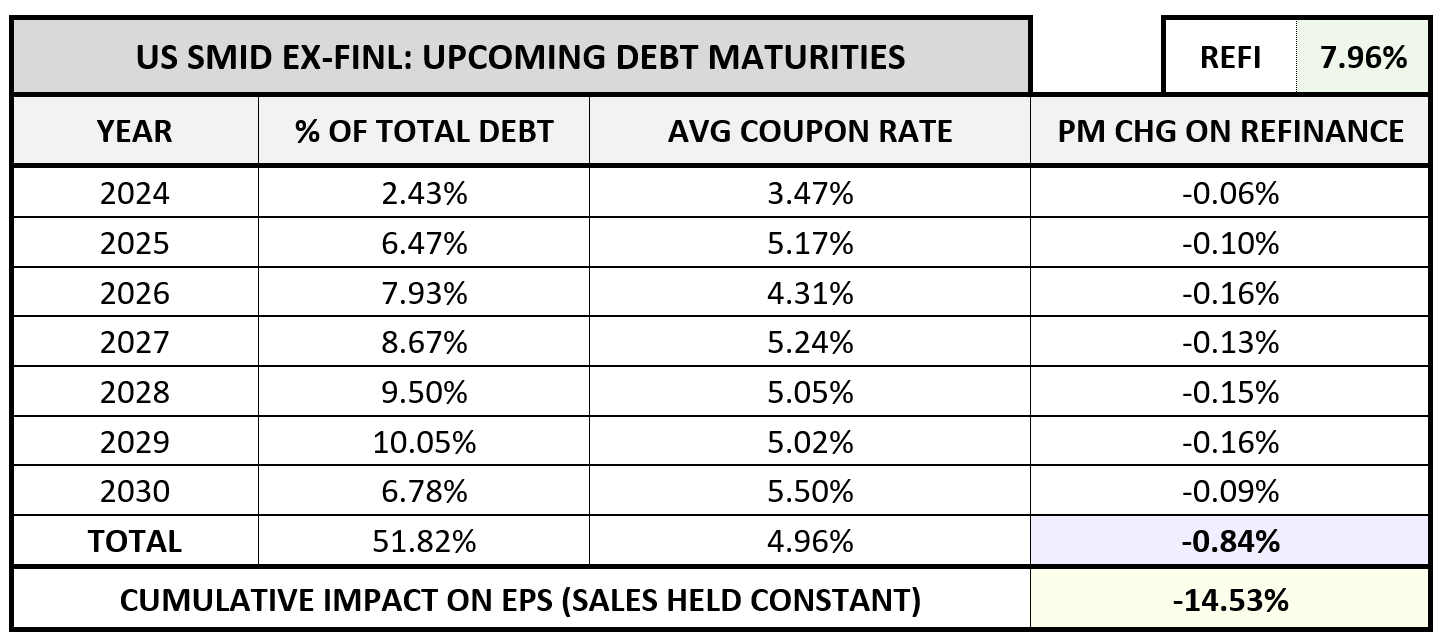
Over the next 7 years, from 2024 through 2030, the calculated cumulative profit margin decline comes out to 0.84%. Relative to the current profit margin level of 5.81%, this decline translates into a percentage decline of 14.53%, and by extension, a 14.53% decline in earnings and earnings per share (EPS), assuming that all other relevant variables—sales, share counts, etc.—stay constant through the period. On an annualized basis, this decline would amount to a drag of around 2.23% per year—significantly more than the 0.82% that we calculated for the S&P 500.
In fairness, our assumption of a 3% increase in the interest rate paid upon refinancing may end up being on the high side, given that US SMID debt already trades at a higher yield than the rest of the market and doesn’t need to see as large of an increase in its yield to remain competitive in higher rate environments. But to counterbalance that point, there’s also credit risk to consider—US SMID debt comes with a greater risk of default than S&P 500 debt. If economic conditions deteriorate, it will need to offer additional yield to compensate for increases in that risk.
The chart below shows the upcoming expected annualized EPS drag associated with refinancing at interest rates ranging from 0% to 10%:
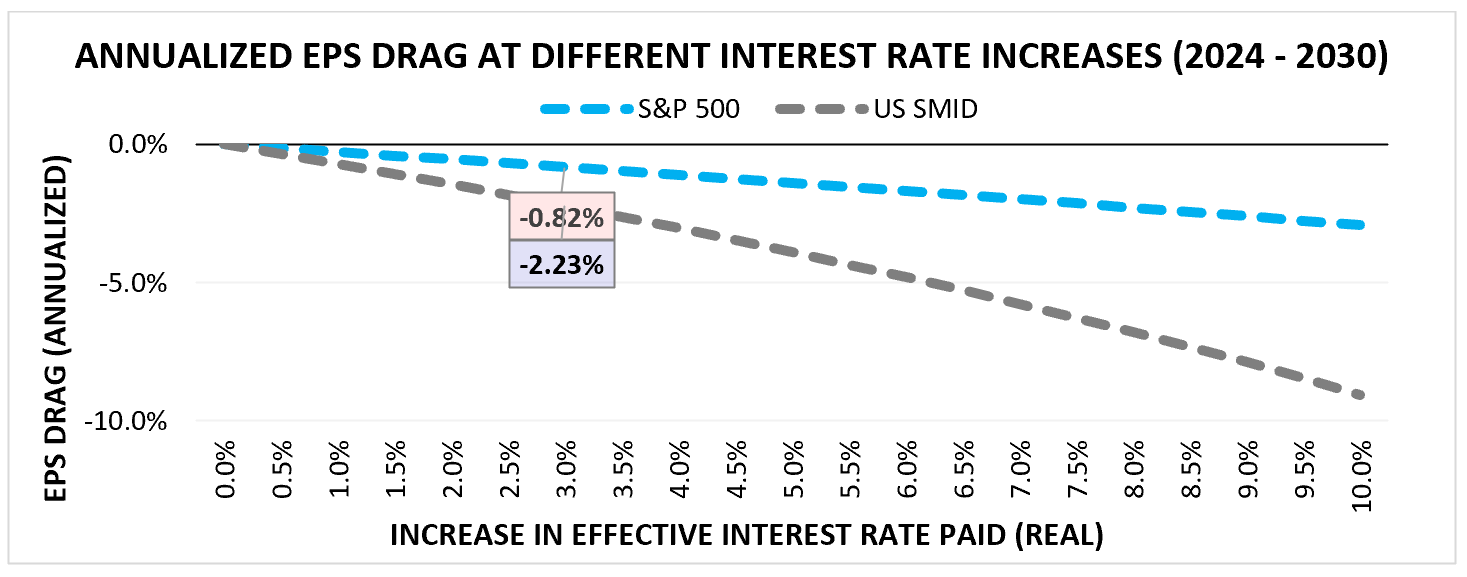
On a 10% increase in the interest rates that US SMID pays on its debt, the annualized EPS drag would be worth 9% per year—a serious problem, no doubt, but one that would pale in comparison to the catastrophe that such a tight monetary condition would inflict on the rest of the economy.
For the sectors within US SMID (ex-financials), the chart below shows the annualized EPS drag that a 3% increase in the interest rate paid would introduce.
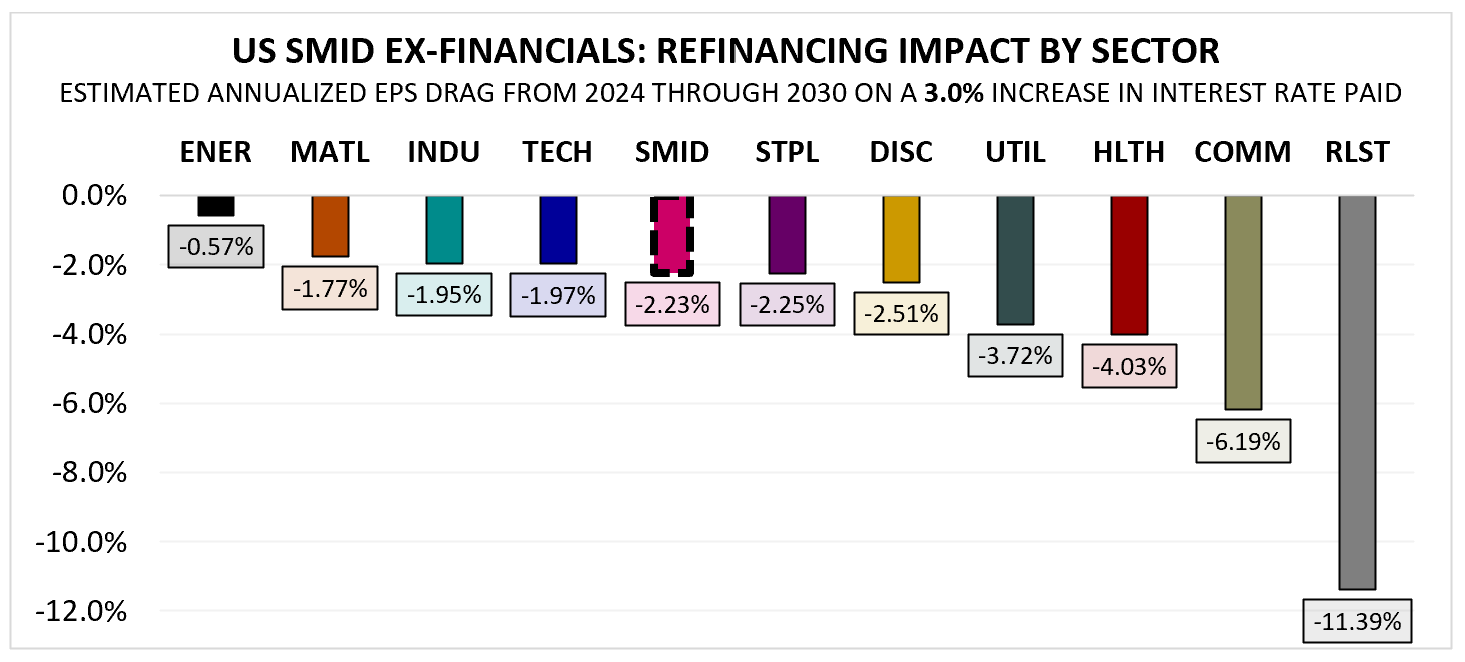
With a few exceptions, the general sectoral picture is similar to what it was for the S&P 500. Energy and technology, for example, are again on the low side with respect to their sensitivity, and utilities and real estate are on the high side. Interestingly, the communication sector shifted from low to high, but that’s only because the communication sector includes very different types of companies at different market caps. At high market caps, it includes companies like Facebook and Google that dominate index results. But at low market caps, it consists instead of more conventional (and heavily indebted) telecommunications names.
Conclusions
While we don’t have a view on the future path of interest rates, our goal was to evaluate the range of potential possibilities given the massive shift in interest rates seen over the last few years. At the outset of the research, we probably would have expected the overall market impact to be higher than we have found. However, once you methodically dive into the structural dynamics of profit margins, the results are intuitive. The impact of refinancings on S&P 500 earnings will likely be small-to-moderate. On a relative basis, the impact on US SMID earnings will be larger. Within both indexes, the impact on the earnings of certain specific sectors could be quite large and may justify recent trends in performance.
FOOTNOTES
1 Unless stated otherwise, the data sources for all numbers cited in the piece are Compustat and S&P Capital IQ.
2 Importantly, our goal is not to endorse this assumption, but simply to explore its potential impact on earnings.
3 We’ve removed financials from the S&P 500 in the chart below and will maintain them removed until the end of the piece because they represent a unique case with respect to the analysis that we’re seeking to conduct.
4 The y-axis scale in the chart below has been converted from raw numbers into the annualized returns that an increase to those numbers would have equated to, if it had occurred over the full timespan of the chart. So when you see the black line, i.e., the total return index, go from 0% to just under 6% from the start date through the March 2000 peak, what’s happening is that the index value is going from a starting value of 1.0 to around 10.0. That change, if it had occurred over the full 489 month period of the chart, would have equated to just under 6% per year, so the y-axis scale shows 6% where 10.0 would have been. The color bars under the black line represent the cumulative contributions that each return source—sales growth, net dilution (or net buybacks, if the share count had contracted), dividends, profit margin expansion, and price-earnings (PE) multiple expansion—made to the annualized return. Collectively, they add up to it.
5 These numbers were generated from earnings measured on a GAAP basis with negative values for individual companies cut off at zero in the index calculation.
6 For reference, the average remaining years to maturity of the fixed rate portion of the total stock of debt for the S&P 500 currently sits at around 11 years.
7 A 10% increase in interest rates would obviously be catastrophic to equity markets and to the financial system more broadly, for reasons that are unrelated to any direct effect on earnings. We’re just highlighting it as a hypothetical to articulate the sensitivity
8 Under GAAP accounting rules, depreciation expenses applied to existing assets will not rise as a result of higher inflation. But as real costs borne by shareholders, those expenses will rise, and their rising will impact returns.
9 To make matters worse, a substantial portion of its debt is mortgage debt, the entirety of which is continually being paid off.
10 In fairness, this outcome may not have been realistically avoidable in the aggregate, since large amounts of low-yield debt existed, and someone, some entity, had to hold that debt through the loss. If banks in the aggregate had not held a meaningful portion of it, who would have held their portion?
O'SHAUGHNESSY ASSET MANAGEMENT, L.L.C. CANVAS® PLATFORM
IMPORTANT DISCLOSURE INFORMATION (revised as of March-2023)
CANVAS® is an interactive web-based investment tool developed by O’Shaughnessy Asset Management, L.L.C. (“OSAM”) that permits an investment professional (generally a registered investment advisor or a sophisticated investor) to select a desired investment strategy for the professional’s client. At all times, the investment professional, and not OSAM, is responsible for determining the initial and ongoing suitability of any investment strategy for the investment professional’s underlying client. The professional’s client shall not rely on OSAM for any such initial or subsequent review or determination. Rather, to the contrary, at all times the professional shall remain exclusively responsible for same. See MORE ABOUT CANVAS below and Release and Hold Harmless at the end of this Important Disclosure Information.
Reliance on Investment Professional: OSAM has relied, and shall continue to rely, on the investment professional’s knowledge and experience to understand the inherent limitations of the performance presentation, including those pertaining to back-tested hypothetical performance. All performance presentations, including hypothetical performance, are the direct result of the investment professional’s request, independent of OSAM. Depending upon the investment professional’s direction and selection, hypothetical presentations can include both OSAM and non-OSAM Models and/or strategies. The below discussion as to the material limitations of back-tested hypotheticals apply to both OSAM and non-OSAM Models and/or strategies.
Intended Recipient: CANVAS content is intended for the investment professional only not to be shared with an underlying client unless in conjunction with a meeting between the investment professional and its client in a one-on-one setting. OSAM assumes that no hypothetical performance-related content will be provided directly to the professional’s client without the accompanying consultation and explanation of the professional. The content is intended to assist the professional in evaluating the appropriate investment strategy for the professional’s client.
OSAM Models: OSAM has devised various investment models (the “Models”) for CANVAS, the objectives of each are described herein. The investment professional is not obligated to consider or utilize any of the Models. As indicated above, at all times, the investment professional, and not OSAM, is responsible for determining the initial and ongoing suitability of any Model for the investment professional’s underlying client. Model performance reflects the reinvestment of dividends and other account earnings and are presented both net of the maximum OSAM’s investment management fee for the selected strategy and gross of an OSAM investment management fee. Please Note: As indicated at Item 5 of its written disclosure Brochure, OSAM’s CANVAS management fee ranges from 0.20% to 1.15%. The average percentage management fee for all CANVAS strategies is 0.29%. The percentage OSAM management fee shall depend upon the type of strategy and the corresponding amount of assets invested in the strategy; generally, the greater the amount of assets, the lower the percentage management fee. Please Also Note: The performance also do not reflect deduction of transaction and/or custodial fees (to the extent applicable), the incurrence of which would further decrease the performance. For example, if reviewing a strategy with a ten-year return of 10.0% each year, the effect of a 0.10% transaction/custodial fee would reduce the reflected cumulative returns from 10.0% to 9.9% on a 1 year basis, 33.1% to 32.7% on a 3 year basis, 61.1% to 60.3% on a 5 year basis and 159.4% to 156.8% on a 10 year basis respectively. Please Further Note: Transaction/custodial fees will differ depending upon the account broker-dealer/custodian utilized. While some broker-dealers/custodians do not charge transaction fees for individual equity (including ETF) transactions, others do. Some custodians charge fixed fees for custody and execution services. Choice of custodian is determined by the investment professional and his/her/its client. Higher fees will adversely impact account performance.
OSAM does not maintain actual historical performance results for the Models. In order to help assist the investment professional in determining whether a Model is appropriate for the professional’s client, OSAM has provided back-tested hypothetical (i.e., not actual) performance for the Model. OSAM, with minor deviations that it does not consider to be material*, currently uses the Models (i.e., live models vs. the reflected back-tested versions thereof) to manage actual client portfolios (see Model Deviations below). The performance reflects the current Model holdings, which are subject to ongoing change.
Material Limitations: The Performance is subject to material limitations. Please see Hypothetical/Material Limitations below. During any specific point in time or time-period, the Models, as currently comprised, performed better or worse, with more or less volatility, than corresponding recognized comparative indices, benchmarks or blends thereof.
Past performance may not be indicative of future results. Therefore, it should not be assumed that future performance of any specific investment or investment strategy (including the Models), will be profitable, equal any historical index or blended index performance level(s), or prove successful. Historical index results do not reflect the deduction of transaction and custodial charges, or the deduction of an investment management fee, the incurrence of which would have the effect of decreasing indicated historical performance results. The Russell 3000 is a market capitalization-weighted index of 3000 widely held large, mid, and small cap stocks. Russell chooses the member companies for the Russell 3000 based on market size and liquidity. The MSCI All Country World Index is a market capitalization weighted index designed to provide a broad measure of equity-market performance throughout the world. The MSCI is maintained by Morgan Stanley Capital International and is comprised of stocks from 23 developed countries and 24 emerging markets. The Barclays Capital Aggregate Bond Index is a market capitalization-weighted index, meaning the securities in the index are weighted according to the market size of each bond type. Most U.S. traded investment grade bonds are represented. Municipal bonds and Treasury Inflation-Protected Securities are excluded, due to tax treatment issues. The index includes Treasury securities, Government agency bonds, Mortgage-backed bonds, corporate bonds, and a small amount of foreign bonds traded in U.S. The historical performance results for the Russell 3000, MSCI and Barclays are provided exclusively for comparison purposes only, to provide general comparative information to help assist in determining whether a Model or other type strategy (relative to the reflected indices) is appropriate for his/her investment objective and risk tolerance. Please Also Note: (1) Performance does not reflect the impact of client-incurred taxes; (2) Neither Model or the selected strategy holdings correspond directly to any such comparative index; and (3) comparative indices may be more or less volatile than the Model or selected strategy.
Hypothetical/Material Limitations: Performance reflects hypothetical back-tested results that were achieved by means of the retroactive application of a back-tested portfolio and, as such, the corresponding results have inherent limitations, including: (a) the performance results do not reflect the results of actual trading using investor assets, but were achieved by means of the retroactive application of the Model or strategy (as currently comprised), aspects of which may have been designed with the benefit of hindsight; (b) back tested performance may not reflect the impact that any material market or economic factors might have had on OSAM’s (or the investment professional’s) investment decisions for the Model or the strategy; and, correspondingly; (c) had OSAM used the Model to manage actual client assets (or had the investment professional used the selected strategy to manage actual client assets) during the corresponding time periods, actual performance results could have been materially different for various reasons including variances in the investment management fee incurred, transaction dates, rebalancing dates (increases account turnover), market fluctuation, tax considerations (including tax-loss harvesting-increases account turnover), and the date on which a client engaged OSAM’s investment management services.
MORE ABOUT CANVAS®
CANVAS is an interactive web-based investment tool developed by O’Shaughnessy Asset Management, L.L.C. (“OSAM”) that permits an investment professional (generally a registered investment advisor or a sophisticated investor) to select a desired investment strategy (the “Strategy”) for the professional’s client. At all times, the investment professional, and not OSAM, is responsible maintaining the initial and ongoing relationship with the underlying client and rendering individualized investment advice to the client. In addition, the investment professional and not OSAM, is exclusively responsible for:
- determining the initial and ongoing suitability of the Strategy for the client;
- devising or determining the specific initial and ongoing desired Strategy;
- monitoring performance of the Strategy; and,
- modifying and/or terminating the management of the client’s account using the Strategy.
Hypothetical Limitations: To the extent that the investment professional seeks for CANVAS to provide hypothetical back-tested performance, material limitations apply-see above.
Model Deviations: As indicated above, OSAM, with minor deviations that it does not consider to be material*, currently use the Models to manage actual client portfolios (i.e., the live Models). The deviations include:
- the use of proxies if and when an ETF used in the back-test was not available*. While the back-tested and live strategies both utilize the same investment themes, back-tested proxies can deviate from live models based on limitations of historical information;
- back-tested data presented utilizes a month-end rebalance while actual live model performance reflects intra-month rebalances;
- OSAM, as a discretionary manager, can update its live models as determined necessary. These changes will then be applied retroactively to back-tested models, the resulting performance of which would be different than that of the actual historical models-see Hypothetical/Material Limitations above; and,
- Financial statement information may be restated over time, which information was not reflected in the historical back-tested models. Companies will also have mergers and acquisitions or other corporate events that can retrospectively affect the names and corporate identities of organizations in the historical back-tests. Data providers providing pricing and return information may update historical data upon discovering deficiencies or omissions.
Strategy Sampling Impact: The implementation of OSAM strategies utilize a sampling of the underlying individual Strategy positions, and, as the result thereof, the underlying securities’ weighting could unintentionally deviate +/- the Strategy allocation target OSAM calculates the CANVAS fees based on the mix of strategies that are utilized at the establishment of the account. Therefore, the sampling approach can cause deviations between the CANVAS strategy allocation establishment (and its corresponding fee) and the implementation of that CANVAS strategy.
ESG Portfolios/Socially Responsible Investing Limitations: To the extent applicable to the strategy chosen by the investment professional, Socially Responsible Investing involves the incorporation of Environmental, Social and Governance considerations into the investment due diligence process (“ESG). There are potential limitations associated with allocating a portion of an investment portfolio in ESG securities (i.e., securities that have a mandate to avoid, when possible, investments in such products as alcohol, tobacco, firearms, oil drilling, gambling, etc.). The number of these securities may be limited when compared to those that do not maintain such a mandate. ESG securities could underperform broad market indices. Investors must accept these limitations, including potential for underperformance. Correspondingly, the number of ESG mutual funds and exchange-traded funds are few when compared to those that do not maintain such a mandate. As with any type of investment (including any investment and/or investment strategies recommended and/or undertaken by OSAM), there can be no assurance that investment in ESG securities or funds will be profitable or prove successful.
Tax Management Function: When requested by the investment professional, OSAM will use best efforts to work within Onboarding Budgets, Annual Tax Budgets, and Tracking Error Budgets. However, market and/or specific stock price fluctuations can occur quickly and can correspondingly adversely affect our ability to manage to specified budgets. Additionally, changes to tax budgets, cash flows in and out of an account, mandatory corporate actions, and funding with securities can also impact preciseness. The investment professional must accept this risk. In addition:
- OSAM has not, and will not, verify the accuracy of any tax-related information provided;
- In the event that any such information provided is inaccurate or incomplete, the corresponding results will be inaccurate or incomplete;
- Tracking Error Budgets are relative to the Model, not the benchmark;
- OSAM is not a CPA and this is not tax advice;
- Tax laws and rates change;
- While we seek to follow investment professional prescribed target models, ranges, timeframes, tax budgets, and seek not to create wash sales or exceed expected tax budgets, there can be no assurance that the CANVAS tool will be able to accurately do so; and,
- For specific personalized tax-related advice, consult with a CPA or other tax professional.
Fixed Income ETF Model: The models are constructed using passive fixed income ETFs. The models attempt to target varying levels of duration and credit exposure relative to the Barclays Aggregate Index. The expense ratios of the underlying ETF’s are born by the investor and are separate and apart from CANVAS related fees.
Miscellaneous Limitations/Issues:
- Results in the Transition Portal reflect expense ratios corresponding to the specific funds indicated/provided by the investment professional. Expense ratios are provided by an unaffiliated database. Results also reflect projected future yields corresponding to such current indicated funds. Such data may not be precise;
- The risk-free rate used in the calculation of Sortino, Sharpe, and Treynor ratios is 5%, consistently applied across time;
- OSAM did not begin to offer CANVAS until April 2019. Prior to 2007, OSAM did not manage client assets; and,
- A copy of OSAM’s written disclosure Brochure, Form CRS and Privacy Notice remains available on this CANVAS website or at www.osam.com.
Release and Hold Harmless
The professional, to the fullest extent permitted under applicable law, agrees to release, defend, indemnify and hold OSAM (including its officers, directors, members, owners, employees, agents, and affiliates) harmless from any and all adverse consequences, financial or otherwise, of any type or nature arising from or attributable to the professional’s access to, and use of, CANVAS, including, but not limited to, any claims for alleged or actual client losses or damages of any kind or nature whatsoever (including without limitation, the reimbursement of reasonable attorney’s fees, costs and expenses incurred by OSAM relating to investigating or defending any such claims and/or demands), except to the extent that actual losses are the direct result of an act or omission by OSAM that constitutes willful misfeasance, bad faith or gross negligence as adjudged by a court of final jurisdiction.
*except in the unlikely event that the performance of the proxy used in lieu of the actual ETF was materially different (positive or negative)
Lastly, please be advised, without limitation, OSAM shall not be liable for Losses resulting from or in any way arising out of (i) any action of the investor or its previous advisers or other agents, (ii) force majeure or other events beyond the control of OSAM, including without limitation any failure, default or delay in performance resulting from computer or other electronic or mechanical equipment failure, unauthorized access, strikes, failure of common carrier or utility systems, severe weather or breakdown in communications not reasonably within the control of OSAM, inaccuracy or incompleteness of any third-party data, or other causes commonly known as “acts of God,” or (iii) general market conditions. Under no circumstances shall OSAM be liable for consequential, special, incidental or indirect damages, punitive damages, or lost profits or reputational harm. Additionally, to the extent applicable, the responsibility solely rests on the “master user” of CANVAS at each independent firm, and NOT OSAM, to close out any associated users who may terminate at any time.
Please Note: Projection/Assumption Limitations. To the extent that any portion of the content reflects assumptions and/or projections, no such content should be construed or relied upon as an absolute probability that such an assumption or projection will prove correct or projected result will occur. To the contrary, a different result (positive or negative) can, and most likely will, occur. Materially different results could occur at any specific point in time or over any specific time period. The purpose of the projections is to provide a guideline to help determine which scenario best meets current and/or anticipated financial situations and/or objectives.
Please Note: Limitations: The accuracy of the Tracking Error is co-dependent upon corresponding client-designated constraints. Depending upon nature and extent of the constraints, the results may not correspond to the tracking error.
Please Note: Potential Conflict. OSAM is wholly owned by Franklin Resources, Inc., d/b/a Franklin Templeton. CANVAS could include funds and/or managers affiliated with and/or recommended by Franklin Templeton, as the result of which OSAM’s parent (Franklin) could derive additional compensation.
Please Note: Limitations. There can be no assurance, nor should there be any expectation, that OSAM shall act on any direction, instruction and/or notice on the day it is received.
Where applicable and used in investment offering: S&P 500® (a registered trademark of S&P® Global or its affiliates, an affiliate and third-party licensor of S&P®), S&P MidCap 400® (also known as the S&P 400® index, a registered trademark of S&P® Global or its affiliates, an affiliate and third-party licensor of S&P®), S&P SmallCap 600® (also known as the S&P 600® index, a registered trademark of S&P® Global or its affiliates, an affiliate and third-party licensor of S&P®), S&P Composite 1500® (also known as the S&P 1500® index, a registered trademark of S&P® Global or its affiliates, an affiliate and third-party licensor of S&P®), S&P® Global BMI, S&P® ADR, S&P®/TSX® Composite (S&P® a registered trademark of S&P® Global or its affiliates, an affiliate and third-party licensor of S&P®, and TSX® a registered trademark of TSX®, Inc., a third-party licensor of S&P®) are products of S&P® Dow Jones® Indices LLC or its affiliates (“SPDJI”) and have been licensed for use by Franklin Templeton, of which OSAM is a wholly owned subsidiary. Standard & Poor’s® and S&P® are registered trademarks of Standard & Poor’s Financial Services LLC (“S&P®”); Dow Jones® is a registered trademark of Dow Jones® Trademark Holdings LLC (“Dow Jones®”); and these trademarks have been licensed for use by SPDJI and sublicensed for certain purposes by Franklin Templeton. S&P 500®, S&P MidCap 400® (also known as the S&P 400® index), S&P SmallCap 600® (also known as the S&P 600® index), S&P Composite 1500® (also known as the S&P 1500® index), S&P® Global BMI, S&P® ADR, S&P®/TSX® Composite are not sponsored, endorsed, sold or promoted by SPDJI, Dow Jones®, S&P®, their respective affiliates, and none of such parties make any representation regarding the advisability of investing in such product(s) nor do they have any liability for any errors, omissions, or interruptions of the previously disclosed Indices above.
Additionally, please note, where applicable, funds and/or strategies have been developed solely by OSAM or FRI. The funds and/or strategies are not in any way connected to or sponsored, endorsed, sold or promoted by the London Stock Exchange Group plc and its group undertakings (collectively, the “LSE Group”). FTSE Russell is a trading name of certain of the LSE Group companies. All rights in the “FTSE Russell Index” (the “Index”) vest in the relevant LSE Group company which owns the Index. “FTSE®” “Russell®”, “FTSE Russell®”, “FTSE4Good®”, “ICB®”, and/or “The Yield Book®,” are a trademark(s) of the relevant LSE Group company and are used by any other LSE Group company under license. The Index is calculated by or on behalf of FTSE International Limited, FTSE Fixed Income, LLC, and/or its affiliate, agent, or partner. The LSE Group does not accept any liability whatsoever to any person arising out of (a) the use of, reliance on, or any error in the Index or (b) investment in or operation of the funds and/or strategies. The LSE Group makes no claim, prediction, warranty, or representation either as to the results to be obtained from the funds and/or strategies or the suitability of the Index for the purpose to which it is being put by OSAM or FRI.
Lastly, please note, where applicable, certain funds and/or strategies described herein are indexed to an MSCI index. In addition, MSCI hereby grants to Licensee a temporary, non-sublicensable (except as provided in its Agreement with OSAM), a non-transferable, non-exclusive license to hyperlink to MSCI’s website, www.msci.com, from any Licensee web page containing MSCI data or information. Further, Licensee hereby grants MSCI a temporary non-sub licensable, non-transferable, non-exclusive license to list Licensee as a licensee of MSCI data and to hyperlink to Licensee's website. For the avoidance of doubt, nothing herein shall confer any rights to MSCI in the Informational Materials where the Marks and MSCI logos may appear. Each of these licenses may be revoked at any time by MSCI or Licensee without notice without affecting any of the other rights granted hereunder.
O’Shaughnessy Asset Management, LLC (OSAM) is wholly own


