Inflation and the US Bond and Stock Markets
By Jim O’Shaughnessy
April 2011
“BY A CONTINUING PROCESS OF INFLATION, GOVERNMENT CAN CONFISCATE, SECRETLY AND UNOBSERVED, AN IMPORTANT PART OF THE WEALTH OF THEIR CITIZENS.”
JOHN MAYNARD KEYNES
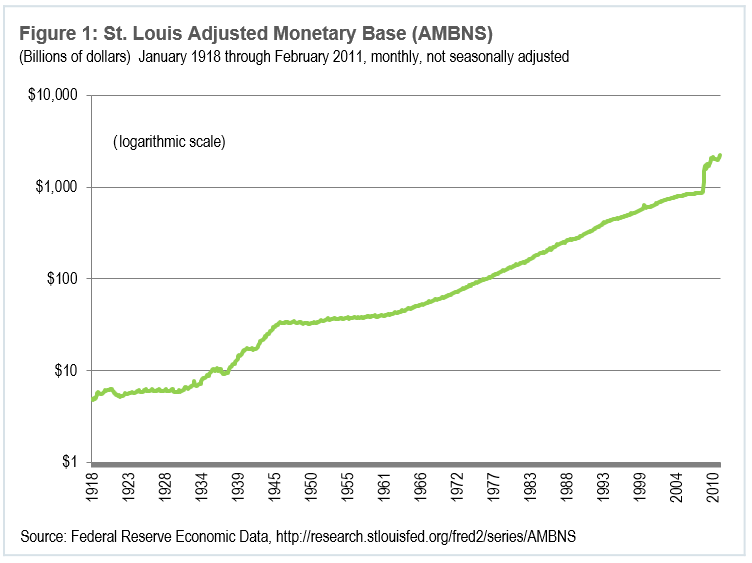
With the Federal Reserve well into Quantitative Easing, Part II (QE2) in its response to the recent economic crisis and recession, we thought it would be an ideal time to review the effects of inflation and deflation on the returns of U.S. bonds and stocks. As Figure 1 makes plain, the adjusted monetary base for the United States has exploded over the last several years. This growth in the monetary base is unprecedented, and as a result many economists and investors expect inflation to increase—perhaps dramatically—in the coming years. Let’s review the history of U.S. inflation and the returns for U.S. stocks and bonds and see what it can teach us about the returns of stocks and bonds during a variety of inflationary periods. We are using the data compiled by Professors Elroy Dimson; Paul Marsh and Mike Staunton from their excellent book Triumph of the Optimists: 101 Years of Global Investment Returns and updated annually since then in Morningstar’s EnCorr Analyzer.
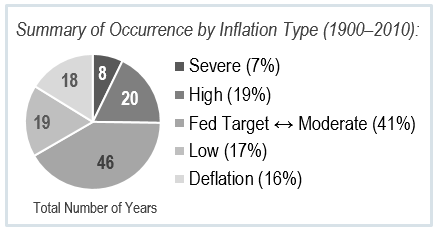
The Dimson-Marsh-Staunton dataset has annual inflation and return data for a variety of countries from 1900 through 2010 and for the purpose of this paper we will focus on the annual levels of inflation and real (inflation-adjusted) returns for U.S. bonds and stocks over the same period. We will focus on five separate types of inflation:
1. Severe Inflation: Years in which annual inflation exceeds 10 per-cent. There were eight years out of the last 111 when this occurred, accounting for 7.21 percent of all observations.
2. High Inflation: Years in which annual inflation was greater than the average for post-gold linked currency exchange America (1971–2011), which was 4.40 per-cent. The maximum inflation rate for the high inflation regime is 10 percent. There were 20 years out of the last 111 where this occurred (18.92 percent of all observations).
3. Fed Target to Moderate Inflation: Years in which inflation was between the high end of the Fed Target (2.0 percent) and the post-1971 average (4.40 percent). According to a November 23, 2010 article in The New York Times,1 “Fed officials now expect inflation to be 1.6 to 2.0 percent and unemployment to be 5 to 6 percent, over an unspecified long run.” There were 46 years out of the last 111 where this occurred (41.44 percent of all observations).
4. Low Inflation: Years in which inflation was between zero and 1.60 percent. There were 19 years out of the last 111 when this occurred (17.12 percent of all observations).
5. Deflation: Years in which prices fell. There were 18 years out of the last 111 when this occurred (16.22 percent of all observations).
We will examine each individual inflationary type in turn, and then look at what we might generally expect from a variety of scenarios for the future. Let’s first look at severe inflation.
Severe Inflation
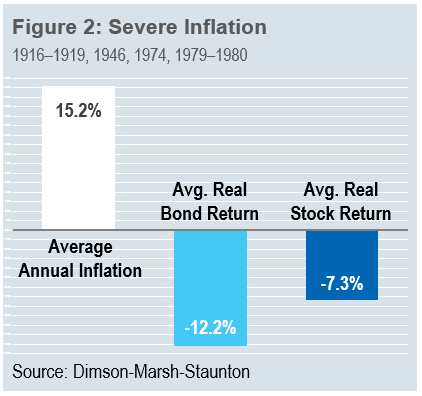
In the past 111 years, only eight experienced double-digit inflation. Two distinct periods emerge for severe and high inflation: the years 1916–1919, (all four of which suffered double-digit inflation) and the period between 1974 and 1980, which had three years of double-digit inflation (1974, 1979, and 1980). As Figure 2 clearly illustrates, severe inflation is devastating to the returns of U.S. bonds and stocks. During these eight years, bonds never recorded a positive real return and lost on average 12.19 percent, while stocks experienced three positive years out of the eight (38 percent of all observations), yet nevertheless lost an average of 7.33 percent. Let’s look at each period more closely.
The 1916–1919 period saw $10,000 invested on December 31, 1915 in U.S. bonds shrink to $5,990, a real (inflation-adjusted) compound average annual decline of 12.03 percent. A similar investment in U.S. stocks shrank to $6,807, an annual real loss of 9.17 per-cent. Over the same period, the value of a U.S. dollar was nearly cut in half, with a basket of goods that cost $10,000 in 1915 soaring to $18,290 by the end of 1919. The cause of this severe inflation is obvious in hind-sight—the newly created U.S. Federal Reserve essentially doubled the money supply during World War I, unleashing an inflation of nearly 80 percent that ravished America between 1916 and 1919. This period illustrates what might await us if the Fed is unable to cut off QE2 in time to head off inflation. It took Andrew Mellon, the newly appointed Secretary of the Treasury under President Warren G. Harding, to contain the mess. Income taxes on the highest incomes had also soared over the period, topping out at 77 percent. Mellon wrote:
“The history of taxation shows that taxes which are inherently excessive are not paid. The high rates inevitably put pressure on the taxpayer to withdraw his capital from productive business.”2
Mellon’s plan to restore economic stability included cutting the top income tax rate from 77 to 24 percent and cajoling the Fed to restore normal interest rates and contract the money supply. You might think of him as one of the first supply-side economists, as his plan increased revenues to the Federal Government. By 1926, 65 per-cent of the income tax revenue came from incomes of $300,000 and higher whereas five years earlier, less than 20 percent did.3
While there was a brief bout of double-digit inflation in 1946 due to World War II and the spending of the U.S. government on foreign aid initiatives such as the Marshall Plan, the next extended period of high and double-digit inflation occurred during the 1974–1980 period. As Professor Brad DeLong points out:
“The 1970s were America’s only peacetime inflation: the only time when uncertainty about prices made every business decision a speculation on monetary policy. In magnitude, the total increase in the price level as a result of the sustained spurt in peacetime inflation to the five-to-ten percent per year range in the 1970s was as large as the jumps in the price level as a result of the major wars of this century.”4
In essence, the cause was the same as that of the inflation of the teens of the twentieth century—the Fed printed money with reckless abandon. The results for the bond market were similar to the 1916–1919 period, with $10,000 invested on December 31, 1973 shrinking to $6,640 at the end of 1980, an average annual real loss of 5.68 per-cent. Stocks did better during this bout of high to severe inflation, with $10,000 invested over the same period growing to $12,014, a real average annual compound gain of 2.66 percent.
For this period, we’re also able to look at how stocks with such differing factor characteristics as high Shareholder Yield (Dividend Yield plus Buyback Yield) and excellent price appreciation perform. As the upcoming Fourth Edition of What Works on Wall Street documents, the ten percent of stocks from our All Stocks universe with the highest six-month price appreciation earned a real (inflation-adjusted) average annual compound return of 15.66 percent, turning $10,000 invested on December 31, 1973 into $27,691 at the end of 1980, whereas the ten percent of stocks with the highest Shareholder Yield grew $10,000 into $19,576, a real average annual compound return of 10.07 per-cent. Thus, during periods of high to severe inflation, it appears that active stock selection strategies add considerable value to an approach that indexes to the broader market.
The Verdict on Severe Inflation
Severe inflation is always destructive to U.S. bond returns, with an investment during severe inflation providing positive returns in none of the eight years of double-digit inflation. Stocks had positive returns in three of the eight year periods (38 percent of the time). Nevertheless, the average return for stocks during severe inflation is a negative 7.33 percent. The one period that we also have factor returns for shows a significant improvement on an investment in a broad index, but we must discount that as it is only a single sample. Thus, if the current Fed monetary expansion leads to double-digit inflation, expect bonds to be crushed and stock indexes to do poorly as well. The only hope, as we will see when looking at the summary for all inflationary periods, might be from active stock selection strategies.
High Inflation
The predominate three periods that show high inflation are those surround-ing World War II and its aftermath (1941, 1942, 1947, 1950, and 1951); the inflationary period of the late 1960s and 1970s and the aftermath of the great inflation of the 1970s (1981; 1987–1990). As Figure 3 demonstrates, high inflation is also deadly for bond investors, with an average real loss to bonds of 2.84 percent. Bonds had positive returns in six of the 20 years of high inflation (30 percent of the time).
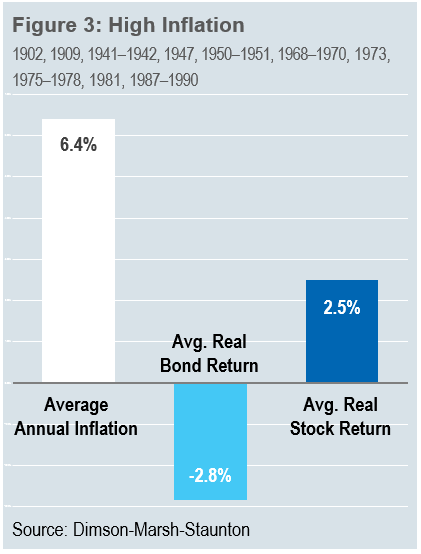
Stocks fare better under a high inflation regime, with the average real return over all years of high inflation being a gain of 2.51 percent. Stocks had positive real returns in 11 of the 20 years of high inflation (55 percent of the time). Here, we’re able to look at all three of these high inflation periods to see if active management adds value. Using the Chicago Research in Security Prices (CRSP) dataset, we see that the real returns to strategies that buy either high price momentum stocks or high Shareholder Yield stocks added significant value for the years 1941–1950, with the ten percent of stocks from All Stocks with the highest six-month price momentum gaining a real average annual compound return of 13.21 percent and turning $10,000 into $34,581. The ten percent of stocks from All Stocks with the highest Shareholder Yield earned a real return of 12.13 percent, turning $10,000 into $31,430. By contrast, the real returns for the S&P 500 proxy over the same period were 7.06 percent, with $10,000 growing to $19,779. U.S. bonds lost a real 3.09 percent over the same period, shrinking $10,000 to $7,309.
Active strategies also added value in the years 1968–1981, with the stocks from All Stocks with the highest Shareholder Yield earning a real 4.93 percent, turning $10,000 into $19,624, and the stocks from All Stocks with the best six-month price appreciation earning a real 4.15 percent, turning $10,000 into $17,674. In contrast, the S&P 500 lost a real 1.44 percent per year, shrinking $10,000 to $8,159 and U.S. bonds lost 3.91 percent per year, turning $10,000 into $5,720.
Finally, for the last period of high inflation, the years 1987–1990, active strategies did not add value over the index. The stocks from All Stocks with the best Shareholder Yield earned a real annual return of 3.94 percent, turning $10,000 into $11,673 and the stocks from All Stocks with the best six-month price appreciation earned 3.03 percent, turning $10,000 into $11,270. The S&P 500 earned a real return of 6.63 percent, turning $10,000 into $12,928. U.S. bonds underperformed both the active strategies and the S&P 500, earning a real annual return 2.54 percent, turning $10,000 into $11,054.
The Verdict on High Inflation
High inflationary environments are very bad for U.S. bonds, with bonds providing positive real returns in only six of the 20 years of high inflation (30 percent of the time). The average real loss for bonds during periods of high inflation is 2.84 percent. Stocks do significantly better than bonds during periods of high inflation, providing positive real returns in 11 of the 20 year periods (55 percent of the time). The average real gain for stocks during high inflation is 2.51 percent. Active strategies added value in two of the three sub-periods, and outperformed bonds in all three.
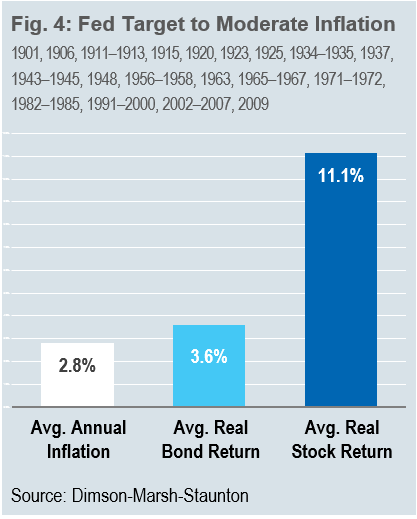
Fed Target to Moderate Inflation
This is the largest sample from the 111 years of the dataset, encompassing 46 years of the 111 analyzed (41.44 percent of the entire sample). U.S. bonds and stocks have positive returns during periods of moderate inflation (see Figure 4) with bonds earning an average real return of 3.58 percent and stocks earning an average real return of 11.14 percent. Bonds earned positive real annual returns in 29 of the 46 years (63 per-cent of the time), whereas stocks earned positive real returns in 36 of the 46 years (78.2 percent of the time). The longest sustained period of moderate inflation was during the years 1991–2009. Two years for that period (2001 and 2008) actually belong in the low inflation category. Yet the two decades of moderate inflation provided very different returns for the stock market. The first period, during the years 1991–1999, was a golden age for the stock market, with the S&P 500 earning a real average annual compound return of 17.81 per-cent and active strategies also excelling, with the best performing stocks from All Stocks based on six-month price appreciation gaining 25.74 per-cent and the stocks from All Stocks with the highest Shareholder yield gaining 16.90 percent. Both the active stock strategies and the index did significantly better than bonds over the period, which gained a real 6.34 per-cent. Yet the second decade of this moderate inflation saw the opposite for the S&P 500—during the years 2000–2009 it lost 3.39 percent a year, turning $10,000 into $7,084. Active strategies did better, with the stocks from All Stocks with the best Share-holder Yield gaining 7.81 percent and turning $10,000 into $21,217 and the stocks from All Stocks with the best six-month price momentum losing 2.75 percent, and turning $10,000 into $7,569. Thus, while on average moderate inflation is very good for stocks, it is not a panacea.
The other lengthy period for moderate to low inflation occurred in the early 1900s and the 1910–1915 period preceding the great inflation following World War I. As you might expect, stocks did the best in the first decade of the twentieth century, with a real average annual compound return for stocks of 11.58 percent, whereas U.S. bonds earned a real 0.61 percent. Finally, for the other longish period between 1910 and 1915, stocks managed to add another real 2.38 per-cent per year, whereas bonds added 1.25 percent.
The Verdict on Fed Target to Moderate Inflation
When inflation is running close to the Fed target (and up to 4.08 percent) on an annual basis, the returns are generally very good for stocks and bonds. On a percentage basis, this is the inflationary regime that is best for stocks, which earned positive returns in 36 of the 46 years (78.2 percent of the time). However, this inflation level is not a panacea for the stock market since stocks earned their worst inflation-adjusted returns in over 111 years during the 2000–2009 period. The average annual gain for stocks during moderate inflation was 11.14 percent. Bonds also performed well during this regime, earning positive returns in 29 of the 46 years (63 percent of the time). We’ll see shortly that bonds do their absolute best in deflationary environments—which is to be expected—but for now, this is an environment where bonds earn an average annual return of 3.58 percent.
Low Inflation
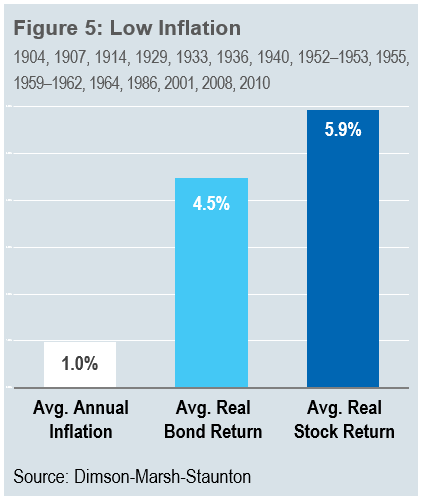
Low inflation is any annual inflation rate between zero and 1.60 percent. Out of the 111-year analysis there were 19 years when this occurred (17.12 percent of the time). The main periods of low inflation occurred during the first decade of the twentieth century, during the years 1952–1955; and during the years 1959–1964. Also included are the years 2001, 2008, and 2010. For the overall regime bonds do very well (see Figure 5), providing positive real returns in 14 of the 19 years (74 percent of the time), earning an average return of 4.47 per-cent. Stocks provide positive returns in 11 of the 19 years (58 percent of the time), a drop from the moderate inflation regime. What’s more, the average return for stocks falls to just 5.92 percent, proving that moderate inflation seems to be a better environment for stocks than very low inflation.
To contrast how active strategies performed versus indexes, we can reference the CRSP dataset and look at stocks with good price momentum and high Shareholder Yield. During the years 1952–1955 the stocks from All Stocks with the best six-month price momentum earned a real average annual compound return of 24.22 per-cent, doing better than the S&P 500, which earned a real 23.43 percent over the same period. Stocks from All Stocks with the highest Shareholder Yield did worse, earning a real 20.05 percent. U.S. Bonds provided a real return of 2.27 percent over the same period. During the years 1959–1964 both active strategies did better than the S&P 500, with the stocks from All Stocks with the best six-month price appreciation gaining a real 12.68 percent and turning $10,000 invested into $20,463 at the end of 1964. Stocks with the highest Shareholder Yield from All Stocks earned a real 10.70 percent per year, turning $10,000 invested into $18,166. An Investment in the S&P 500 earned a real 9.52 percent and turned $10,000 into $17,260. U.S. Bonds returned 2.57 percent over the period, turning $10,000 into $11,647. Thus, for the two longer sub-periods of low inflation, at least one of the active strategies beat the S&P 500 index and both strategies, as well as the S&P 500, beat bonds.
The Verdict on Low Inflation
Low inflation environments are very good for U.S. bonds and generally good for U.S. stocks. The average return for U.S. Stocks of 5.92 percent was brought down by three very unfortunate years for stocks while in a low inflation environment: 1907 (when stocks lost a real 30.04 percent), 1929 (when they lost a real 14.72 percent), and 2008 (when they lost 37.29 percent)—second only to 1931 as the worst calendar year for stocks since 1900. Thus, inflation alone does not necessarily create the conditions for rotten stock market returns and as we are seeing, bonds are much more sensitive to the overall level of inflation. In all of the longer sub-periods for low inflation, at least one of the active stock selection methods bested an investment in an index and for all extended sub-periods for low inflation, both of the active strategies, as well as the S&P 500, performed better than U.S. bonds.
Deflation
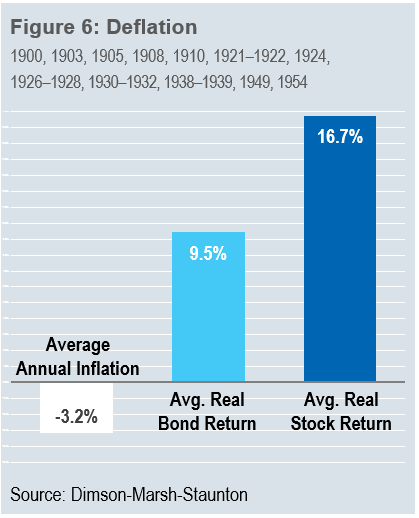
Prices fell in the United States in just 18 of the 111 years we’ve looked at (16.22 percent of the time). This is the best environment for U.S. bonds—they earned positive returns in every one of the 18 years (see Figure 6). The average gain for U.S. bonds during deflation was 9.45 percent, the highest of all of the observations under various regimes. U.S. Stocks tell a slightly different story—they provided positive returns in 14 of the 18 years (77.8 percent of the time). The average gain to stocks during deflation was 16.74 percent. But there is a phenomenon here worth mentioning: stocks do much better with mild deflation. When deflation is between zero and three percent, the average return for U.S. Stocks is 23.69 percent, yet when deflation accelerates and falls between three and 11 percent, stocks get pummeled, with an average loss of -1.34 percent. Remember that two of the worst years for stocks (1930 and 1931)—when they lost 23.95 percent and 37.59 percent respectively—also saw deflation rates of -6.03 percent and -9.52 percent.
The one extended period of deflation was during the years 1930–1932. Since we have CRSP data for the period, we are able to compare how active strategies did versus an index. Remembering that this period covers the worst downturn for the market of the Great Depression, let’s see how they did. The stocks from All Stocks with the best six-month price appreciation lost a real average annual compound 12.20 percent, doing better than the S&P 500, which lost a real 19.98 percent. Stocks from All Stocks with the highest Share-holder Yield lost a real 29.64 percent, considerably worse than the S&P 500. Thus, one of the two active strategies beat the index, while all three lost to U.S. bonds, which gained a real average annual 14.94 percent over the same period.
Summary Results for All Years by Inflation Regime
Table 1 shows the average real returns of U.S. bonds and stocks, as well as for the stocks with high shareholder yields and high six-month price momentum. In order to make an apples-to-apples comparison, we need to commence the analysis in 1926 when the CRSP dataset begins.
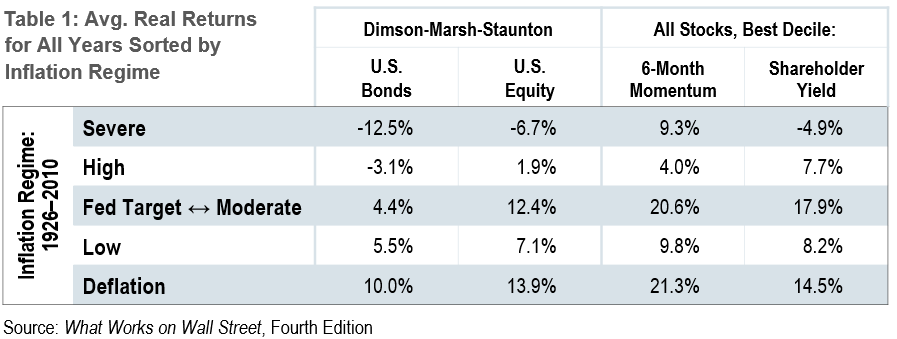
Two key lessons emerge from this analysis. First, if we experience high to severe inflation as a result of government and Federal Reserve policies, the massive inflows into bond funds for the past several years will likely prove harmful to investors’ portfolios. Second, in high to severe inflation environments stocks have a better track record than bonds, and proven stock selection factors and strategies have outperformed the overall stock market.
For those investors worried about the consequences of recent government and Federal Reserve actions, now would be a very appropriate time to position portfolios in equity strategies which focus on high yields and strong momentum.
Footnotes:
1 http://www.nytimes.com/2010/11/24/business/economy/24fed.html
2 http://en.wikipedia.org/wiki/Andrew_Mellon
3 http://en.wikipedia.org/wiki/Andrew_Mellon
4 http://econ161.berkeley.edu/econ_articles/theinflationofthes.html
General Legal Disclosure/Disclaimer
The material contained herein is intended as a general market commentary. Opinions expressed herein are solely those of O’Shaughnessy Asset Management, LLC and may differ from those of your broker or investment firm.
Please remember that past performance is no guarantee of future results. Different types of investments involve varying degrees of risk, and there can be no assurance that the future performance of any specific investment, investment strategy, or product made reference to directly or indirectly in this presentation, will be profitable, equal any corresponding indicated historical performance level(s), or be suitable for any portfolio. Gross of fee performance computations are reflected prior to OSAM’s investment advisory fee (as described in OSAM’s written disclosure statement), the application of which will have the effect of decreasing the composite performance results (for example: an advisory fee of 1% compounded over a 10-year period would reduce a 10% return to an 8.9% annual return). Due to various factors, including changing market conditions, the content may no longer be reflective of current opinions or positions. Moreover, you should not assume that any discussion or information contained in this presentation serves as the receipt of, or as a substitute for, individualized investment advice from OSAM. Historical performance results for investment indices and/or categories have been provided for general comparison purposes only, and generally do not reflect the deduction of transaction and/or custodial charges, the deduction of an investment management fee, nor the impact of taxes, the incurrence of which would have the effect of decreasing historical performance results. It should not be assumed that any account holdings would correspond directly to any comparative indices. Account information has been compiled solely by OSAM, has not been independently verified, and does not reflect the impact of taxes on non-qualified accounts. In preparing this presentation, OSAM has relied upon information provided by the account custodian and/or other third party service providers. OSAM is a Registered Investment Adviser with the SEC and a copy of our current written disclosure statement discussing our advisory services and fees remains available for your review upon request.
Backtested Results
Hypothetical performance results shown on the preceding pages are backtested and do not represent the performance of any account managed by OSAM, but were achieved by means of the retroactive application of each of the previously referenced models, certain aspects of which may have been designed with the benefit of hindsight.
The hypothetical backtested performance does not represent the results of actual trading using client assets nor decision-making during the period and does not and is not intended to indicate the past performance or future performance of any account or investment strategy managed by OSAM. If actual accounts had been managed throughout the period, ongoing research might have resulted in changes to the strategy which might have altered returns. The performance of any account or investment strategy managed by OSAM will differ from the hypothetical backtested performance results for each factor shown herein for a number of reasons, including without limitation the following:
- Although OSAM may consider from time to time one or more of the factors noted herein in managing any account, it may not consider all or any of such factors. OSAM may (and will) from time to time consider factors in addition to those noted herein in managing any account.
- OSAM may rebalance an account more frequently or less frequently than annually and at times other than presented herein.
- OSAM may from time to time manage an account by using non-quantitative, subjective investment management methodologies in conjunction with the application of factors.
- The hypothetical backtested performance results assume full investment, whereas an account managed by OSAM may have a positive cash position upon rebalance. Had the hypothetical backtested performance results included a positive cash position, the results would have been different and generally would have been lower.
- The hypothetical backtested performance results for each factor do not reflect any transaction costs of buying and selling securities, investment management fees (including without limitation management fees and performance fees), custody and other costs, or taxes – all of which would be incurred by an investor in any account managed by OSAM. If such costs and fees were reflected, the hypothetical backtested performance results would be lower.
- The hypothetical performance does not reflect the reinvestment of dividends and distributions therefrom, interest, capital gains and withholding taxes.
- Accounts managed by OSAM are subject to additions and redemptions of assets under management, which may positively or negatively affect performance depending generally upon the timing of such events in relation to the market’s direction.
- Simulated returns may be dependent on the market and economic conditions that existed during the period. Future market or economic conditions can adversely affect the returns.
All Stocks Universe
The universe of All Stocks consists of all securities in the CRSP dataset or S&P Compustat Database with inflation-adjusted market capitalization greater than $200 million. The 50 stocks are equally weighted and generally rebalanced annually.


