Investing in Environmental Protection
By OSAM Research Team
April 2021
Investing Through an Environmental Protection Lens
Since 1970, April 22nd has been a day of supporting environmental protection. As we embrace this day focused on sustainability, it is appropriate to highlight how investors can align their environmental values and investment objectives.
Interest in ESG portfolios is growing. Last year, U.S. sustainable fund flows totaled $51.2B, more than double the 2019 figure and ten times larger than 2018. Additionally, a recent global survey on ESG initiatives stated that 88% of respondents ranked Environment as their top priority.1
Today, companies and industries vary in how they recognize, address, and report on environmental-based risks. Given these differences, there are many avenues for expressing "environmental protection" in an investment portfolio. This piece details just one of these approaches.
Building an Environmental Protection Model
ESG portfolios are typically built using three core levers, which are highlighted below:
1) Exclusions
2) Tilts
3) Active Ownership
The environmental protection model incorporates all three: it overweights companies with strong emphasis on issues like climate change, pushes poor scoring companies to change through proxy voting, and completely divests when the misalignment in values is too large.
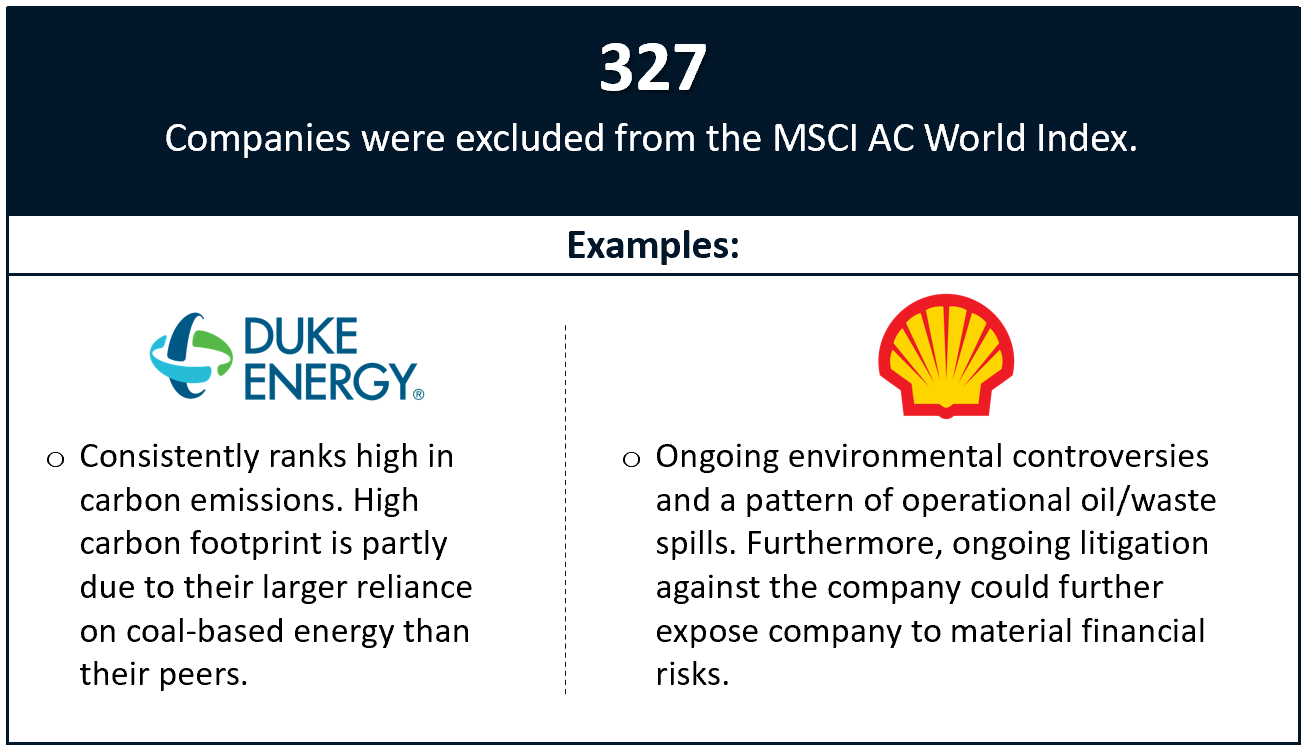
Exclusions: The model excludes companies with business ties to operations that negatively impact the environment: Oil & Gas, Oil Sands, Nuclear, Arctic Oil & Gas Exploration, Shale Energy, Thermal Coal, and companies with high carbon intensity. It also divests from companies involved in any severe environmental related controversies.
Tilts: After these exclusions, we “score” our investible universe on environmental protection metrics and overweight stronger-scoring companies, while underweighting and/or removing lower-scoring ones. We use proprietary data, our ESG scoring convention, and our risk-optimization engine to score and construct ESG portfolios. Our scoring framework incorporates the themes below:
1) Carbon Footprint & Climate Change
2) Carbon Intensity
3) Pollution & Waste Management
4) Water Stress
5) Resource Use
6) Deforestation & Biodiversity
7) Environmental Impact of Products & Services
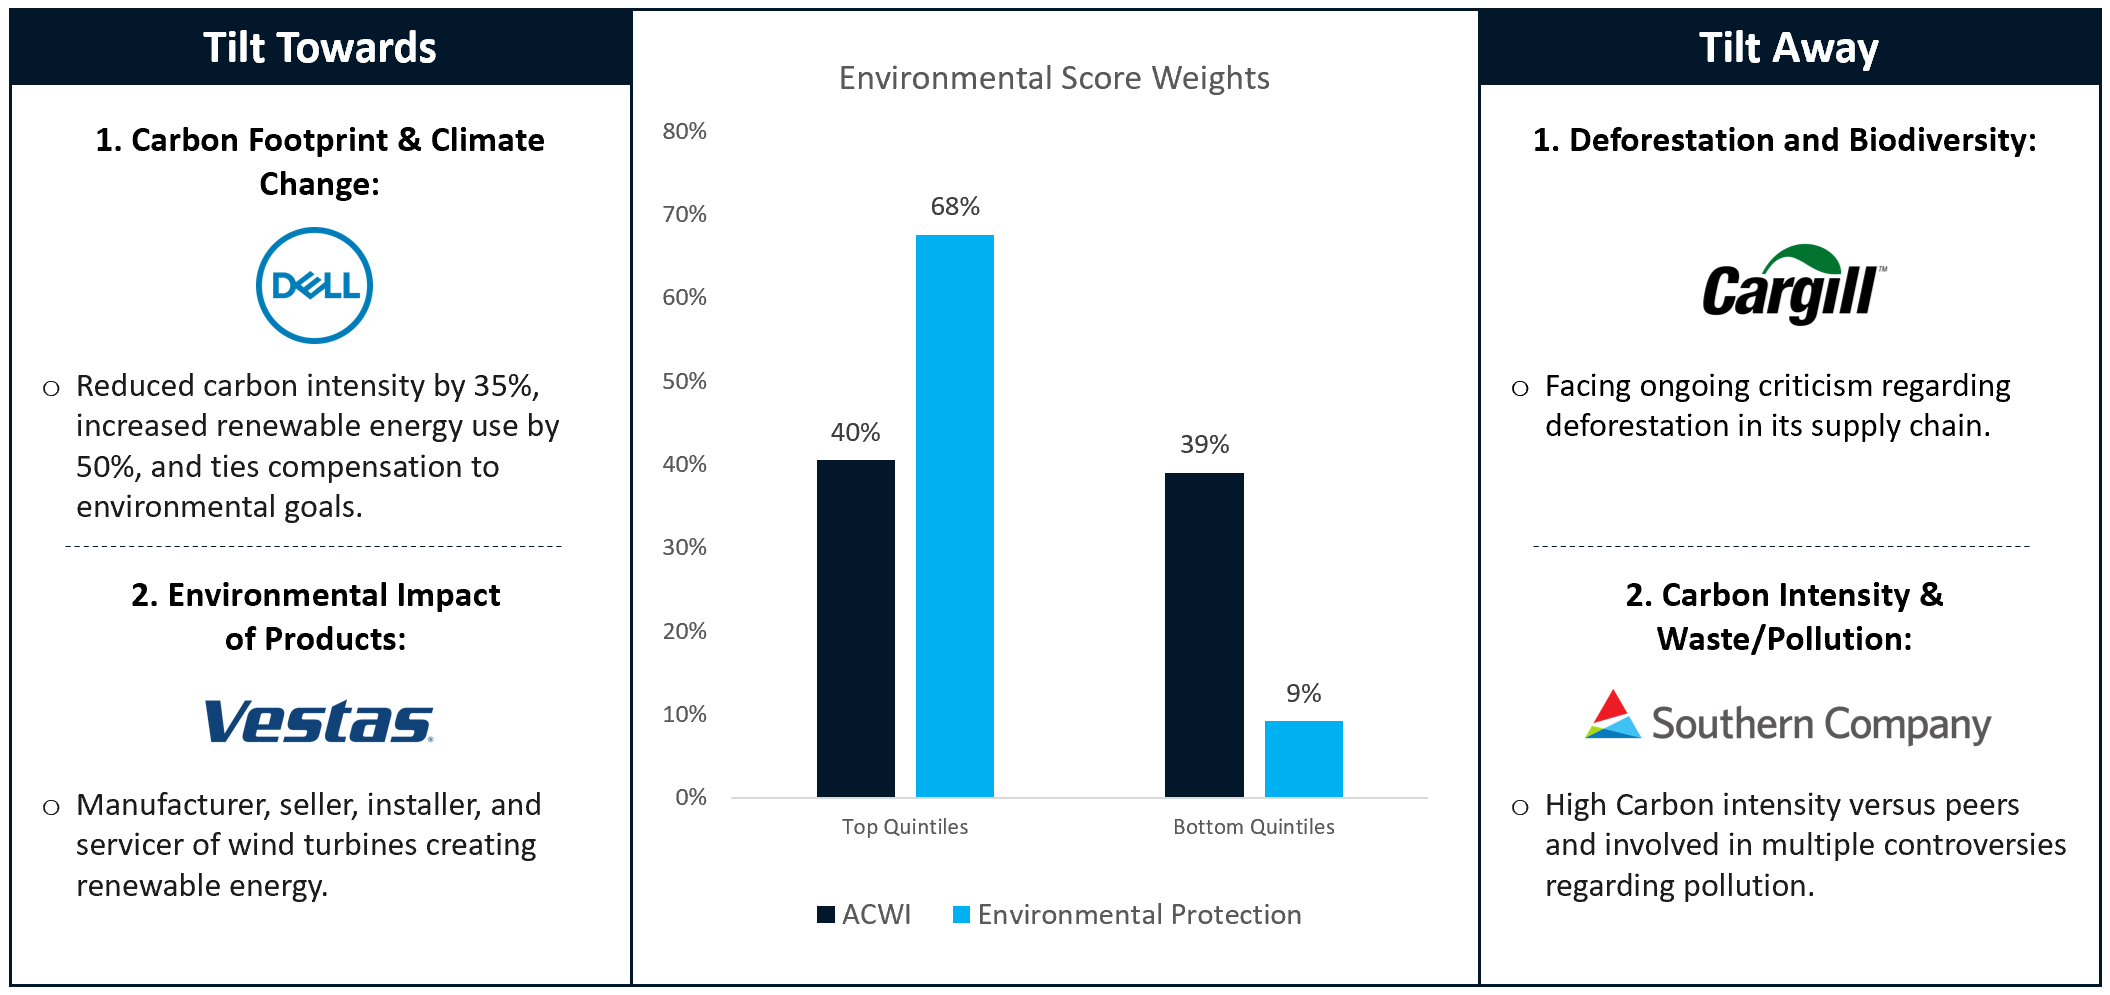
After completely removing the lowest scoring “environmental protection” companies, we increased the environmental protection score of the top scoring quintile of companies by 28% and decreased the bottom scoring quintile of companies by 30% – all while maintaining the efficacy of the underlying investment model.2 Advisors have the flexibility to increase/decrease the “tilt level” to control for tracking error.
Active Ownership: Owning public equities provides the opportunity to vote on shareholder issues. Adding environmentally responsible proxy voting enables an active ownership approach for further influencing portfolio companies. Specific to the environmental protection model, we proxy vote in a way that promotes mitigation of climate risks, plans for more renewable energy use, and yields additional transparency on environmental initiatives like current emissions and/or renewable energy targets.
Returns & Risk
In addition to maximizing exposure to companies most aligned with environmental protection values, advisors often want return characteristics to closely match their firms high-conviction investment model. In other words, we find their most common goal to be significantly improving the pro-environmental protection exposure in the new model while maintaining the efficacy of their legacy investment model. We strive to be the platform where advisors can offer custom, values-based portfolios with unrivaled specificity – in this case, controlling for tracking error to marry risk-adjusted return and environmental-based goals.
Encourage Your Clients to Make it Their Own
There is no single way to address environmental values in a portfolio. Most of our clients use a combination of exclusions, tilts, and proxy voting, but every portfolio is truly unique. This fits our belief that values-based investing is never one-size-fits-all and is better accomplished through a customizable, separately managed account. For advisors interested in portfolios with an environmental focus, within our Canvas platform, you can access the above model, build a variation of it, or create something entirely new. Our mission is to precisely match unique values and investment objectives. Happy Earth Day and make it a point to get outside today!
If you are an advisor and have an ESG model or mandate in mind, we would love to talk: esg@osam.com.
1 https://www.blackrock.com/corporate/literature/publication/blackrock-sustainability-survey.pdf
2 As of December 2020
GENERAL LEGAL DISCLOSURES & HYPOTHETICAL AND/OR BACKTESTED RESULTS DISCLAIMER
The material contained herein is intended as a general market commentary. Opinions expressed herein are solely those of O’Shaughnessy Asset Management, LLC and may differ from those of your broker or investment firm.
Please remember that past performance may not be indicative of future results. Different types of investments involve varying degrees of risk, and there can be no assurance that the future performance of any specific investment, investment strategy, or product (including the investments and/or investment strategies recommended or undertaken by O’Shaughnessy Asset Management, LLC), or any non-investment related content, made reference to directly or indirectly in this piece will be profitable, equal any corresponding indicated historical performance level(s), be suitable for your portfolio or individual situation, or prove successful. Due to various factors, including changing market conditions and/or applicable laws, the content may no longer be reflective of current opinions or positions. Moreover, you should not assume that any discussion or information contained in this piece serves as the receipt of, or as a substitute for, personalized investment advice from O’Shaughnessy Asset Management, LLC. Any individual account performance information reflects the reinvestment of dividends (to the extent applicable), and is net of applicable transaction fees, O’Shaughnessy Asset Management, LLC’s investment management fee (if debited directly from the account), and any other related account expenses. Account information has been compiled solely by O’Shaughnessy Asset Management, LLC, has not been independently verified, and does not reflect the impact of taxes on non-qualified accounts. In preparing this report, O’Shaughnessy Asset Management, LLC has relied upon information provided by the account custodian. Please defer to formal tax documents received from the account custodian for cost basis and tax reporting purposes. Please remember to contact O’Shaughnessy Asset Management, LLC, in writing, if there are any changes in your personal/financial situation or investment objectives for the purpose of reviewing/evaluating/revising our previous recommendations and/or services, or if you want to impose, add, or modify any reasonable restrictions to our investment advisory services. Please Note: Unless you advise, in writing, to the contrary, we will assume that there are no restrictions on our services, other than to manage the account in accordance with your designated investment objective. Please Also Note: Please compare this statement with account statements received from the account custodian. The account custodian does not verify the accuracy of the advisory fee calculation. Please advise us if you have not been receiving monthly statements from the account custodian. Historical performance results for investment indices and/or categories have been provided for general comparison purposes only, and generally do not reflect the deduction of transaction and/or custodial charges, the deduction of an investment management fee, nor the impact of taxes, the incurrence of which would have the effect of decreasing historical performance results. It should not be assumed that your account holdings correspond directly to any comparative indices. To the extent that a reader has any questions regarding the applicability of any specific issue discussed above to his/her individual situation, he/she is encouraged to consult with the professional advisor of his/her choosing. O’Shaughnessy Asset Management, LLC is neither a law firm nor a certified public accounting firm and no portion of the newsletter content should be construed as legal or accounting advice. A copy of the O’Shaughnessy Asset Management, LLC’s current written disclosure statement discussing our advisory services and fees is available upon request
The risk-free rate used in the calculation of Sortino, Sharpe, and Treynor ratios is 5%, consistently applied across time
The universe of All Stocks consists of all securities in the Chicago Research in Security Prices (CRSP) dataset or S&P Compustat Database (or other, as noted) with inflation-adjusted market capitalization greater than $200 million as of most recent year-end. The universe of Large Stocks consists of all securities in the Chicago Research in Security Prices (CRSP) dataset or S&P Compustat Database (or other, as noted) with inflation-adjusted market capitalization greater than the universe average as of most recent year-end. The stocks are equally weighted and generally rebalanced annually
Hypothetical performance results shown on the preceding pages are backtested and do not represent the performance of any account managed by OSAM, but were achieved by means of the retroactive application of each of the previously referenced models, certain aspects of which may have been designed with the benefit of hindsight
The hypothetical backtested performance does not represent the results of actual trading using client assets nor decision-making during the period and does not and is not intended to indicate the past performance or future performance of any account or investment strategy managed by OSAM. If actual accounts had been managed throughout the period, ongoing research might have resulted in changes to the strategy which might have altered returns. The performance of any account or investment strategy managed by OSAM will differ from the hypothetical backtested performance results for each factor shown herein for a number of reasons, including without limitation the following:
- Although OSAM may consider from time to time one or more of the factors noted herein in managing any account, it may not consider all or any of such factors. OSAM may (and will) from time to time consider factors in addition to those noted herein in managing any account.
- OSAM may rebalance an account more frequently or less frequently than annually and at times other than presented herein.
- OSAM may from time to time manage an account by using non-quantitative, subjective investment management methodologies in conjunction with the application of factors.
- The hypothetical backtested performance results assume full investment, whereas an account managed by OSAM may have a positive cash position upon rebalance. Had the hypothetical backtested performance results included a positive cash position, the results would have been different and generally would have been lower.
- The hypothetical backtested performance results for each factor do not reflect any transaction costs of buying and selling securities, investment management fees (including without limitation management fees and performance fees), custody and other costs, or taxes – all of which would be incurred by an investor in any account managed by OSAM. If such costs and fees were reflected, the hypothetical backtested performance results would be lower.
- The hypothetical performance does not reflect the reinvestment of dividends and distributions therefrom, interest, capital gains and withholding taxes.
- Accounts managed by OSAM are subject to additions and redemptions of assets under management, which may positively or negatively affect performance depending generally upon the timing of such events in relation to the market’s direction.
- Simulated returns may be dependent on the market and economic conditions that existed during the period. Future market or economic conditions can adversely affect the returns.
Please Note: Socially Responsible Investing Limitations. Socially Responsible Investing involves the incorporation of Environmental, Social and Governance considerations into the investment due diligence process (“ESG). There are potential limitations associated with allocating a portion of an investment portfolio in ESG securities (i.e., securities that have a mandate to avoid, when possible, investments in such products as alcohol, tobacco, firearms, oil drilling, gambling, etc.). The number of these securities may be limited when compared to those that do not maintain such a mandate. ESG securities could underperform broad market indices. Investors must accept these limitations, including potential for underperformance. Correspondingly, the number of ESG mutual funds and exchange traded funds are few when compared to those that do not maintain such a mandate. As with any type of investment (including any investment and/or investment strategies recommended and/or undertaken by OSAM), there can be no assurance that investment in ESG securities or funds will be profitable, or prove successful.


