Negative Equity, Veiled Value, and the Erosion of Price-to-Book
By OSAM Research Team
April 2018
The price-to-book ratio has a problem. More and more U.S. companies report negative book value, the result of accounting rules and structural changes in the market. This creates broad confusion and problems for the famous value factor, and indexes or strategies which rely on it as a measure of cheapness. Negative equity companies are often written off as distressed, but after reporting negative equity, most of them survive for years and have, as a group, outperformed the market 57% of the time.1 There are currently 118 companies in the U.S. market with negative equity. These companies have had negative equity for an average of over three and a half years, and 25% have had negative equity for over five years. One example is Domino’s Pizza which has had negative equity since their 2004 IPO but has outperformed the S&P 500 by a cumulative 1,442%.2 McDonalds, H&R Block, Yum Brands, HP, Motorola, Denny’s, AutoZone, and Wayfair are also on the list of those with negative book value.
One of the more interesting side effects of this phenomenon is that these companies are often categorized as growth stocks instead of value because they are considered expensive by price-to-book standards. But many of these companies look very cheap by other metrics, like earnings, sales, or cash flow. These distortions in reported financials have a ripple effect that can be seen in the holdings of active value strategies which tend to be underweight these stocks, thereby driving some portion of relative performance of value vs. growth styles.
A solution: reported book values can be adjusted for underlying biases to reduce some of these adverse effects. We show that an improved understanding of the origins of these distortions and their corresponding adjustments can lead to better investment decisions.
TWO GROUPS: NEGATIVE EQUITY AND VEILED VALUE STOCKS
There are two groups of companies that help illustrate these growing dislocations on balance sheets. The first is the overall group of companies with negative equity and the second is a group we will call “Veiled Value” stocks, which are companies that rank in the most expensive 33% by price-to-book but the Cheapest 33% by other valuation metrics.3 Think about Veiled Value stocks as the opposite of a value trap because they are companies that look expensive through the lens of price-to-book but are actually great values in disguise.
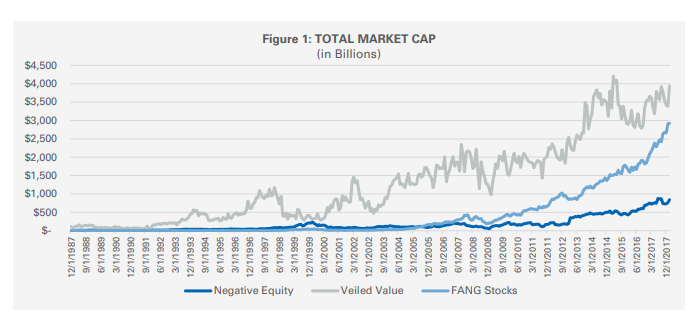
The extreme growth of these groups is a recent phenomenon. In 1988, there were only 13 companies with negative equity with a combined market cap of $15 billion (inflation adjusted) and now there are over 118 which combine to represents $843 billion dollars in market cap. Veiled Value stocks were relatively rare as well: only 60 names and a market cap of $91 billion in 1988. Today, there are over 258 representing over $3.9 trillion of market value. Put in perspective, $3.9 trillion market cap of Veiled Value stocks are larger than the market cap of the FANG stocks combined.4
THE RIPPLE EFFECT: BALANCE SHEETS, STYLE INDICES AND VALUE MANAGERS
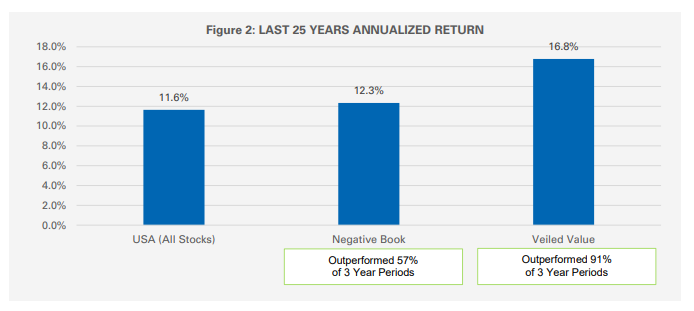
For value investors, some points to consider: companies with negative equity have historically outperformed the market and the Veiled Value stocks have performed even better (See Figure 2). Both groups have also outperformed very consistently over the last 25 years. Negative equity outperformed in almost 60% of rolling three-year periods and Veiled Value names in over 90%.5 An investment process that continually avoids investment in these companies is likely to suffer as a result.
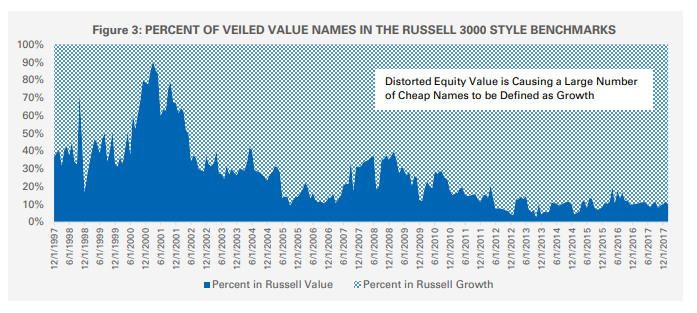
To measure the impact of these balance sheet distortions we begin by reviewing the holdings of style indexes. Over 90% of the Veiled Value group of stocks are defined as growth stocks by Russell’s methodology, even though they rank in the cheapest third of U.S. stocks using metrics other than book value (See Figure 3). Given that these stocks have outperformed the market their absences from the value benchmark is shifting return from value into growth.
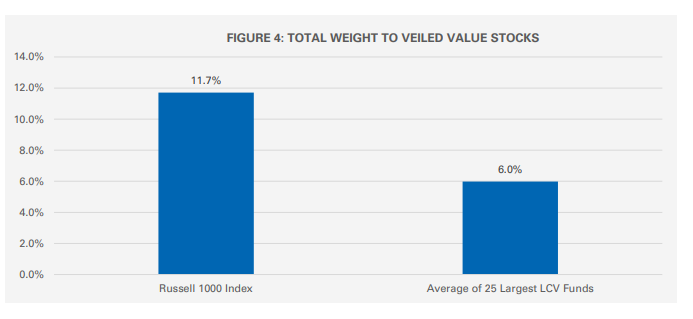
To gauge how much this is affecting actively managed portfolios we pulled the holdings for the largest twentyfive Large Cap Value funds and compared their average allocations to Veiled Value names vs the market index.6 These twenty-five managers represent $817 billion in assets under management (AUM). All but two of the managers were underweight the Veiled Value stocks relative to the index. The average large cap value manager was underweight these names by 5.7% and some even had a near zero percent weight to these companies. There may be an overreliance on price-to-book in actively managed portfolios; whether directly though selection decisions based on the factor or indirectly by using the Russell style index as a starting universe.
HOW WE GOT HERE: GROWING SOURCES OF BALANCE SHEET DISTORTION
Balance sheets prepared under generally accepted accounting principles (GAAP) are doing an increasingly poor job of reflecting the value of shareholders equity. Recent trends have tended to bias assets well below market value which has led to the increased frequency of negative equity and Veiled Value stocks. Those tend to fall into three main categories, that we will cover in detail:
1) Understated Intangible Assets: brand names, human capital, advertising, and research and development (R&D) are rarely represented on the balance sheet
2) Understated Long Term Assets: assets are often depreciated faster than their useful lives
3) Buybacks and Dividends: when buybacks and dividends exceed net income, they create a decrease in equity which can accelerate distortions
INTANGIBLE ASSETS
Most of the understatement in intangible assets are directly tied to the decision of what constitutes an operating expense vs a capital expense. This distinction is not at all trivial and will affect the balance sheet in very different ways. Operating expenses are meant to provide benefits in only the current period and are therefore a onetime expense. Capital expenses create value over multiple periods and are capitalized, creating an asset that is depreciated until it no longer adds any value to the company.
This is a rational way to split up expenses because in theory it matches the cost to the period it contributes to operating profits. However, some expenses that do create value are required by GAAP to be treated as an operating cost which means this value doesn’t get recorded on the books as an asset. The two largest examples are R&D expenses and advertising expenses. The value that companies create through these investments in brands, patents, intellectual capital, technologies and processes is often held at $0 on the balance sheet. As an example, the $90 billion that Coca-Cola has spent on advertising in its history has no value that is shown on balance sheet. Similarly, Boeing has spent over $100 billion designing aircrafts and all that investment does not create an asset.
Prior to 1975 companies could capitalize R&D but the SFAS 2 accounting rule changed that and companies are no longer allowed to do so. Treating R&D as an operating expense is significantly undervaluing the book values of firms that are reliant on these activities. Firms with substantial R&D expenses are common negative book value and Veiled Value companies.
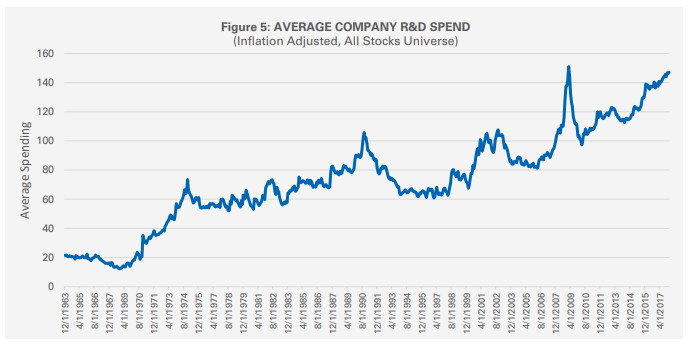
Compounding the downward bias on book value, the average company today spends much more on R&D than in 1975. Sectors with high R&D represent a much larger portion of the market. Health Care and IT companies have higher R&D than any other sector and their weight has more than tripled, growing from 12% of the market in 1975 to 38% today.8 Also, companies in general are spending a lot more on R&D than they used to. Consumer discretionary, for example, looks nothing like it did in 1975. Companies like Amazon, Netflix and Tesla blur the lines between consumer discretionary and technology and even Dominos and Walmart are experimenting with drones for delivery services. This has led to the average company’s R&D investment to be about two and a half times what it was in 1975 (Figure 5).
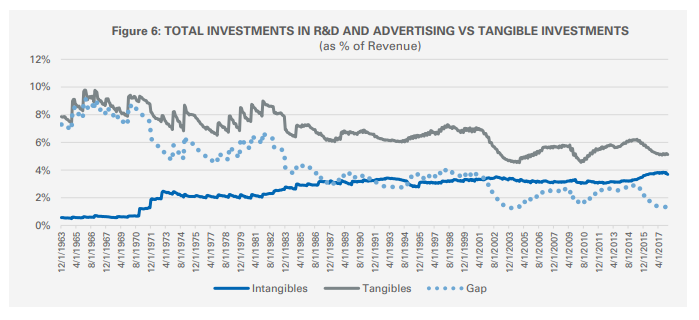
Also, there has been a shift from tangibles dominating a company’s total investment to intangibles being a more equal investment. Some researchers estimate that total intangible investments have surpassed investment in tangibles. Just looking at total R&D and advertising expense vs. total capital expenditure we see that the spend on these intangibles is converging with total tangible investments.
Similar to R&D, advertising expense creates a valuable asset in the form of a brand, but often brands have no value on the balance sheet. The only place brand can show up as an asset on the financials is goodwill and it will only show a value when the brand is acquired, brands grown internally and organically are held at $0. According to balance sheets the Netflix brand is worth $0, Tesla’s brand is worth less than $60 million and the Nike brand (which is the most valuable asset Nike has) is worth less than $139 million. Let’s revisit the Domino’s example. Fourteen years have passed since their IPO with negative equity and not only is Domino’s not bankrupt, but they substantially outperformed the market. How much was their brand worth at the time of their IPO? In 2004, they had been building their brand for 43 years, they were the number one pizza delivery restaurant in the country, owned 20% of the market, and had spent $1.2 billion dollars in advertising in the recent five years but their goodwill was only $20 million. Domino’s intangible assets were understated in this case and therefore so was shareholder’s equity; every $1 that their brand is understated also understates book value by an equal amount. McDonalds is similar, they are one of the most valuable brands in the world, estimated to be worth $42 billion, but their brand is carried on their balance sheet less than $2 billion.10
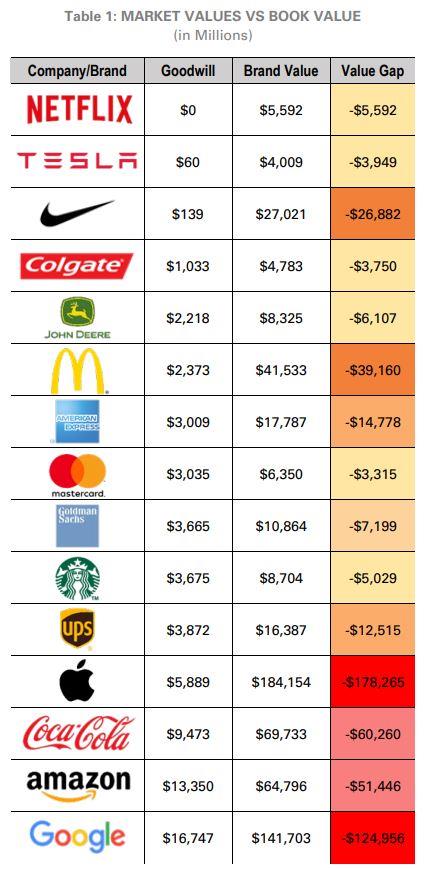
A few companies like Interbrand try to estimate the dollar value of each company’s brand and the gaps between the market value and the book value is often measured in the billions of dollars (Table 1 has a sample). The balance sheet values for these brands will have adverse effects for any valuation based on book value. Advertising builds brand and brand is a valuable intangible asset.
In addition, there are recent accounting rules causing intangible assets to be lower than in past years that has also contributed to increased trend in negative equity. In 2001, FAS 142 was implemented which changed accounting standards in a way that biased book value lower. Before 2001 companies used to amortize goodwill over forty years and now impairment tests are required annually. Because these intangible assets can only be written down and not marked to market for increased valuations that puts downward pressure on total intangible assets.11
R&D expenses are not operating expenses and the value of brands increase with advertising. You can offset these missing intangible assets by creating a capitalized value for each on the balance sheet. We will call these the research asset and the brand asset. We will add these assets to reported book values as the first step in correcting the biases on the balance sheet. We will call this adjusted metric “Enhanced Book Value”.
LONG TERM ASSETS
Intangible assets are not the only reason that total assets are increasingly becoming undervalued on balance sheets. Long term assets are often held well below market value as well and real estate is one of the better examples. Assets like equipment, machinery, office furniture and computers all clearly have a finite life that is predictable. But most corporate real estate does not predictably depreciate and rarely loses its full value. Our office, for example, is a building that is over 100 years old and given its inclusion on the National Register of Historic Places there are systems in place to make sure it is well-preserved and maintained. That does not stop companies from depreciating similar buildings to zero in just a couple decades which leads to assets that hold no value on the balance sheet but are still productive assets.
There are several examples of companies with balance sheets that are nowhere close to reflecting the true value of their real estate owned. Macy’s is a popular example; some people value their real estate assets at multiples of their total market cap.12 The New York location alone valued at $3.3 billion would represent more than 50% of Macy’s market cap.
McDonalds is a name we have already mentioned. It is a newly minted member of the negative equity club and in addition to brand its’ real estate is well below market value on the balance sheet. The once CFO of McDonald’s, Harry J. Sonneborn said, “We’re not technically in the food business. We are in the real estate business. The only reason we sell fifteen-cent hamburgers is because they are the greatest producer of revenue, from which our tenants can pay us our rent.” This quote highlights the fact that, yes, McDonalds sells a lot of burgers (“Billions Served”) but they also own a lot of valuable real estate. That real estate is worth billions of dollars more than its book value. They depreciate their properties using the straight-line method over the shorter of the lease term or 40 years. Their typical lease is 20 years so much of what they bought prior to 1998 and leased to franchisees is held on the books at $0. Even if those buildings were carried at cost and not depreciated at all, inflation would make them worth multiples of what they were purchased for, and in most cases real estate values have outpaced inflation.
These individual examples make the point but there is an even larger example: The growth of a whole industry that is built on corporate real estate, Real Estate Investment Trusts (REITs). With regulatory changes in the early 1990s this sector has seen its total market cap soar. REITs represented just $5.5 billion of the market in 1990 but as of February 2018 that had grown to $1.03 trillion. Currently many analysts feel REITs are trading at a discount to the market value (net asset value) of the underlying assets. Analyst opinions aside, I mention that to make the point that we can use market cap as a ballpark estimate of the market value of the underlying corporate real estate. This helps us get a feel for just how understated these assets are on the balance sheet. The total assets are currently at $739 billion, meaning if we assume market cap is a good proxy for current value they are underrepresented by roughly $291 billion. This is of course a very simplified calculation with a lot of assumptions, but we can look at Public Storage for a practical example.
Public Storage is a $34 billion dollar self-storage REIT with a book value of only $4.9 billion, this book value is low mainly due to the underpriced assets on its balance sheet which are held at $9 billion. For one, their estimated useful life of buildings never exceeds 25 years so anything they acquired prior to 1993 is held near $0. They report the gross and net values of their facilities broken down by city, and you can see on their financials that some cities with multiple locations are depreciated and held at less than 20% of their purchase price. We can also do some very rough calculations to get in the ballpark of how undervalued these assets are. The average facility they own is held at $3.4 million dollars, over the last three years they acquired 94 facilities at an average cost of $8 million dollars. Also, their average book value per square foot is roughly $52; in 2017 they developed an additional 4.6 million square feet at an average cost of $133 a square foot. These are very rough calculations, but both imply the assets are undervalued by over 55-60% of replacement cost. It is likely they are undervalued even more than that amount but even adjusting for that much of a discount would increase book value by 250%
Other REITs of note are Simon Property and SBA Communications. Simon Property is the second largest REIT with an MCAP of $49 billion dollars, but their book value of equity is only $4.2 billion. SBA Communications is an $18 billion dollar REIT but it has a negative book value of -$2.2 billion. These distorted book values are mainly biased lower by the holding value of their real estate assets.
Corporate real estate is the next adjustment we make in the process of building our Enhanced Book Value, to offset the biases caused by the undervalued real estate of REITS and other real estate heavy companies we can estimate the net asset value (i.e. market value) of their real estate assets instead of using their book value. We can increase our Enhanced Book Value calculation for any difference in NAV and book value of real estate assets to get a more accurate picture of equity value.
BUYBACKS AND DIVIDENDS
Buybacks and dividends can also distort book value but in a different way, they do not undervalue total assets in the way aggressive depreciation and failing to capitalize intangible assets would, but they can exaggerate and speed up the problem. My colleague Chris Meredith discusses this in detail in his paper “Price-to-Books Growing Blind Spot.” If a company is generating a ton of cash used to pay dividends and buyback shares then there is an asset allowing them to generate those profits: a patent, a brand, intellectual capital or some other advantage. The problem arises when assets are undervalued to the point book value of equity is biased well below the market cap, a company in this situation that is also distributing cash to shareholders will see its book value rapidly decrease.
When a company has a price-to-book ratio that is above 1 then any buyback or dividend will decrease book value of equity by a larger percentage than it will decrease market value. To illustrate, take the simple example of two companies.
Each has cash of $20 million they want to return to shareholders and the only other asset each owns is one of two identical hotels on the same block, both with a market value of $80 million. But company A just bought their building and company B has depreciated theirs down to $20 million.
Company A has a price-to-book of 1: Market Value / Book Value = 100 / 100 = 1
Company B has a price-to-book of 2.5: Market Value / Book Value = 100 / 40 = 2.5
If both companies use the $20 million to buyback 20% of their shares, then company A’s book value and market value will both go down by 20% and it will still have a price-to-book ratio of 1 (80 / 80 = 1). Company B’s market value will also go down 20% but its book value will get cut by 50%, exaggerating company B’s already depressed book value and ending with a price-to-book ratio of 80/20 = 4. Company B’s identical buyback program decreased the size of its equity by two and half times the percentage as company A and made company B look more expensive by price-to-book, all because its assets were not accurately represented on the balance sheet.13 Recall that these companies have identical assets but company B looks 4 times as expensive because of how their real estate is depreciated.
Returning cash to shareholders wouldn’t show this kind of distortion if assets were shown at an accurate market value.
Let’s revisit Veiled Value. Recall that every company in this group is in most expensive third by price-to-book. The smallest price-to-book ratio in the most expensive third has historically had an average price-to-book of 2.5, matching company B. So that means the minimum added distortion this group will experience is equal to that of company B.
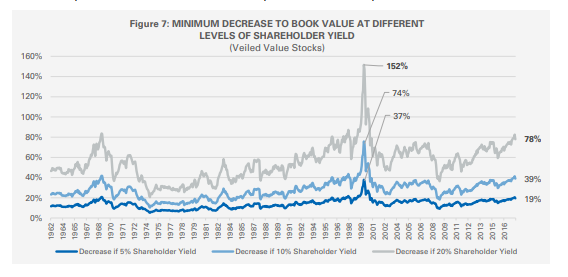
Figure 7 shows the minimum amount that book value would decrease for Veiled Value names at different levels of shareholder yield through time. For example, in 2000 a 5% shareholder yield would decrease equity by 37% and a 20% shareholder yield would completely wipe out all the equity and move the company into negative book value territory. Today a 20% shareholder yield would decrease book value of any Veiled Value stock by at least 78%.
A company returning cash the equivalent of 20% their total market cap to shareholders in the form of dividends and buybacks is an aggressive distribution policy but it is not uncommon, over the last ten years there has been an average of 42 companies a year with shareholder yields above 20%. H&R Block is a recent example, and that large yield wiped out the already low equity on their balance sheet, now they report negative book value.
Boeing is a company right on the edge of negative equity with a total book value of $412 million. That puts their price-to-book at over 540 and they are firmly considered a growth company even in years they rank among the cheapest by P/E. Their assets are undervalued because of both brand and R&D. Just Boeing’s dividend yield of 2.1% is enough to push them into negative equity territory but Boeing also announced an $18 billion buyback program which locks in their path towards wiping out their book value entirely. Boeing has been in the Veiled Value group consistently over the last few years and is almost certain to join the negative equity group in the coming quarters.
Adjusting for shareholder yield will be our final adjustment to “Enhanced Book Value.” For this adjustment we will use a multifactor approach and composite shareholder yield with the book value that is already adjusted for the research asset, brand asset and real estate NAV.
PRICE-TO-ENHANCED BOOK VALUE’S IMPROVED RESULTS
Accurately accounting for all these biases would be difficult task but a very valuable outcome. If you could correctly price intangible assets, long term assets, and adjust for buybacks you would create an unbiased book value of equity and a much clearer picture of which stocks are great values. Making all the alterations recommended in the section above will get closer to that goal, not a perfect book value but an Enhanced Book Value; a much-improved version over what gets reported on financials
To summarize the adjustments to create this version of Enhanced Book Value:
1) Create a Research Asset
a) We will capitalize all R&D expenses and depreciate them over a 10-year productive life (straight line)
2) Create a Brand Asset
a) This is meant to capture what goodwill does not, the brand grown organically and internally through advertising expense
b) We will capitalize advertising expenses and depreciate them over a 10-year productive life
3) Adjust Real Estate Values to Get Closer to Market Value
a) Where net asset value data is available we will add the difference of NAV and book value of real estate to the balance sheet
b) If NAV is not available and real estate assets data is we will add back in accumulated depreciation on corporate real estate.
c) On average this will still understate the value of most real estate assets, but it is closer to market value than the reported book value of these assets
4) Buybacks and Dividends
a) We will use a factor that combines dividends and buybacks called shareholder yield
b) Shareholder yield will be used in combination with the adjusted book value from steps one through three to create a multifactor score
This list of adjustments is in no way a perfect or a final solution, we only view this version of book value as a step in the right direction. The rough 80/20 rule applies, this beta version of Enhanced Book Value is 80% of the benefit and 20% of the work, getting the next 20% of Enhanced Book Value complete will create even better excess returns but it will require a lot of resources to get done. Even with its imperfections we feel this version should be preferred to reported book value as it rectifies many of the distortions we have laid out and the improvement in stock selection is statistically significant (See Table 2). Your alpha selecting cheap stocks doubles in both all stocks and large stocks universes, consistency of outperformance improves, and your quintile spread between cheapest and most expensive increases by 78% in all stocks and 107% in large stocks.
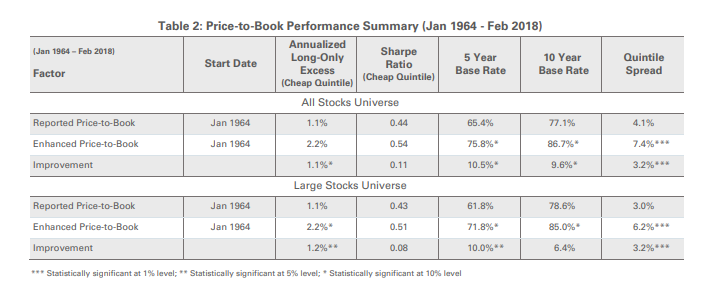
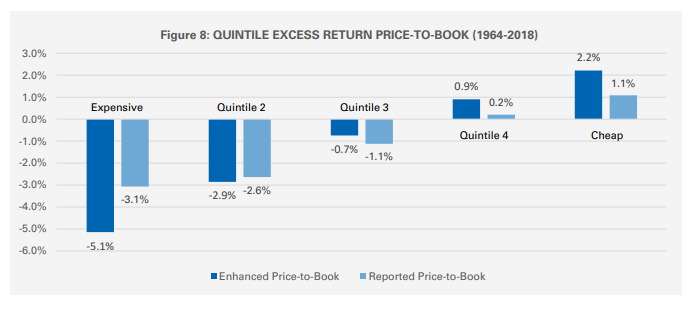
Here is a look at the quintile returns for the longest time period we are able to compare price-to-book and priceto-enhanced book value.
CONCLUSION
Recent accounting rules, the growth of R&D expense, the growing underrepresentation of brands, the increased size of real estate heavy industries, and buybacks/dividends have combined to start a trend in negative book value companies that is likely to continue. More and more inaccuracies are rendering book value a less and less useful metric. For the reasons laid out in this paper, we would caution against the use of reported book value in investment decisions, but some portfolios still rely heavily on reported book value; it is an input into passive indexes, smart beta products and may also be in the holdings of actively managed portfolios. We are confident that the distortions in book value of equity will grow in both size and frequency, but adjustments can be made to lessen the effect they have on your portfolio.
FOOTNOTES
1 Negative book value companies have outperformed in 57% of rolling 3 years periods from 1993 to 2017. Further, companies considered the most expensive 33% by book value but the cheapest 33% by other value metrics outperformed in 91% of rolling 3-year periods.
2 Dominos is up 1,595% as of the close on March 16th and the S&P is up 153% over that same period.
3 For the other valuation factors, we use Price to Sales, Price to Earnings, EBITDA to Enterprise Value, Free Cash Flow Yield, and Shareholder Yield.
4 FANG: Facebook, Amazon, Netflix and Google.
5 All Stocks is an equally weighted universe. Negative Equity and Veiled Value portfolios are rebalanced monthly and holdings held for 12 months, similar to the process used in What Works on Wall Street.
6 We pulled the Top 25 Value strategies by AUM according to the eVestment database, as of 12/31/2017. This represented 54% of the Large Cap Value Assets in eVestment’s database. We used the Russell 1000 holdings as of 12/31/2017 for the market holdings.
7 There are many more reasons biasing assets below market value, but they are outside the scope of this paper.
8 Measured by the Russell 3000, 1/1/1978 to 1/1/2018.
9 Based on All Stocks Universe average.
10 The only way that brand is valued on their balance sheet is when they acquire a franchisee and roll them into the corporate owned restaurants, $2 Billion is from their 2017 10 K. Intrabrand estimated the McDonalds Brand to be worth $42 billion. http://interbrand.com/best-brands/best-global-brands/2017/ranking/
11 Wayman, Rick “Accounting Rules Could Roil the Markets”.
12 Corkey, Michael “Grand Buildings Help Keep Macy’s Afloat: The Company’s real estate is now worth more than its market value” The New York Times. 11/22/2017.
13 This would be identical if it were dividends instead of buybacks.
GENERAL LEGAL DISCLOSURES & HYPOTHETICAL AND/OR BACKTESTED RESULTS DISCLAIMER
The material contained herein is intended as a general market commentary. Opinions expressed herein are solely those of O’Shaughnessy Asset Management, LLC and may differ from those of your broker or investment firm.
Please remember that past performance may not be indicative of future results. Different types of investments involve varying degrees of risk, and there can be no assurance that the future performance of any specific investment, investment strategy, or product (including the investments and/or investment strategies recommended or undertaken by O’Shaughnessy Asset Management, LLC), or any non-investment related content, made reference to directly or indirectly in this piece will be profitable, equal any corresponding indicated historical performance level(s), be suitable for your portfolio or individual situation, or prove successful. Due to various factors, including changing market conditions and/or applicable laws, the content may no longer be reflective of current opinions or positions. Moreover, you should not assume that any discussion or information contained in this piece serves as the receipt of, or as a substitute for, personalized investment advice from O’Shaughnessy Asset Management, LLC. Any individual account performance information reflects the reinvestment of dividends (to the extent applicable), and is net of applicable transaction fees, O’Shaughnessy Asset Management, LLC’s investment management fee (if debited directly from the account), and any other related account expenses. Account information has been compiled solely by O’Shaughnessy Asset Management, LLC, has not been independently verified, and does not reflect the impact of taxes on non-qualified accounts. In preparing this report, O’Shaughnessy Asset Management, LLC has relied upon information provided by the account custodian. Please defer to formal tax documents received from the account custodian for cost basis and tax reporting purposes. Please remember to contact O’Shaughnessy Asset Management, LLC, in writing, if there are any changes in your personal/financial situation or investment objectives for the purpose of reviewing/evaluating/revising our previous recommendations and/or services, or if you want to impose, add, or modify any reasonable restrictions to our investment advisory services. Please Note: Unless you advise, in writing, to the contrary, we will assume that there are no restrictions on our services, other than to manage the account in accordance with your designated investment objective. Please Also Note: Please compare this statement with account statements received from the account custodian. The account custodian does not verify the accuracy of the advisory fee calculation. Please advise us if you have not been receiving monthly statements from the account custodian. Historical performance results for investment indices and/or categories have been provided for general comparison purposes only, and generally do not reflect the deduction of transaction and/or custodial charges, the deduction of an investment management fee, nor the impact of taxes, the incurrence of which would have the effect of decreasing historical performance results. It should not be assumed that your account holdings correspond directly to any comparative indices. To the extent that a reader has any questions regarding the applicability of any specific issue discussed above to his/her individual situation, he/she is encouraged to consult with the professional advisor of his/her choosing. O’Shaughnessy Asset Management, LLC is neither a law firm nor a certified public accounting firm and no portion of the newsletter content should be construed as legal or accounting advice. A copy of the O’Shaughnessy Asset Management, LLC’s current written disclosure statement discussing our advisory services and fees is available upon request
The risk-free rate used in the calculation of Sortino, Sharpe, and Treynor ratios is 5%, consistently applied across time
The universe of All Stocks consists of all securities in the Chicago Research in Security Prices (CRSP) dataset or S&P Compustat Database (or other, as noted) with inflation-adjusted market capitalization greater than $200 million as of most recent year-end. The universe of Large Stocks consists of all securities in the Chicago Research in Security Prices (CRSP) dataset or S&P Compustat Database (or other, as noted) with inflation-adjusted market capitalization greater than the universe average as of most recent year-end. The stocks are equally weighted and generally rebalanced annually
Hypothetical performance results shown on the preceding pages are backtested and do not represent the performance of any account managed by OSAM, but were achieved by means of the retroactive application of each of the previously referenced models, certain aspects of which may have been designed with the benefit of hindsight
The hypothetical backtested performance does not represent the results of actual trading using client assets nor decision-making during the period and does not and is not intended to indicate the past performance or future performance of any account or investment strategy managed by OSAM. If actual accounts had been managed throughout the period, ongoing research might have resulted in changes to the strategy which might have altered returns. The performance of any account or investment strategy managed by OSAM will differ from the hypothetical backtested performance results for each factor shown herein for a number of reasons, including without limitation the following:
- Although OSAM may consider from time to time one or more of the factors noted herein in managing any account, it may not consider all or any of such factors. OSAM may (and will) from time to time consider factors in addition to those noted herein in managing any account.
- OSAM may rebalance an account more frequently or less frequently than annually and at times other than presented herein.
- OSAM may from time to time manage an account by using non-quantitative, subjective investment management methodologies in conjunction with the application of factors.
- The hypothetical backtested performance results assume full investment, whereas an account managed by OSAM may have a positive cash position upon rebalance. Had the hypothetical backtested performance results included a positive cash position, the results would have been different and generally would have been lower.
- The hypothetical backtested performance results for each factor do not reflect any transaction costs of buying and selling securities, investment management fees (including without limitation management fees and performance fees), custody and other costs, or taxes – all of which would be incurred by an investor in any account managed by OSAM. If such costs and fees were reflected, the hypothetical backtested performance results would be lower.
- The hypothetical performance does not reflect the reinvestment of dividends and distributions therefrom, interest, capital gains and withholding taxes.
- Accounts managed by OSAM are subject to additions and redemptions of assets under management, which may positively or negatively affect performance depending generally upon the timing of such events in relation to the market’s direction.
- Simulated returns may be dependent on the market and economic conditions that existed during the period. Future market or economic conditions can adversely affect the returns.


