Technology & The Financial Printing Press
By Jamie Catherwood
February 2021

“The story of finance is the story of a technology: a way of doing things. Like other technologies, it developed through innovations that improved efficiency. It is not intrinsically good or bad.”
- William Goetzmann (Money Changes Everything, How Finance Made Civilization Possible)
History repeatedly demonstrates that an abundance of information often produces technological innovations designed to better analyze and synthesize such data to produce valuable new insights. Ironically, the boom in information often stems from the original technology itself so that there is a constant cycle of innovations producing new data / information, necessitating more technological innovations to analyze and synthesize this information.
This progression is reflected in one of history’s most important inventions: The Printing Press.
THE PRINTING PRESS

Before the German goldsmith Johannes Gutenberg invented his printing press circa 1440, producing books and manuscripts was the ultimate “manual” process. Prior to Gutenberg’s press, a thriving scribe industry meticulously copied manuscripts by hand to re-produce popular contemporary works. This laborious, slow, and inefficient process produced countless errors (typos, missing text, etc.). Given the power bestowed in these scribes to re-produce these copied texts verbatim, certain factions of scribes inevitably wielded their influence by purposefully omitting sections of texts and/or altered manuscripts to influence readers’ interpretation of the text.
It was within this un-standardized, slow, and often inaccurate system that the Gutenberg Press was born. The transformative impact of the Gutenberg Press is too extensive to summarize in one article, but the obvious result was a significant uptick in published works. The chart below exhibits the number of titles published annually from 1470-1799.
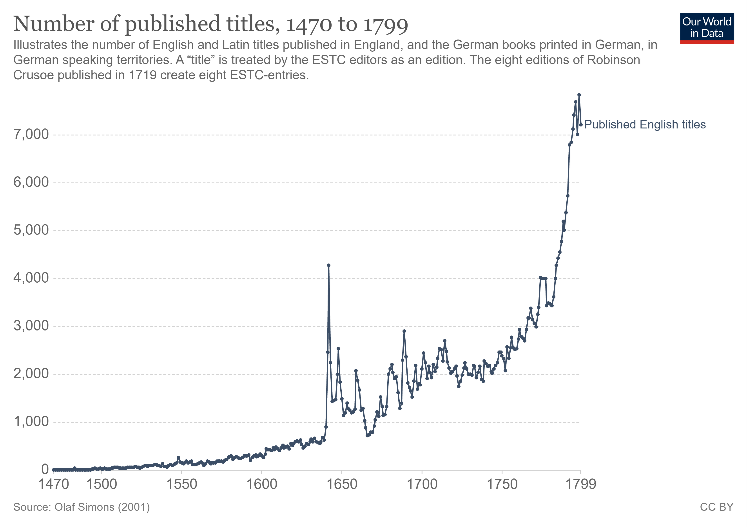
Roughly 3 million books were produced in Western Europe during the year 1550 alone; more than all the manuscripts produced during the entire 14th century.1
An equally important but underappreciated aspect of the printing press was the increased accuracy it brought to written work. Within the field of science, the man that developed the scientific method, Francis Bacon, wrote in the 17th century that “the three most important inventions were gunpowder, the magnetic compass, and printing.”2
The historian Elizabeth Eisenstein reiterated this sentiment in her book on the printing press in 1980:3
“She said that its biggest gift to science wasn’t necessarily the speed at which ideas could spread with printed books, but the accuracy with which the original data were copied. With printed formulas and mathematical tables in hand, scientists could trust the fidelity of existing data and devote more energy to breaking new ground.”
Yet, not everyone was pleased with the amount of works being published. Like complaints about the impact of social media, clickbait articles, and the internet today, contemporaries worried over the negative repercussions of excess information spawned by printing. The Economist wrote:
“Half a millennium ago, the printing press was to blame. ‘Is there anywhere on Earth exempt from these swarms of new books?’ moaned Erasmus in 1525. New titles were appearing in such abundance, thousands every year. How could anyone figure out which ones were worth reading? Overwhelmed scholars across Europe worried that good ideas were being lost amid the deluge. Francisco Sanchez, a Spanish philosopher, complained in 1581 that 10m years was not long enough to read all the books in existence. The German polymath Gottfried Wilhelm Leibniz grumbled in 1680 of ‘that horrible mass of books which keeps on growing’.”4
To deal with this onslaught of information, new systems and mechanisms were established that still live on today. The first set of book reviews in scholarly journals were published in the 17th century in efforts to help curate and synthesize important book titles. The Table of Contents and Index were also introduced so readers could quickly navigate through books for specific information. Of course, however, these innovations had their critics. Author Jonathan Swift lamented in 1704 that people “pretend to understand a book by scouting through the index”. Certain authors went so far as to refuse including an Index in their book to coerce readers into consuming their book in its entirety.
While unrelated to finance specifically, the printing press provides a useful example of the progression outlined in the introduction. A new technology produces a boom in new information that quickly becomes overwhelming. To combat this information overload, new technologies and systems are created to synthesize information and make it more navigable. For the printing press, this meant adding an Index and Table of Contents, but also produced new aggregated information resources like encyclopedias, which were first published across Western Europe in the 16th century.
THE FINANCIAL PRINTING PRESS: TICKER MACHINES
In 1903, Sereno Pratt stated the cornerstone of modern finance is “speed with accuracy [and] promptness in all things.” Pratt also argued “most of the tools of Wall Street are time-savers”, with the six most important tools being:5
- The stock indicator [Ticker]
- The telegraph
- The cable
- The telephone
- The news slips
- The market reports
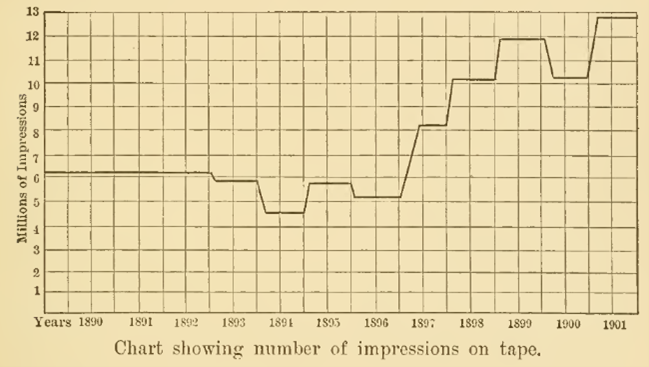
In addition to being a crucial innovation for improved efficiency and time-saving, the ticker machine was like the printing press in that it democratized access to information through widening its dissemination at a scale never seen before. The chart below depicting ticker “impressions” is similar to the earlier chart exhibiting growth in published book titles:6
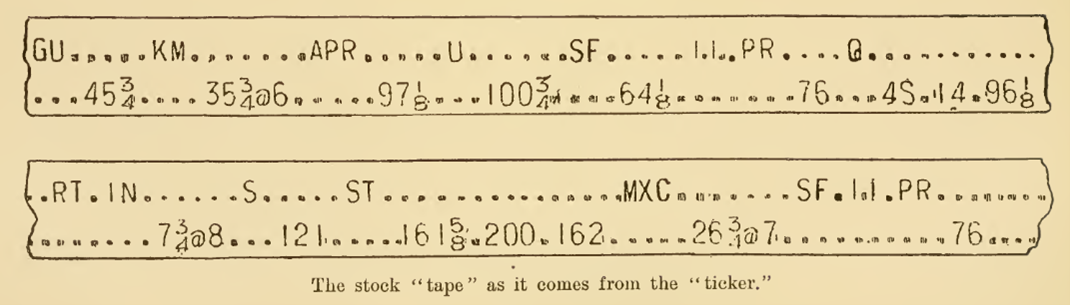
The image below portrays examples of some of the earliest ticker tape readings:
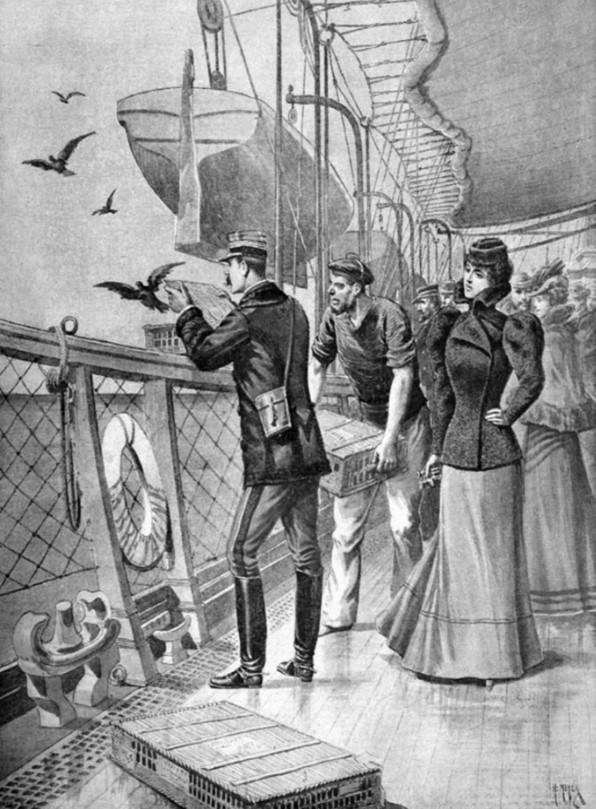
To truly visualize and understand the significance of the ticker for transmitting market prices speedily around the world it is helpful to consider the systems in place pre-ticker. The excerpt below describes a carrier-pigeon system employed by market participants for transmitting information from Europe to Boston:
“Before the days of the Atlantic cable, Mr. D. H. Craig, of Boston, conceived the idea of training pigeons to act as messengers for the European news brought by foreign steamers arriving at Halifax. He would take with him a half dozen of his pigeons, board the incoming steamer, and take passage thereon for Boston.
Once on board the steamer, he would secure copies of the latest dates of the European papers, and from their pages prepare a careful digest of the significant political and commercial news, written upon fine manifolded tissue paper. At the proper moment, the pigeons were dispatched from the steamer on their homeward journey, and with fleet wings soon reached their destination, with the valuable reports, which were quickly transcribed and distributed to Mr. Craig's subscribers in Boston, and by telegraph to other cities.
While this system seems crude and unsatisfactory, in comparison with modern methods now in use, yet, at that time, the fortunate subscribers to Craig's "bird mail" were often rewarded in their market operations by the possession of early information.”7
Beyond the obvious increase in pricing information, there were other important developments resulting from the boom in continuously streaming market data newly available to investors outside of Wall Street. Two knock-on effects are worth further discussion: the increased importance of professionals synthesizing information and the rise of more sophisticated investment analysis and strategies resulting from more voluminous data to back-test.
The Ticker & Market Synthesizers
To revisit the words of our 1903 author Sereno Pratt, the ticker machine was only one of six key innovations in the financial services industry. Two of the remaining five are interesting in that they represent a profession that has always prevailed in times of informational abundance: synthesizers, curators, aggregators – whatever you want to call them.
Specifically, the two important Wall Street tools Pratt referred to were Market Reports and News Slips. As new concepts like the encyclopedia, index, and book reviews were introduced to synthesize and distill the sea of information produced by printing presses, the market reports and news slips equally aimed to provide a valuable service for investors targeting the most important news in a sea of headlines.
Pratt describes the value of news slips in the excerpt below:8
“Wall Street is always eager for the latest news. It is not content to rely on the morning and evening editions of the daily papers, or even upon the elaborate articles of the financial press. It must have the news the instant it develops, news is the very air that speculation breathes. To supply this need, two news agencies exist in Wall Street, one that of the 'New York News Bureau, and the other that of Dow, Jones & Company, founded by Charles H. Dow…
These two concerns issue every few minutes what are called the News Slips... These slips are of convenient size, are printed on rapid presses, and are distributed to subscribers by an army of messengers. The brokers keep the slips in pads, thus having at all times a complete record of the day… every item of general news is given, but especial attention is paid to railroad earnings, crop reports, and other matters bearing directly upon the market.”
For more in-depth reporting and analysis, there were market reports:
“The first regular daily stock market report appeared in London in 1825, and the New York papers were quick to copy after their London contemporaries. It has only been within a generation, however, that the market report has become almost a science requiring mastery not only of the current influences affecting speculation, but also of the fundamental economic principles underlying business.”
Pratt states that the key benefit of the market report was saving time: “the market report performs this special service… it saves him much of the trouble and time of analyzing reports and statements, and of interpreting movements.”
Like the printing presses overwhelmed readers with manuscripts and books, individuals needed a way to sift through the deluge of information: “the business man would require a large reference library and several clerks to obtain for himself the information which is now furnished for him by the experts who write the leading market reports.”9
EARLY SYSTEMATIC INVESTING STRATEGIES
With a long history of data made available by the ticker, early quantitative investors began compiling and analyzing back-tested performance for more sophisticated strategies by leveraging this extended history.
In his book Scientific Forecasting, statistician Karl G. Karsten took on the daunting task of creating a systematic investment strategy based on quantitative analysis. In the introduction, Karsten writes that “the statistician must become an economist and the economist a statistician; and there must result a study of quantitative economics…”. He continued:10
"The basis for this book is an investigation into the causes of certain aspects of and changes in economic conditions in the United States… particular attention has been given to the possibility of so correctly identifying and evaluating the causes of economic conditions as to permit the making of successful forecasts…
At all times, the investigation has been aimed at such completeness of analysis as would permit of securing statistical instead of ‘opinionative’ forecasts.
An invariable rule has therefore been maintained whereby no conclusions would be accepted which could not be statistically demonstrated and so precisely formulated as to be capable of expression in mathematical form, derived through processes regarded as rationally sound as well as empirically successful.”
In other words, Karsten’s predictions were entirely reliant upon systematic and mathematically based processes. His systematic approach to finding ‘factors’ influencing economic conditions, collecting and normalizing data sources, back-testing performance before testing in real-time, and more, are all outlined below:
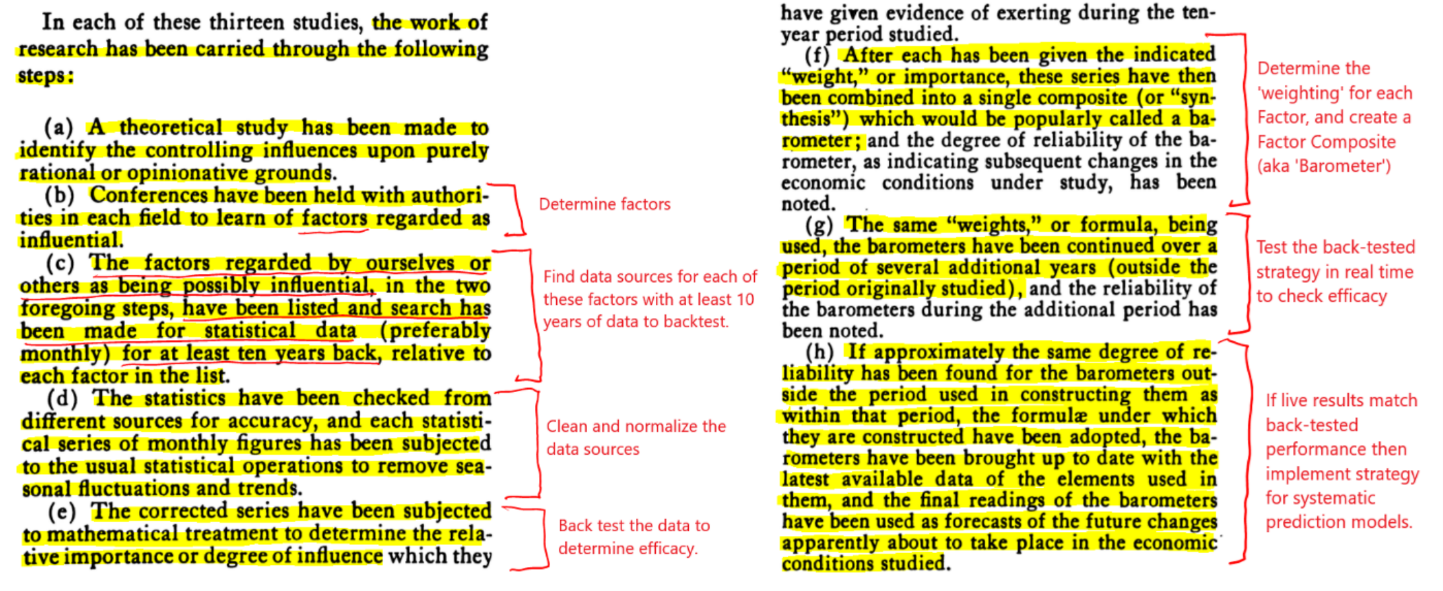
Applying his barometer of factors to the stock market, Wall Street Journal columnist Jason Zweig explains that Karsten had developed a Long/Short Momentum fund utilizing what Karsten called “the hedge principle”.11
“Diving even deeper into the data, however, he made discoveries that anticipated many of the ideas behind hedge funds and so-called smart beta, or mechanical strategies to earn excess returns, that are so popular today.
By 1928, Karsten was investing based on his theories. He wasted two years trying to combine subjective judgment with statistical analysis, but on Dec. 17, 1930, he launched a small fund run with real money and nothing but math.
Under what Karsten called “the hedge principle,” his “Demonstration Fund” appears to have bought the three biggest stocks in the industry sector whose share prices had been rising the most; at the same time, it sold short, or bet against, the rest of the stock market. The fund rotated from one sector to another based on whichever had the best price momentum.”
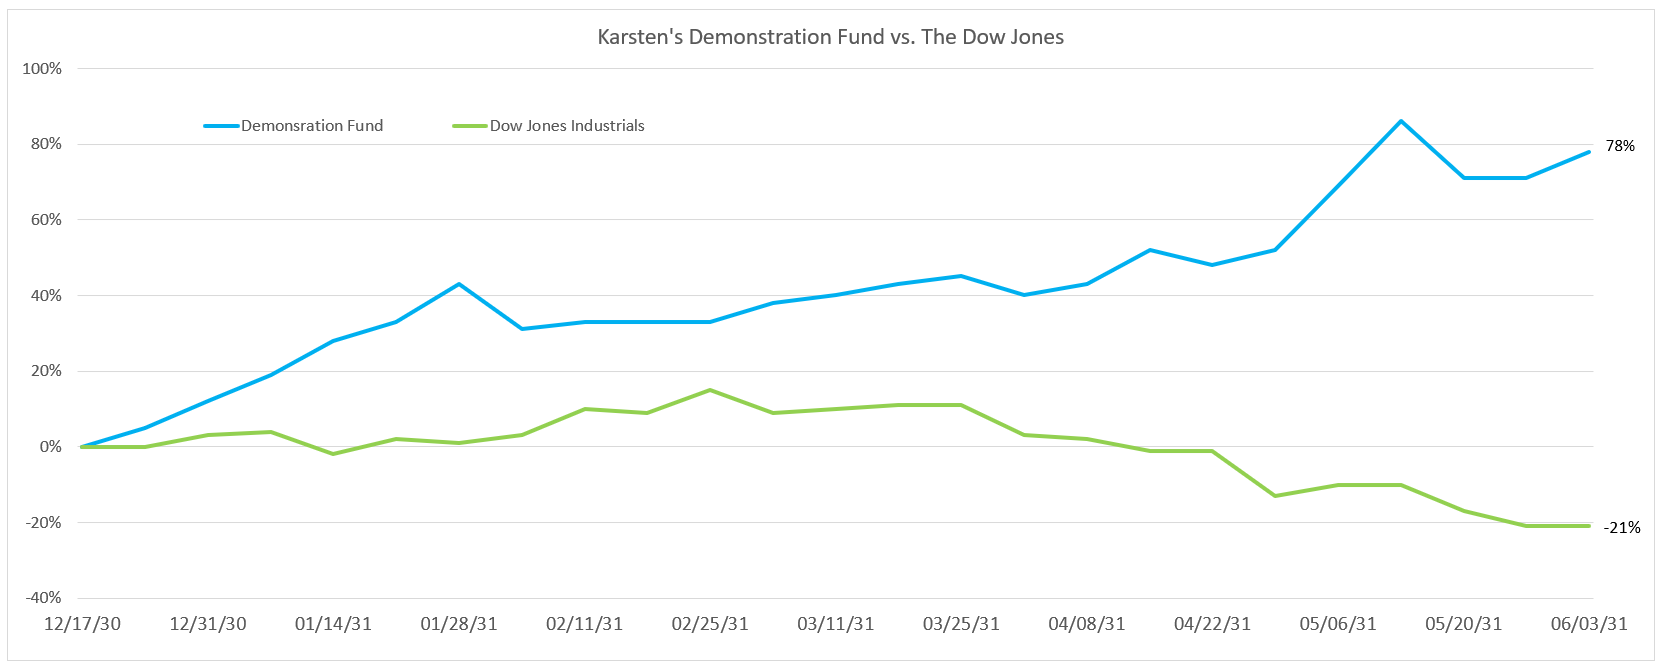
The live time results of Karsten’s “Demonstration Fund” – benchmarked against the Dow Jones – are shown below. In the admittedly short time frame, Karsten’s quantitative and math-based strategy gained 78% while the Dow fell 21%.
Recognizing the success of his approach, Karsten theorized that as computing power and analytics improved further over time, there would be “no reason why a very large machine [computer] should not be made for the simultaneous calculation of a large number of predictions of different phases of business and financial conditions”.12
“There is no reason why, with the wealth of statistical data now available, several hundred series could not be studied by the economist for this purpose. Once the formulae are obtained, there is no reason why a machine should not be built to compute the economic forecasts mechanically... no reason why a single very large machine should not be made for the simultaneous calculation of a large number of predictions of different phases of business and financial conditions...
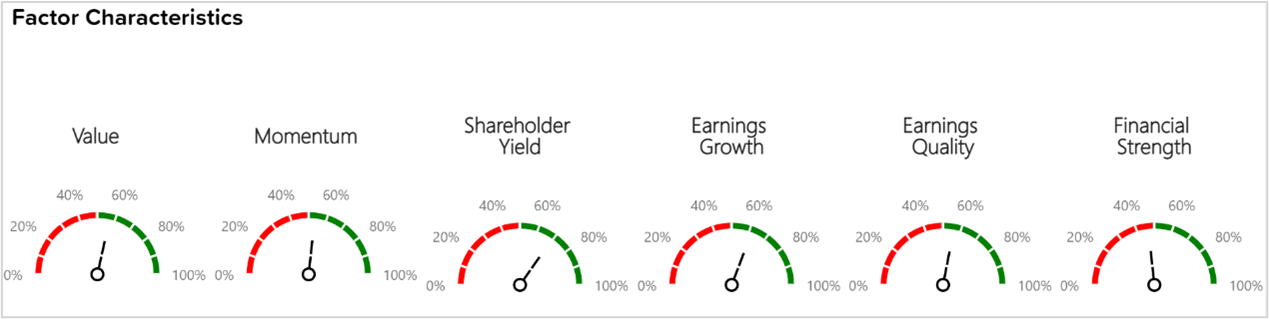
As designed, such a machine would have a great many dials (like radio dials) upon its front panel, each labeled for some of the controlling factors... Once each week or month an attendant would set each of these dials with their pointers indicating the latest figures of each series... That not one, but many such machines will be built in the course of time and put in operation, seems inevitable."
What Karsten describes in that last paragraph is not unlike the factor characteristics page on OSAM’s Canvas® performance portal:
INVESTING TODAY
Each of the examples covered in this post illustrate the familiar progression of technological advancements producing an abundance of information, which requires further technological innovations and new systems to analyze and synthesize this data.
Now more than ever we are swimming in a sea of information. So much so that this era has been coined The Age of Information, and it is frequently stated that “data is the new oil”. In this environment there are an increasing number of tools and innovations designed to generate insights from the abundance of data available, and technology helps leverage these insights into actionable steps.
At OSAM, we pride ourselves in following a similar approach to the steps laid out by Karl Karsten almost a century ago. Determine the factors that influence financial outcomes, construct a robust research platform containing normalized data for each factor, and implement the efficacious factors into live-time investment strategies rooted in quantitative processes.
Innovations in technology have enabled us to take our analytical insights and data platform to the next level by offering a software-based interface designed to build customized portfolios for every client. In 1931 Karsten predicted a future in which “very large machines” would use data analysis to construct investment strategies that could be altered and tailored with “dials” representing different factors.
Canvas is our version of what Karsten described, but instead of a very large machine it is a slick and intuitive web-based platform complete with dozens of dials and switches that can be utilized for customizing portfolios. Karsten was on to something in 1931 with his writing of math-based prediction machines, and we believe we are at the frontier of a new era in asset and wealth management powered by technology, software, and data.
FOOTNOTES
1 Eltjo Buringh and Jan Luiten Van Zanden, “Charting the ‘Rise of the West’: Manuscripts and Printed Books in Europe, a Long-Term Perspective from the Sixth through Eighteenth Centuries”, The Journal of Economic History (June 2009)
2 “Hang on Lads, I’ve Got an Idea”, The Economist (December 1999)
3 "7 Ways the Printing Press Changed the World", History.com (August 2019)
4 “Information Overload is Nothing New”, The Economist (June 2018)
5 Sereno S. Pratt, The Work of Wall Street, (New York, 1903)
6 Ibid.
7 Bob Pisani, "Plundered by Harpies: An Early History of High-Speed Trading", Museum of American Finance (Fall 2014)
8 Pratt, Work of Wall Street
9 Ibid.
10 Karsten, Karl G., Scientific Forecasting: Its Methods and Application to Practical Business and to Stock Market Operations. (New York, 1931)
11 Jason Zweig, "LESSONS FOR 2017 FROM A MAN WHO ‘CALLED’ THE CRASH OF 1929", JasonZweig.com, (October 2017)
12 Karsten, Scientific Forecasting
GENERAL LEGAL DISCLOSURES & HYPOTHETICAL AND/OR BACKTESTED RESULTS DISCLAIMER
The material contained herein is intended as a general market commentary. Opinions expressed herein are solely those of O’Shaughnessy Asset Management, LLC and may differ from those of your broker or investment firm.
Please remember that past performance may not be indicative of future results. Different types of investments involve varying degrees of risk, and there can be no assurance that the future performance of any specific investment, investment strategy, or product (including the investments and/or investment strategies recommended or undertaken by O’Shaughnessy Asset Management, LLC), or any non-investment related content, made reference to directly or indirectly in this piece will be profitable, equal any corresponding indicated historical performance level(s), be suitable for your portfolio or individual situation, or prove successful. Due to various factors, including changing market conditions and/or applicable laws, the content may no longer be reflective of current opinions or positions. Moreover, you should not assume that any discussion or information contained in this piece serves as the receipt of, or as a substitute for, personalized investment advice from O’Shaughnessy Asset Management, LLC. Any individual account performance information reflects the reinvestment of dividends (to the extent applicable), and is net of applicable transaction fees, O’Shaughnessy Asset Management, LLC’s investment management fee (if debited directly from the account), and any other related account expenses. Account information has been compiled solely by O’Shaughnessy Asset Management, LLC, has not been independently verified, and does not reflect the impact of taxes on non-qualified accounts. In preparing this report, O’Shaughnessy Asset Management, LLC has relied upon information provided by the account custodian. Please defer to formal tax documents received from the account custodian for cost basis and tax reporting purposes. Please remember to contact O’Shaughnessy Asset Management, LLC, in writing, if there are any changes in your personal/financial situation or investment objectives for the purpose of reviewing/evaluating/revising our previous recommendations and/or services, or if you want to impose, add, or modify any reasonable restrictions to our investment advisory services. Please Note: Unless you advise, in writing, to the contrary, we will assume that there are no restrictions on our services, other than to manage the account in accordance with your designated investment objective. Please Also Note: Please compare this statement with account statements received from the account custodian. The account custodian does not verify the accuracy of the advisory fee calculation. Please advise us if you have not been receiving monthly statements from the account custodian. Historical performance results for investment indices and/or categories have been provided for general comparison purposes only, and generally do not reflect the deduction of transaction and/or custodial charges, the deduction of an investment management fee, nor the impact of taxes, the incurrence of which would have the effect of decreasing historical performance results. It should not be assumed that your account holdings correspond directly to any comparative indices. To the extent that a reader has any questions regarding the applicability of any specific issue discussed above to his/her individual situation, he/she is encouraged to consult with the professional advisor of his/her choosing. O’Shaughnessy Asset Management, LLC is neither a law firm nor a certified public accounting firm and no portion of the newsletter content should be construed as legal or accounting advice. A copy of the O’Shaughnessy Asset Management, LLC’s current written disclosure statement discussing our advisory services and fees is available upon request
The risk-free rate used in the calculation of Sortino, Sharpe, and Treynor ratios is 5%, consistently applied across time
The universe of All Stocks consists of all securities in the Chicago Research in Security Prices (CRSP) dataset or S&P Compustat Database (or other, as noted) with inflation-adjusted market capitalization greater than $200 million as of most recent year-end. The universe of Large Stocks consists of all securities in the Chicago Research in Security Prices (CRSP) dataset or S&P Compustat Database (or other, as noted) with inflation-adjusted market capitalization greater than the universe average as of most recent year-end. The stocks are equally weighted and generally rebalanced annually
Hypothetical performance results shown on the preceding pages are backtested and do not represent the performance of any account managed by OSAM, but were achieved by means of the retroactive application of each of the previously referenced models, certain aspects of which may have been designed with the benefit of hindsight
The hypothetical backtested performance does not represent the results of actual trading using client assets nor decision-making during the period and does not and is not intended to indicate the past performance or future performance of any account or investment strategy managed by OSAM. If actual accounts had been managed throughout the period, ongoing research might have resulted in changes to the strategy which might have altered returns. The performance of any account or investment strategy managed by OSAM will differ from the hypothetical backtested performance results for each factor shown herein for a number of reasons, including without limitation the following:
- Although OSAM may consider from time to time one or more of the factors noted herein in managing any account, it may not consider all or any of such factors. OSAM may (and will) from time to time consider factors in addition to those noted herein in managing any account.
- OSAM may rebalance an account more frequently or less frequently than annually and at times other than presented herein.
- OSAM may from time to time manage an account by using non-quantitative, subjective investment management methodologies in conjunction with the application of factors.
- The hypothetical backtested performance results assume full investment, whereas an account managed by OSAM may have a positive cash position upon rebalance. Had the hypothetical backtested performance results included a positive cash position, the results would have been different and generally would have been lower.
- The hypothetical backtested performance results for each factor do not reflect any transaction costs of buying and selling securities, investment management fees (including without limitation management fees and performance fees), custody and other costs, or taxes – all of which would be incurred by an investor in any account managed by OSAM. If such costs and fees were reflected, the hypothetical backtested performance results would be lower.
- The hypothetical performance does not reflect the reinvestment of dividends and distributions therefrom, interest, capital gains and withholding taxes.
- Accounts managed by OSAM are subject to additions and redemptions of assets under management, which may positively or negatively affect performance depending generally upon the timing of such events in relation to the market’s direction.
- Simulated returns may be dependent on the market and economic conditions that existed during the period. Future market or economic conditions can adversely affect the returns.


