The Dangers of Indexing in Canada
By OSAM Research Team
February 2016
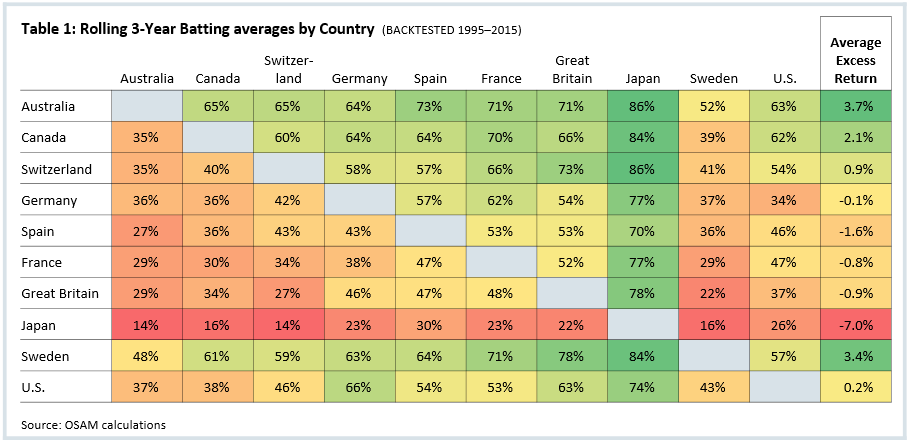
The Canadian market gets little attention and is rarely a dedicated piece of an overall asset allocation outside of Canada. But for the past two decades, it has been one of the most consistent-performing developed markets in the world (see Table 1 below).
Over this 20-year time period from 1995–2015, Canada has presented both strong absolute returns relative to other developed markets as well as a more robust alpha opportunity for active managers. For example, Canada has beaten Japan and France 84 percent and 70 percent of the time in any rolling three-year period. Even more telling, the average excess return of Canada relative to the peer group over all rolling time frames is 2.1 percent. Contrary to popular belief, the U.S. is not infallible. Canada even has a winning record against the U.S. with a winning percentage of 62 percent in any three-year period.
Within the institutional money management sphere many believe that you are better off going passive in the most efficient markets. We will take a look at the S&P/TSX and highlight some of the reasons why we believe a passive approach in Canada is inferior to active management. Also, we will look at the active management space and highlight why the O’Shaughnessy All-Canadian Equity strategy is an effective complement to other active managers.
Is the Benchmark Too Risky?
When we analyze the TSX, we see the following characteristics:
- The index has less than 300 names and the top 10 names typically account for 30–35 percent of the weight;
- Approximately three-quarters of the benchmark is weighted to Financials, Energy, and Materials; and
- The benchmark allocation to the smallest three sectors—Utilities, Information Technology, and Health Care account for less weight than the top two names, the Royal Bank of Canada and Toronto Dominion Bank.
Given these characteristics one could conclude the TSX is in fact too risky due to concentration. We would like to go a step further and quantify risk and contrast it with other equity markets. In particular, we would like to quantify the risk associated with using a market-cap weighting scheme. A simple test would involve regressing the return of a cap-weighted benchmark like the S&P/TSX against the return of an equally-weighted universe. This model will enable us to show how much of risk is associated with the market and how much is attributable to stock-specific bets, as a result of the size weighting.
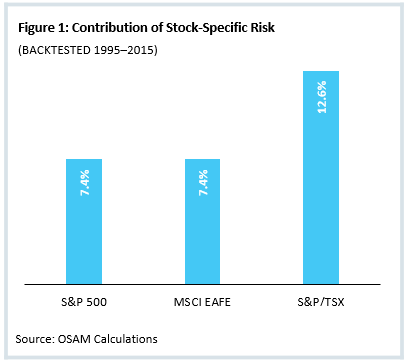 Figure 1 shows what percentage of total risk is attributable to stock-specific risk. Over the period from 1995 to 2015, stock-specific risk accounts for approximately 7.5 percent of the total risk for the S&P 500 and MSCI EAFE. That number jumps to approximately 12.6 percent for the S&P/TSX over the testing period. While in absolute terms a 5.2-percent difference may not seem like a lot, this does represent a 30-percent increase in stock-specific risk.
These results are not really surprising to us given some of the significant declines we have seen in heavily-weighted stocks within the S&P/TSX such as Blackberry, Valeant, and Bombardier. But, we would like to highlight some specific examples to illustrate our point.
Nortel Networks Corp. in 2000
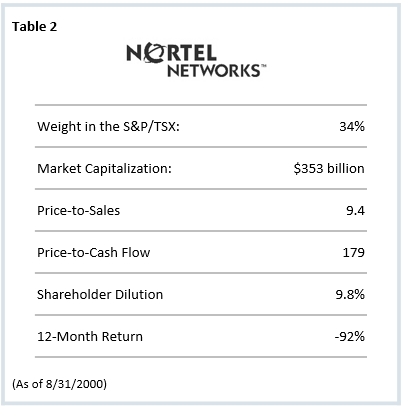
Nortel epitomized the Dot-Com era. At its height in August of 2000, Nortel represented approximately 34 percent of the S&P/TSX. The next largest company was Seagram, at only 2.9 percent of the benchmark. Nortel’s market capitalization was $353 billion and traded at 9.4x sales, 179x cash flow and was diluting existing shares holders by issuing 9.8 percent of new shares over the previous 12 months. These are staggering valuation metrics. Consider Nortel with cash flow from operations of approximately $1.3 billion, traded at a 526 percent premium to Walmart (which had $7.5 billion in cash flow). As well, typical of the era, Nortel had negative earnings of approximately $430 million.
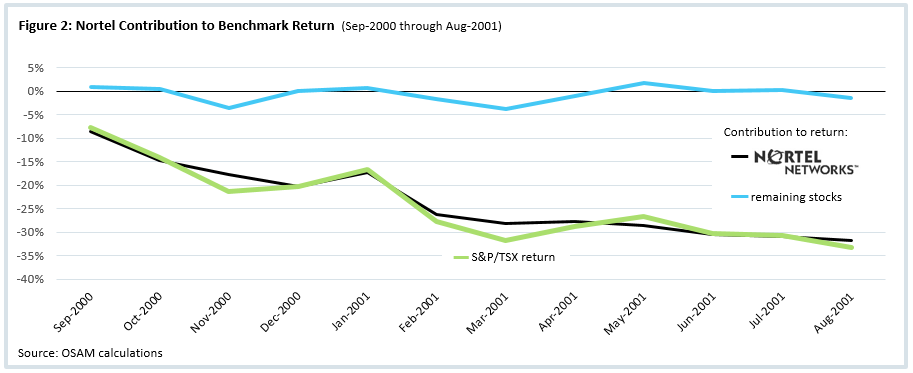
Over the next 12 months, as the dot-com bubble burst, Nortel fell 92 percent, which accounted for 97 percent (32 percent) of the 33-percent decline for the TSX (see Figure 2 on the next page). The story of Nortel did not end well. In 2003, Nortel’s reputation took a further hit with an accounting scandal that led to the firing of several top executives including the CEO. Finally, in 2009 Nortel filed for bankruptcy protection and was delisted from the exchange by mid-year with various pieces of the company being sold off shortly after.
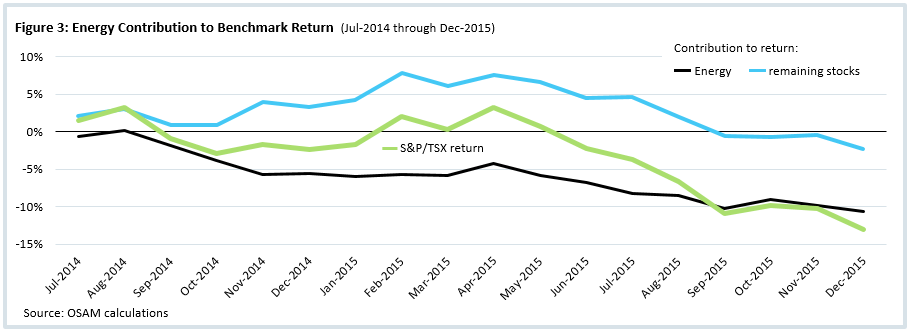
Oil’s Decline in 2014–2015
The price of oil peaked on July 1, 2014 at $93.59/Barrel. From that time to the end of 2015, oil has declined 59 percent to $38/barrel, reaching a low of $27.94 on February 9, 2016. The benchmarks exposure to oil has never been more apparent than the past 18 months. From the time of peak oil to the end of 2015, the Canadian energy sector returned -42 percent (detracting 10.3 percent), or 74 percent of the -13.9 percent return for the S&P/TSX.
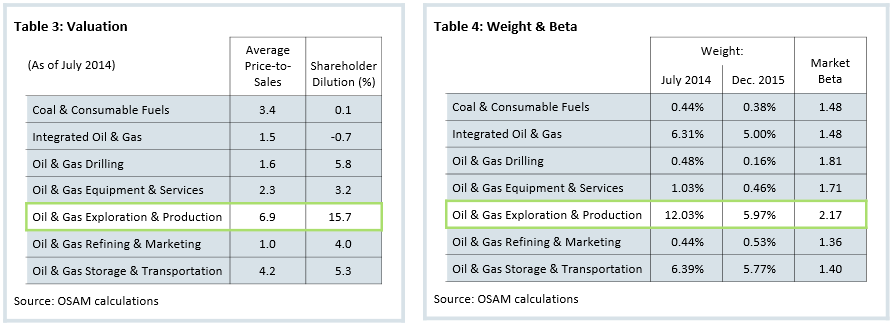
As of July 2014, the Oil & Gas Exploration & Production industry was trading on average 6.9x sales and issuing 15.7 percent new shares to fund operations and expansion, diluting existing shareholders. Unlike the U.S. market which has a larger weight to more conservative Integrated Oil & Gas giants, Canada has a significant skew towards the Oil & Gas Exploration & Production industry. At peak oil price in mid-2014, this weight represented 12 percent of the benchmark or 44 percent of the Energy sector weight. Today, the weight in Exploration & Production has reduced significantly but is still the largest (6 percent), with a beta to the market of 2.17 representing a significant portion of total risk (see Tables 3 and 4 on the next page).
Benchmarks only consider market capitalization when weighting stocks. We think this is particularly problematic in Canada as evidenced by stock-specific risk accounting for a higher part of total risk relative to the rest of the developed world. As well, the above examples highlight two key instances where a simple cap-weighting scheme can introduce significant risk in such a narrow market.
Active Management Landscape
The obvious place for investors to turn to access the Canadian market and avoid the idiosyncrasies around the benchmark are active managers. Unfortunately, Canada qualifies as the world leader for closet indexers with approximately 37 percent of total assets being represented by active managers with an active share below 60 percent.1Even more disconcerting, according to the study, is that the total shareholders costs in closet-indexed funds are on average 2.11 percent—relative to only 0.42 percent for their explicitly indexed counterparts. Many active managers would site Canada’s relatively narrow and illiquid market relative to the rest of the world, where the index is disproportionately allocated to banks and energy as the main reason for low Active Share.
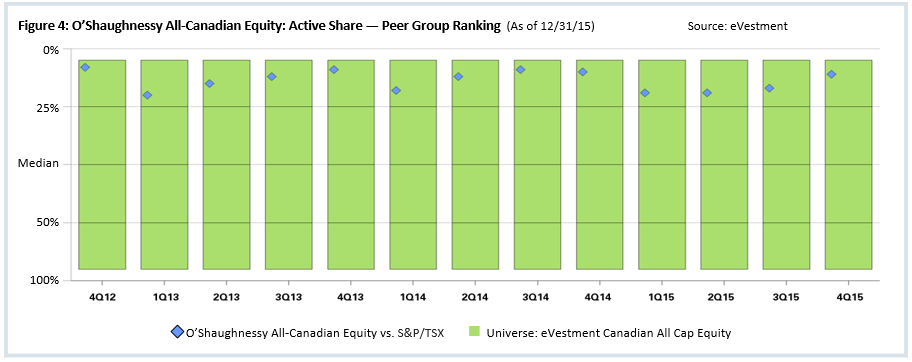
Looking at Active Share peer group ranking data for the O’Shaughnessy All-Canadian Equity strategy vs. the S&P/TSX since 2012 illustrates how different the strategy’s positioning has been over time—consistently ranking in the top quartile.
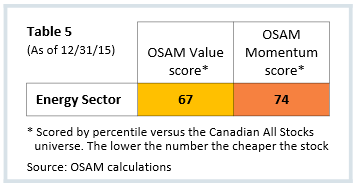
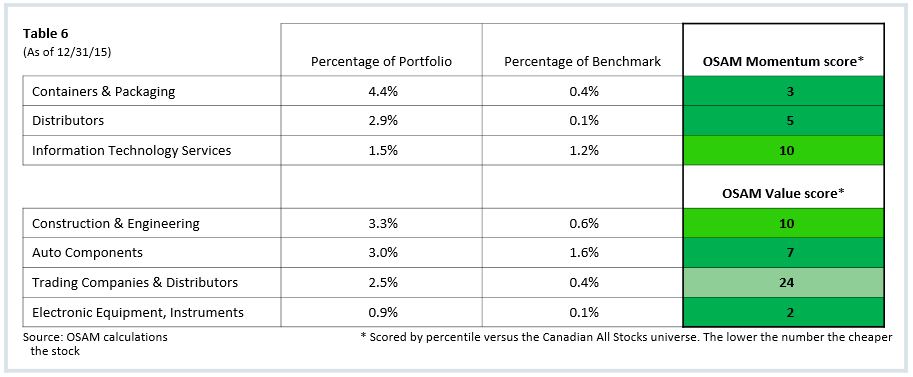
Looking like the benchmark in Canada provides strategy capacity, but can significantly deteriorate the ability to generate alpha. For example, Canadian energy stocks look out of favor according to the key drivers of our process—valuation and momentum. The OSAM Value and OSAM Momentum scores indicate the average energy company ranks in the bottom third of the market according to these metrics. Allocating based on size can lead you to overweighting stocks with poor characteristics that tend to under-perform over the long run. We believe a sound investment process should be disciplined but also nimble— constantly re-evaluating the opportunity set for the highest ranking stocks. A catalyst for the portfolio to shift towards oil stocks would be a positive upward trend in earnings and momentum, which would be dependent on an upward price movement in oil.
Another major difference between our offering and other active managers’ is the overweight to Consumer Discretionary and Industrials sectors. Again, the drivers of these allocations are valuation and momentum. These factors have led the portfolio to overweight export oriented industries, primarily within consumer discretionary and Industrials. We find the portfolio has a +14-percent active allocation to these industries due to their valuation and momentum characteristics.
All active managers are not created equal. We must admit there are managers who are able to deliver consistent alpha while tilting away from the benchmark. Our process and philosophy are factor-driven, as such we allow the factors to drive portfolio allocations causing us to look different from the benchmark and our peers as evidenced by the active share peer rankings. We believe our approach lends itself as a standalone Canadian equity manager well as an ideal complement to other money managers given its unique positioning over time.
CONCLUSION
The Canadian market has performed very well, but investing in Canada via market cap-weighted indexes can introduce unnecessary risks.
We believe the active management space is a better way to invest in Canada. However, investors should be leery of managers charging active fees but look very much like the benchmark. A closet indexing approach, while providing scale, suffers from many of the same issues inherent in market cap-weighted benchmarks.
The O’Shaughnessy All-Canadian equity strategy provides investors with a time-tested approach to investing based on proven factors that looks very different from the benchmark and our peers.
Our research leads us to believe that value, momentum, and quality are themes that are critically important to future outperformance. These themes dictate portfolio allocations that avoid areas of the market that exhibit unfavorable characteristics. A broad index will own everything and in many instances significantly overweight companies that have poor valuations, momentum and quality. Historically, Canadian stocks with the cheapest valuations provide an additional +6.6 percent of return relative to the market, while stocks with the highest momentum add an additional +8.0 percent. Given the portfolio’s positioning relative to its benchmark — measured by key characteristics we use in our stock selection process—we believe the portfolio is well positioned for the long run.
Footnotes:
1See Cremers, Martijn and Ferreira, Miguel A. and Matos, Pedro P. and Starks, Laura T., “Indexing and Active Fund Management: International Evidence” (2/1/15) http://ssrn.com/abstract=2558724
General Legal Disclosures & Hypothetical and/or Backtested Results Disclaimer
The material contained herein is intended as a general market commentary. Opinions expressed herein are solely those of O’Shaughnessy Asset Management, LLC and may differ from those of your broker or investment firm.
It should not be assumed that your account holdings correspond directly to any comparative indices. Individual accounts may experience greater dispersion than the composite level dispersion (which is an asset weighted standard deviation of the accounts in the composite for the full measurement period). This is due a variety of factors, including but not limited to, the fresh start investment approach that OSAM employs and the fact that each account has its own customized re-balance frequency. Over time, dispersion should stabilize and track more closely to the composite level dispersion. Gross of fee performance computations are reflected prior to OSAM’s investment advisory fee (as described in OSAM’s written disclosure statement), the application of which will have the effect of decreasing the composite performance results (for example: an advisory fee of 1% compounded over a 10-year period would reduce a 10% return to an 8.9% annual return). Portfolios are managed to a target weight of 3% cash. Account information has been compiled by OSAM derived from information provided by the portfolio account systems maintained by the account custodian(s), and has not been independently verified. In calculating historical asset class performance, OSAM has relied upon information provided by the account custodian or other sources which OSAM believes to be reliable. OSAM maintains information supporting the performance results in accordance with regulatory requirements. Please remember that different types of investments involve varying degrees of risk, that past performance is no guarantee of future results, and there can be no assurance that any specific investment or investment strategy (including the investments purchased and/or investment strategies devised and/or implemented by OSAM) will be either suitable or profitable for a prospective client’s portfolio. OSAM is a registered investment adviser with the SEC and a copy of our current written disclosure statement discussing our advisory services and fees continues to remain available for your review upon request.
Hypothetical performance results shown on the preceding pages are backtested and do not represent the performance of any account managed by OSAM, but were achieved by means of the retroactive application of each of the previously referenced models, certain aspects of which may have been designed with the benefit of hindsight.
The hypothetical backtested performance does not represent the results of actual trading using client assets nor decision-making during the period and does not and is not intended to indicate the past performance or future performance of any account or investment strategy managed by OSAM. If actual accounts had been managed throughout the period, ongoing research might have resulted in changes to the strategy which might have altered returns. The performance of any account or investment strategy managed by OSAM will differ from the hypothetical backtested performance results for each factor shown herein for a number of reasons, including without limitation the following:
- Although OSAM may consider from time to time one or more of the factors noted herein in managing any account, it may not consider all or any of such factors. OSAM may (and will) from time to time consider factors in addition to those noted herein in managing any account.
- OSAM may rebalance an account more frequently or less frequently than annually and at times other than presented herein.
- OSAM may from time to time manage an account by using non-quantitative, subjective investment management methodologies in conjunction with the application of factors.
- The hypothetical backtested performance results assume full investment, whereas an account managed by OSAM may have a positive cash position upon rebalance. Had the hypothetical backtested performance results included a positive cash position, the results would have been different and generally would have been lower.
- The hypothetical backtested performance results for each factor do not reflect any transaction costs of buying and selling securities, investment management fees (including without limitation management fees and performance fees), custody and other costs, or taxes – all of which would be incurred by an investor in any account managed by OSAM. If such costs and fees were reflected, the hypothetical backtested performance results would be lower.
- The hypothetical performance does not reflect the reinvestment of dividends and distributions therefrom, interest, capital gains and withholding taxes.
- Accounts managed by OSAM are subject to additions and redemptions of assets under management, which may positively or negatively affect performance depending generally upon the timing of such events in relation to the market’s direction.
- Simulated returns may be dependent on the market and economic conditions that existed during the period. Future market or economic conditions can adversely affect the returns.


