The Economy and the Stock Market
By Patrick O’Shaughnessy
September 2010
“THE MOST COMMON CAUSE OF LOW PRICES IS PESSIMISM—SOMETIMES PERVASIVE, SOMETIMES SPECIFIC TO A COMPANY OR INDUSTRY. WE WANT TO DO BUSINESS IN SUCH AN ENVIRONMENT, NOT BECAUSE WE LIKE PESSIMISM BUT BECAUSE WE LIKE THE PRICES IT PRODUCES. IT’S OPTIMISM THAT IS THE ENEMY OF THE RATIONAL BUYER."
WARREN BUFFETT
The stock market has been a disappointment for investors so far this year. As of September 13, 2010 the S&P 500 is up 2.04 percent for the year, but the ride has been a choppy one—including a 15 percent correction from the April highs. Fund flow data reveals an ongoing aversion to equities, with $575 billion entering the perceived safety of U.S. bond funds and $73 billion flowing out of equity mutual funds since January 2009.1 Coincident with this weak stock performance has been a plethora of bad economic news and indicators of economic stagnation. Unemployment has not budged, remaining at levels we have not seen for a quarter century. No one knows where the new jobs will come from and Gross Domestic Product (GDP) growth has been anemic, with the latest revisions going in the wrong direction. To top it off, consumer confidence remains low and there is a large looming tax increase for income, dividends, and capital gains that also threatens the future wealth of U.S. investors.
It is understandable that fears about the economy influence investing decisions. After all, it would seem that the fate of the stock market should be tied to the fate of the U.S. economy.
A recent article in The Wall Street Journal does a good job summarizing the current market sentiment:
“Investors eager to see the market’s upside potential are having to squint harder to find it.”
“Now, even optimistic investors seem to be settling in for what they are calling an ‘extended pause’ in the recovery. They worry than an economy on hold could keep the market trapped in its trading range or drag it down further, adding more losses to the benchmark indexes’ year-to-date declines.” 2
Then, echoing the less than prescient Business Week cover in 1979 proclaim-ing the “Death of Equities,” the Financial Times ran a story discussing the end of the “cult of equities:”
“An increasing number of market professionals are asking themselves if the brutal de-rating suffered by equities during the past decade means the cult of equity is dying. Certainly investors have fallen out of love with equities.”3
In the face of so much grim economic news and uncertainty about the future, we believe that the most rational approach to facing tough portfolio allocation decisions is to look for similar periods of economic malaise and see if they were opportune or inopportune times to invest in the stock market. Fortunately, we have a very long economic data set, with unemployment and GDP numbers since 1900 and tax rates since 1913. By comparing unemployment levels, GDP growth rates, and marginal tax rates in the past with subsequent equity returns, we can address several of the most pressing fears facing investors today. In this article we will examine the relationship between these economic variables and future stock returns. The data suggests that while worries about the economy are legitimate, those fears do not necessarily translate into weak prospects for stocks. While economic variables are not good indicators of future stock returns, the market’s Price-to-Earnings (P/E) ratio has been a good indicator in the past and it continues to suggest the market is a good buy today.
Economic Growth vs. Portfolio Growth
According to a recent Gallup Poll,4 Americans believe the overall economy is the most important issue facing this country today. GDP is typically the metric used to evaluate economic growth—and it has been underwhelming lately. The growth rate coming out of the 2008 contraction—which was the worst in percentage terms since the Great Depression—has been alarmingly low relative to other post contraction growth rates. Americans hoped that we would see recovery growth rates similar to those Germany and other countries are enjoying, but have not been so lucky. If the fund flow data already mentioned is any indication, the weak economic rebound and resulting negative view of the economy has impacted the average investors’ portfolio allocation away from equities.
We are particularly interested in the year-over-year GDP growth rate and the historical implications of different levels of growth (and contraction) on future real stock market returns.
Data for U.S. GDP in constant 1996 dollars comes from Global Financial Data and is available annually from 1900 through 1946 and quarterly thereafter. For monthly stock returns over the same period we use data on U.S. stocks from William Goetzmann of Yale University (for 1900 through 1926) and from Roger Ibbotson (1926 to present). Both are in real (inflation adjusted) terms.
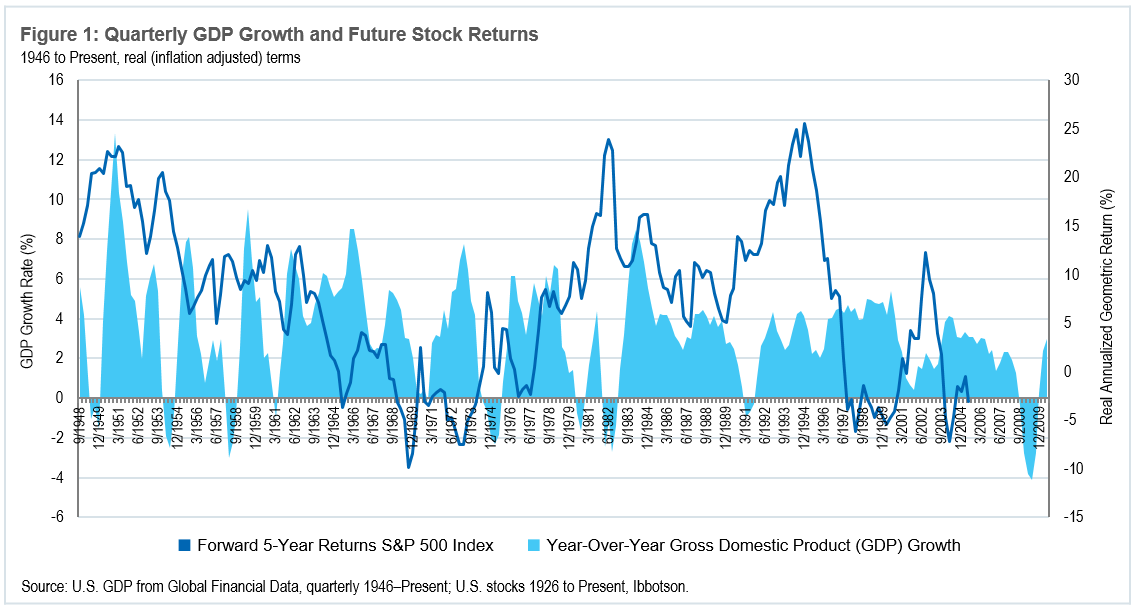
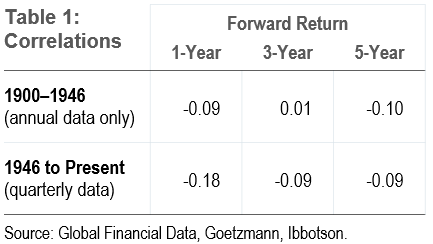
Of course, economic growth is a good thing, but the evidence suggests that higher current growth rates do not mean our equity portfolios will be successful over the next one to five years. The Table 1 correlation below illustrates the lack of any predictive or actionable relationship between economic growth and stock market returns. In fact, if there is any helpful relationship it is a contrarian one, where the best time to invest in the stock market is when the economy is contracting.
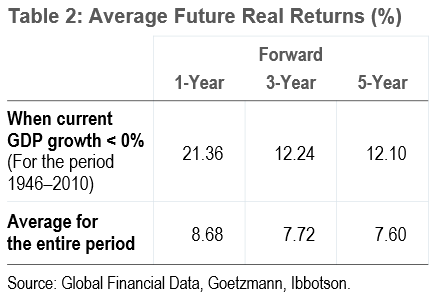
The average future returns of the stock market when the current GDP growth rate is negative are significantly higher than the average stock returns over the entire period (see Table 2).
These findings are consistent with several other studies that have found weak relationships between economic growth and equity rates of return.5 The simplest explanation for this phenomenon revolves around expectations and market valuation. Because of low expectations and fears about the future, during periods of contraction, the stock market becomes consider-ably cheaper based on the P/E ratio and similar measures. We know that fear in these cases actually creates opportunity as stock market performance is very strong following periods when the P/E ratio is low. The market P/E ratio is a great proxy for current expectations because it discounts future growth, so naturally stocks are cheapest during times of economic fear. People tend to extrapolate current conditions too far into the future and, in so doing, fail to discount strong earnings growth rates coming out of recessions into the price of the market.
Jobs and the Stock Market
Second on the list of most pressing concerns in the latest Gallup Poll is unemployment. Official unemployment is lingering at 9.6 percent while total unemployment, which also includes part time workers who would prefer full time jobs and those who have stopped looking for work altogether, remains extremely high at 16.7 percent.
Data for U.S. unemployment comes from Global Financial Data and is available annually from 1900 through 1929 and monthly thereafter.
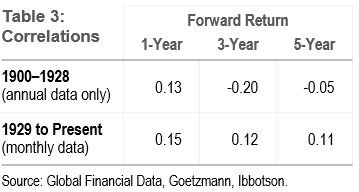
Again, our analysis indicates that high levels of unemployment—an economic negative—are not a sign of weak stock returns in the future. The correlations between unemployment rates and future stock returns are shown below and, similar to GDP, these very low correlations imply that the unemployment level is not usually helpful for predicting stock returns. It is interesting that since 1929, the period for which we have monthly data, high unemployment is positively correlated with high, not low, future returns (see Table 3).
Roughly 11 percent of the historical monthly observations had an unemployment level as high or higher than the current 9.6 percent, but the future returns following these periods, on average, does not create concern for stocks. Compared with long-term averages, the forward one-, three-, and five-year returns following these high periods of unemployment are very similar and superior over two of the three horizons (see highlight in Table 4).
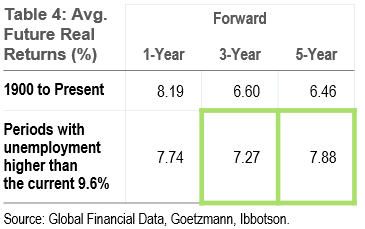
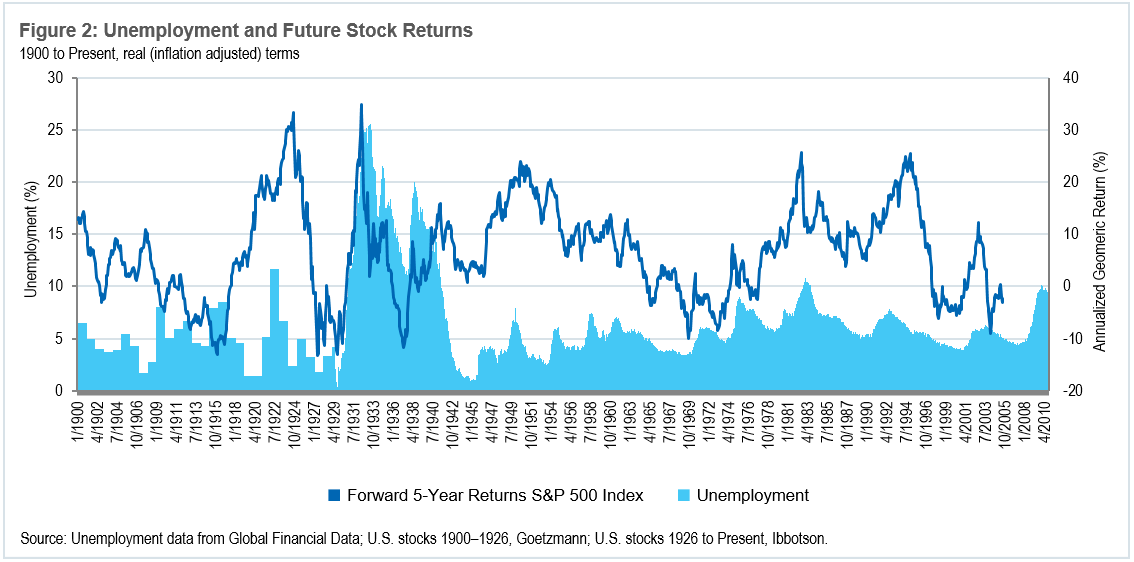
Figure 2 below reveals a pattern of very strong future stock returns following major peaks in unemployment. As a well-documented lagging indicator, this is no surprise. But it still serves as a good reminder that we should not let unemployment numbers scare us away from stocks.
Taxes and Consumer Confidence
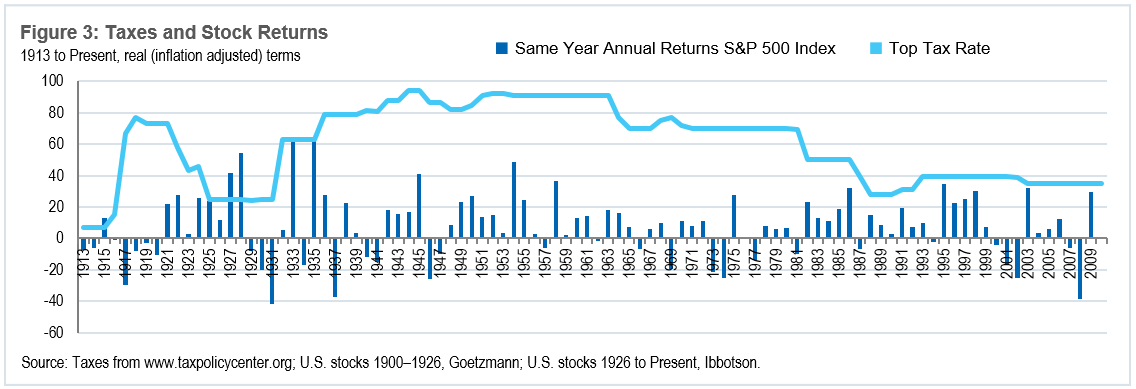
Since the creation of the income tax in 1913, the top marginal tax rate has varied between 7 percent and 94 percent, with an annual average rate of 61 percent. With the Bush tax cuts possibly expiring at the end of this year, many are concerned about the impact these tax increases will have on economic growth. Potential economic fallout aside, we are more concerned with the influence of taxes on stock returns. Based on the data, we can say conclusively that the tax rate in any given year has not affected stock returns in that year. The correlation between the top marginal tax rate and the return of the S&P 500 in the same year is 0.04.
As an example of the weak relationship between taxes and stock returns, the average annual real return for the S&P 500 during the 1950’s (when tax rates were the highest) was +16.7 percent, whereas the average annual return during the 2000’s (when tax rates were among the lowest) was -0.8 percent. We do not mean to suggest that higher tax rates are a good thing—seeing as how the correlations are close to zero—only that there have clearly been extreme periods of taxation which have not significantly affected the stock market. (See Figure 3.)
The Consumer Confidence Index is calculated based on a monthly survey of 5,000 households that measures consumer opinions on business condi-tions, income expectations, spending and saving activity. The assumption is that higher levels of spending correspond to higher confidence in a bright economic future and vice versa. Less take home pay as a result of higher taxes could therefore affect the consumer confidence indicator.
Consumer confidence may be more of a measure of sentiment than an economic fundamental, but it is worth mentioning because it has the strongest apparent relationship with future stock returns of any variable addressed in this article.
The index has been maintained since 1952 and currently sits near its lowest historical levels. The current reading is at the eleventh percentile of all historical observations, meaning consumers are very wary about the future. The correlations between the current consumer confidence level and subsequent stock returns are -0.02, -0.11, and -0.37 for forward one-, three-, and five-year stock returns respectively.
These results demonstrate, particularly over a five-year horizon, that weak confidence has been a very strong sign of opportunity in stocks whereas high levels of confidence are a weak indicator. (See Table 5.)

Thus, our current relative position on the historical consumer confidence scale is quite bullish for stock returns over the next five years. We find it quite appropriate that of all the variables analyzed, the one most reliant on investors’ expectations is the most useful for predicting stock returns. This is yet another situation where fear and uncertainty are the rational investor’s friends. The most predictive stock market indicators are dependent on fallible and emotional human opinions. Disciplined value investing works so well because it systematically invests in assets that have low embedded expectations. Because weak economic environments precipitate low expectations for the future, this can be a positive indicator for equity buyers.
Stock Selection Strategies that Work Following Recessions
Because most of these negative economic data points happen during— or shortly after—recessions, we tested a stock selection model which closely mimics our strategies at OSAM by systematically buying stocks that are cheap, high yielding, and that have strong recent price momentum.
Table 6 details a multi-factor strategy’s excess returns relative to the All Stocks universe following each of the fourteen recessions in our data set since 1926 as defined by the National Bureau of Economic Research. The strategy is constructed by selecting stocks whose Price-to-Book ratio and Shareholder Yield6 are greater than the median. It then chooses the 25 stocks with the best six-month Price Momentum.7
The results shown in Table 6 demonstrate that a simple multi-factor model which buys stocks based on OSAM’s favored characteristics does very well relative to the overall market coming out of recessions.
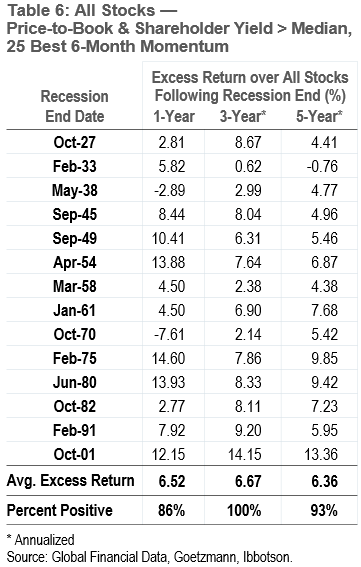
The results from the 1975 recession are particularly interesting because the economic situation looked as bad as—or in some cases worse than—it does today. GDP was contracting, unemployment was 9 percent, and top tax rates were 70 percent. These weak numbers were reflected in one of the worst consumer confidence readings in history. In the heat of the moment, faced with so much negativity, it required guts to invest in stocks. And yet over the next five years, the All Stocks universe was up 21.7 percent per year (annualized) and the multi-factor model was up over 31 percent per year (annualized).
Taking a Rational Approach to Investing Decisions
The natural emotional response to a weak economy and uncertainty about the future is one of conservatism. The dominant trade in 2010 has been out of stocks and into bonds, or looked at another way, away from risk and into apparent safety. The trouble with this investment decision is that for many it is based on what this research has found to be irrelevant data points. GDP growth, unemployment, taxes, and consumer sentiment all seem like they should matter for your portfolio, but 110 years of history says that they do not. The relationships between these sensitive economic variables and future equity returns are very weak and, if anything, contrarian.
Instead, we encourage investors to focus on metrics that are predictive such as P/E ratios, which remain in attractive territory. There has been a very strong inverse relationship between normalized8 P/E ratio and future returns, with correlations of -0.37 and -0.59 for future five- and ten-year returns, respectively. This means that when stocks are cheap, they tend to do very well over the next ten years, but when they are expensive they go on to do relatively poorly. These correlations, for the period 1956 to present, indicate that the more you pay, the less you get. The normalized P/E ratio for the S&P 500 remains in the cheapest one-third of observations dating back to 1956.9 There are ways to be more conservative and still invest in equities. A strategy such as our Enhanced Dividend that focuses on high-yielding global equities offers very attractive yields relative to bonds. The indicated annual yield on our Enhanced Dividend portfolio is currently 4.88 percent, dwarfing the 2.75 percent yield available in ten-year treasuries.10
As we have explored in previous commentaries, high-yielding stocks have typically been strong performers in similar market environments in the past. Above all, we believe that the flight to bonds is a huge and untimely mistake and that investors who are currently buying bonds and do not intend to hold them to maturity—or those who invest in bond indices like the Barclays Aggregate—will not enjoy the safety of principal they are seeking.
We encourage investors faced with a decision between a high-expectation asset (in this case, bonds for their safety and principle protection) and a low-expectation asset (in this case, equities) should always opt for the low-expectation option, as history suggests that this asset class will reap the greatest rewards in the future.
Footnotes:
1 Investment Company Institute.
2 “Investors Brace for ‘Extended Pause’” WSJ, 8/26/2010.
3 “On London: Killing the Cult of Equities” Financial Times, 9/3/2010.
4 http://www.gallup.com/poll/141275/economy-dominates-nation-important-problem.aspx
5 Dimson, Marsh Staunton; Jeremy Siegel.
6 Shareholder Yield is a combination of dividend yield and buyback yield.
7 CRSP; Fama/French.
8 The Leuthold Group defines normalized earnings as 5 years of earnings, adding trailing 18 quarters and 2 forecasted quarters.
9 The Leuthold Group.
10 Both as of 9/13/2010.
General Legal Disclosure/Disclaimer and Backtested Results
The material contained herein is intended as a general market commentary. Opinions expressed herein are solely those of O’Shaughnessy Asset Management, LLC and may differ from those of your broker or investment firm.
Please remember that past performance is no guarantee of future results. Different types of investments involve varying degrees of risk, and there can be no assurance that the future performance of any specific investment, investment strategy, or product made reference to directly or indirectly in this presentation, will be profitable, equal any corresponding indicated historical performance level(s), or be suitable for any portfolio. Gross of fee performance computations are reflected prior to OSAM’s investment advisory fee (as described in OSAM’s written disclosure statement), the application of which will have the effect of decreasing the composite performance results (for example: an advisory fee of 1% compounded over a 10-year period would reduce a 10% return to an 8.9% annual return). Due to various factors, including changing market conditions, the content may no longer be reflective of current opinions or positions. Moreover, you should not assume that any discussion or information contained in this presentation serves as the receipt of, or as a substitute for, individualized investment advice from OSAM. Historical performance results for investment indices and/or categories have been provided for general comparison purposes only, and generally do not reflect the deduction of transaction and/or custodial charges, the deduction of an investment management fee, nor the impact of taxes, the incurrence of which would have the effect of decreasing historical performance results. It should not be assumed that any account holdings would correspond directly to any comparative indices. Account information has been compiled solely by OSAM, has not been independently verified, and does not reflect the impact of taxes on non-qualified accounts. In preparing this presentation, OSAM has relied upon information provided by the account custodian and/or other third party service providers. OSAM is a Registered Investment Adviser with the SEC and a copy of our current written disclosure statement discussing our advisory services and fees remains available for your review upon request.
Hypothetical performance results shown on the preceding pages are backtested and do not represent the performance of any account managed by OSAM, but were achieved by means of the retroactive application of each of the previously referenced models, certain aspects of which may have been designed with the benefit of hindsight.
The hypothetical backtested performance does not represent the results of actual trading using client assets nor decision-making during the period and does not and is not intended to indicate the past performance or future performance of any account or investment strategy managed by OSAM. If actual accounts had been managed throughout the period, ongoing research might have resulted in changes to the strategy which might have altered returns. The performance of any account or investment strategy managed by OSAM will differ from the hypothetical backtested performance results for each factor shown herein for a number of reasons, including without limitation the following:
- Although OSAM may consider from time to time one or more of the factors noted herein in managing any account, it may not consider all or any of such factors. OSAM may (and will) from time to time consider factors in addition to those noted herein in managing any account.
- OSAM may rebalance an account more frequently or less frequently than annually and at times other than presented herein.
- OSAM may from time to time manage an account by using non-quantitative, subjective investment management methodologies in conjunction with the application of factors.
- The hypothetical backtested performance results assume full investment, whereas an account managed by OSAM may have a positive cash position upon rebalance. Had the hypothetical backtested performance results included a positive cash position, the results would have been different and generally would have been lower.
- The hypothetical backtested performance results for each factor do not reflect any transaction costs of buying and selling securities, investment management fees (including without limitation management fees and performance fees), custody and other costs, or taxes – all of which would be incurred by an investor in any account managed by OSAM. If such costs and fees were reflected, the hypothetical backtested performance results would be lower.
- The hypothetical performance does not reflect the reinvestment of dividends and distributions therefrom, interest, capital gains and withholding taxes.
- Accounts managed by OSAM are subject to additions and redemptions of assets under management, which may positively or negatively affect performance depending generally upon the timing of such events in relation to the market’s direction.
- Simulated returns may be dependent on the market and economic conditions that existed during the period. Future market or economic conditions can adversely affect the returns.


