The Factor Archives: A History of Factor Investing
By Jamie Catherwood
November 2019
While they may not have been known by the same names, many modern investment factors have historical roots stretching back centuries. This series, The Factor Archives, provides historical context on the six factor themes underlying OSAM’s investment process.

“Basic factor investing is settled territory. Most investors have been bludgeoned with countless strategies that use factors like value, momentum, quality, or low volatility. As William Gibson observed in Pattern Recognition, ‘commodification will soon follow identification.’ ... [The] next stage of factor investing: alpha within factors”
– Patrick O’Shaughnessy1
The history of active investing, stretching back thousands of years, can be summarized as the search for an ‘edge’. Generally, this is an informational, analytical, or operational edge. The hunt for an advantage is particularly competitive within the field of quantitative investing where factors drive models.
As a result, quantitative firms like OSAM focus most of their research on investment ‘factors’, or the characteristics of stocks that are most indicative of strong total and risk‐adjusted returns. At OSAM our process incorporates six factor themes: Value, Momentum, Shareholder Yield, Earnings Growth, Earnings Quality, and Financial Strength.
The identification of factors was an important milestone for the investment industry, but the market is becoming saturated with strategies offering basic and diluted exposure to popular factors like Value and Momentum. Amid these ubiquitous “smart beta” products, where is your edge? The threatening implications behind this question have prompted a dogged pursuit of alpha within factors by our Research Team. In an era when the basic factors could become commodities, the hunt for unique signals and factors represents an ever-expanding new frontier for quantitative investors.
This article is the first installment of The Factor Archives, an OSAM series looking at the past, present, and future of factor investing across the six factor themes underlying our process. This initial post will cover the historical precedents of systematic investing, and the lessons they provide for quantitative investors today.
EARLY SYSTEMATIC INVESTING
A new technology, the telescope, provided investors in 17th century Holland with a powerful edge. When the telescope hit markets in 1608, it allowed traders to monitor ships entering Dutch ports carrying commodities before anyone else. While this was a clear informational advantage, how the investors interpreted and utilized this information provided an even stronger analytical edge.2
Their systematic approach was simplistic by modern standards, but advanced for the time. Using the telescope, investors could reasonably conclude that ships sitting lower in the water signaled the vessel was being weighed down by a large supply of commodities, which would depreciate prices when sold on the market.
Identifying this information in advance was an advantage, as it allowed investors to place trades long before others received word of the new shipment.
The Dutch investors were utilizing a rudimentary systematic-factor model. They found a useful signal indicative of future commodity returns (price) and leveraged technology (the telescope) to execute their edge.
Despite the analytical and informational edge, the pricing signal’s short “half-life” was problematic. The information was only useful for a short timeframe, an issue that still plagues modern markets, with some High-Frequency Trading firms striving for an ‘edge’ lasting mere milliseconds. As signals with short half-lives get commoditized over time, we prefer relentlessly researching and testing signals with much longer half-lives. In our view, the key to developing a sustainable advantage is basing the ‘building blocks’ of an investment process on factors with a proven record of generating long-term outperformance.
SIGNAL DECAYS & EFFICACY
On the Dojima Rice Exchange in 18th century Japan, an investor named Yomiji Sumiya was forced to learn that relying on a single investment signal or factor is a risky venture.
Yomiji’s investment career began after Japanese officials loosened regulations on trading rice futures. Like the Dutch traders, Yomiji utilized the telescope to create a systematic process based upon his informational advantage. His intricate system was outlined in this original source from 1706:
“A minute after the rice exchange started the business of the day in Osaka, the [second] messenger wearing red hat and red gloves ran like a flying bird and arrived at Kuragari Pass... If he raised his left hand by 1 degree, it meant the rice price increased by 1 Bu of silver. If he raised his right hand by 1 degree, it meant the rice price decreased by 1 Bu of silver. His role was to inform Yomiji of the increases and decreases of rice prices. Yomiji saw the person’s signals from the second floor of the wholesale store using a telescope which had a range of 10 miles, and bought or sold rice taking these price changes into consideration. After that, Yomiji [publicly] dispatched the express messenger to Osaka to obtain the rice prices there. As Yomiji knew the rice prices earlier than anyone when the information was delivered to Kuragari Pass, there was not a single day that Yomiji did not make money." 3
Mystified by his consistently high returns, other merchants nicknamed him “Forecasting Yomiji”. Unfortunately for Yomiji, his streak would soon come to an end.
One day, as his messenger was running back from the rice exchange to signal that morning’s prices, he bumped into an old friend. The two of them decided to catch up over drinks at the local bar and proceeded to knock back 7–8 glasses of sake each.
Eventually, the messenger realized that he was four hours late to signal the rice data to Yomiji and sprinted out of the bar in a panic. When he finally arrived:
“The 7–8 glasses of sake greatly affected his memory, and he did not recall whether he should raise his left hand or right hand... Finally he raised his left hand by 6 degrees, and Yomiji bought 30,000 koku of rice, believing that the rice prices had increased by 6 bu of silver... Actually the rice price was down by 7–8 bu of silver.”4
Yomiji quickly learned that incorporating multiple factors or signals is key to a robust investment strategy (you never know when a factor will get a bit tipsy, or invert!). For even the most robust factors and signals will endure bouts of underperformance, like the Value factor in recent years.
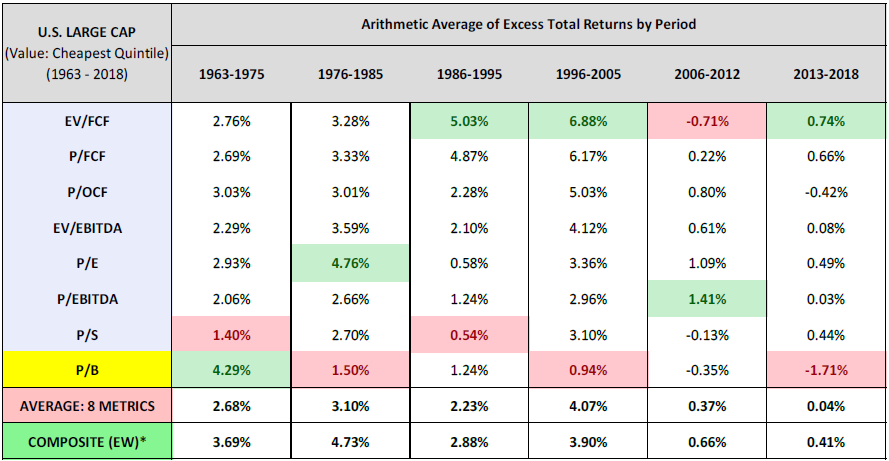
Today, the importance of utilizing multiple signals is applicable to both factors in general, but also the metrics on which they are evaluated. Value investing, for example, is a proven strategy for generating strong long-term investment results. There have been numerous metrics for measuring the Value factor, and some have lost their efficacy over time. Consider Book Value, the original metric for measuring a company’s “cheapness”. In the last two decades, accounting rules and structural changes to the market have reduced the efficacy of book value, and associated metrics like Price-to-Book (P/B). 5
For instance, companies that are considered expensive by book value standards can sometimes be cheap when measured by other metrics like earnings, sales, or cash flow. This implies that book value in its raw form has become relatively outdated, a point made by Warren Buffet, cult-hero of value investing:
“For almost three decades, the initial paragraph [of the annual letter] featured the percentage change in Berkshire’s per-share book value. It’s now time to abandon that practice.
The fact is that the annual change in Berkshire’s book value — which makes its farewell appearance on page 2 — is a metric that has lost the relevance it once had... First, Berkshire has gradually morphed from a company whose assets are concentrated in marketable stocks into one whose major value resides in operating businesses... Second... accounting rules require our collection of operating companies to be included in book value at an amount far below their current value... Third, it is likely that — over time — Berkshire will be a significant repurchaser of its shares... That combination causes the book-value scorecard to become increasingly out of touch with economic reality.” 6
This argument is supported by the data below, which demonstrates that the efficacy of P/B has clearly waned over time.7 In addition, the data proves that incorporating multiple factors- or a ‘composite’ of value metrics- outperforms the average value metric independently. In short, it is risky to rely on a single factor or signal to drive your investment process. No matter the time period.
PREDICTION MACHINES FOR ECONOMIC TIDES
Since the 17th and 18th centuries, the technology and data at an investor’s disposal have only become more plentiful and advanced. Consequently, an analytical edge is now arguably more important than an informational edge. When data is so readily available, it’s what one does with the data that truly matters. This fact was even apparent in 1931, as the author of Scientific Forecasting stated the objective of his book:
“The basis for this book is an investigation into the causes of certain aspects of and changes in economic conditions in the United States... Particular attention has been given to the possibility of so correctly identifying and evaluating the causes of economic conditions as to permit the making of successful forecasts.” 8
In yet another testament to the fact that there is ‘nothing new under the sun’, the author, Karl Karsten, had even identified the concept of ‘factor’ investing:9
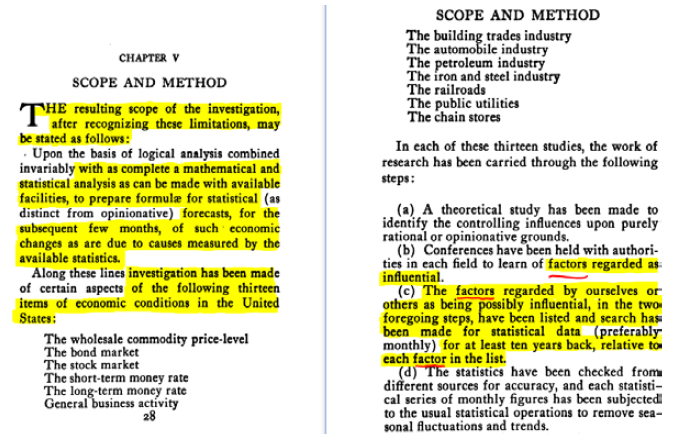
An early pioneer, he continued to describe an early quantitative model and platform for analyzing the vast quantities of data available to investors:
“There is no reason why, with the wealth of statistical data now available, several hundred series could not be studied by the economist for this purpose. Once the formulae are obtained, there is no reason why a machine should not be built to compute the economic forecasts mechanically... no reason why a single very large machine should not be made for the simultaneous calculation of a large number of predictions of different phases of business and financial conditions...
As designed, such a machine would have a great many dials (like radio dials) upon its front panel, each labeled for some of the controlling factors... Once each week or month an attendant would set each of these dials with their pointers indicating the latest figures of each series... That not one, but many such machines will be built in the course of time and put in operation, seems inevitable." 10 (1931)
Again, they recognized that with such abundant statistics, an informational edge became of secondary importance to an analytical edge.
THE PAST & FUTURE OF FACTOR INVESTING
Across multiple centuries, investors have developed and improved systematic approaches to investing reliant upon data and technology. From these historical roots, the world of factor-based investing has flourished as data and technology become more advanced and plentiful.
Today, quantitative investors use computer coded models instead of telescopes, and robust financial statistics instead of cargo ships entering Dutch ports. Despite these differences, however, the principles are the same, and leave us with three key lessons:
- Relying on a single factor or investment signal is risky. There will be periods where a single investment factor or signal will temporarily underperform. The performance of Value stocks over the past 12 years being a perfect example. It is for this reason that the OSAM Factor Model relies on a combination of our six core factor themes, so that we avoid becoming overly reliant on just one signal.
- A model is only as good as the underlying data. In both the Dutch and Japanese examples, the ‘model’ remained constant: the telescope. However, each scenario resulted in varying levels of success based upon the quality and reliability of the data that the telescope “received”.
- Use technology to gather and analyze data for making informed investment decisions. In an age of statistical abundance, the analytical edge is key to delivering better long-term investment results.
We will explore the roots of factor investing further in next week’s installment of The Factor Archives, which takes a deep dive on Shareholder Yield.
Appendix
1 O'Shaughnessy Quarterly Investor Letter - Q3 2018
2 Tools of the Trade: An Historical Look at Technology and Commerce
3 Kumagae Onna Amigasa (Kumagae Lady's Hat), written in 1706, translated by Mayuka Yamazaki
4 Ibid.
5 Travis Fairchild, ‘Negative Equity, Veiled Value, and the Erosion of Price-to-Book’, (April 2018)
6 Warren Buffett, ‘Letter to Shareholders of Berkshire Hathaway Inc.’, (February 2019)
7 Jesse Livermore+ (Pseudonym), ‘The Earnings Mirage: Why Corporate Profits are Overstated and What It Means for Investors’, (July 2019)
8 Karsten, Karl G., Scientific Forecasting: Its Methods and Application to Practical Business and to Stock Market Operations. (New York, 1931)
9 Ibid.
10 Ibid.
GENERAL LEGAL DISCLOSURES & HYPOTHETICAL AND/OR BACKTESTED RESULTS DISCLAIMER
The material contained herein is intended as a general market commentary. Opinions expressed herein are solely those of O’Shaughnessy Asset Management, LLC and may differ from those of your broker or investment firm.
Please remember that past performance may not be indicative of future results. Different types of investments involve varying degrees of risk, and there can be no assurance that the future performance of any specific investment, investment strategy, or product (including the investments and/or investment strategies recommended or undertaken by O’Shaughnessy Asset Management, LLC), or any non-investment related content, made reference to directly or indirectly in this piece will be profitable, equal any corresponding indicated historical performance level(s), be suitable for your portfolio or individual situation, or prove successful. Due to various factors, including changing market conditions and/or applicable laws, the content may no longer be reflective of current opinions or positions. Moreover, you should not assume that any discussion or information contained in this piece serves as the receipt of, or as a substitute for, personalized investment advice from O’Shaughnessy Asset Management, LLC. Any individual account performance information reflects the reinvestment of dividends (to the extent applicable), and is net of applicable transaction fees, O’Shaughnessy Asset Management, LLC’s investment management fee (if debited directly from the account), and any other related account expenses. Account information has been compiled solely by O’Shaughnessy Asset Management, LLC, has not been independently verified, and does not reflect the impact of taxes on non-qualified accounts. In preparing this report, O’Shaughnessy Asset Management, LLC has relied upon information provided by the account custodian. Please defer to formal tax documents received from the account custodian for cost basis and tax reporting purposes. Please remember to contact O’Shaughnessy Asset Management, LLC, in writing, if there are any changes in your personal/financial situation or investment objectives for the purpose of reviewing/evaluating/revising our previous recommendations and/or services, or if you want to impose, add, or modify any reasonable restrictions to our investment advisory services. Please Note: Unless you advise, in writing, to the contrary, we will assume that there are no restrictions on our services, other than to manage the account in accordance with your designated investment objective. Please Also Note: Please compare this statement with account statements received from the account custodian. The account custodian does not verify the accuracy of the advisory fee calculation. Please advise us if you have not been receiving monthly statements from the account custodian. Historical performance results for investment indices and/or categories have been provided for general comparison purposes only, and generally do not reflect the deduction of transaction and/or custodial charges, the deduction of an investment management fee, nor the impact of taxes, the incurrence of which would have the effect of decreasing historical performance results. It should not be assumed that your account holdings correspond directly to any comparative indices. To the extent that a reader has any questions regarding the applicability of any specific issue discussed above to his/her individual situation, he/she is encouraged to consult with the professional advisor of his/her choosing. O’Shaughnessy Asset Management, LLC is neither a law firm nor a certified public accounting firm and no portion of the newsletter content should be construed as legal or accounting advice. A copy of the O’Shaughnessy Asset Management, LLC’s current written disclosure statement discussing our advisory services and fees is available upon request.
Hypothetical performance results shown on the preceding pages are backtested and do not represent the performance of any account managed by OSAM, but were achieved by means of the retroactive application of each of the previously referenced models, certain aspects of which may have been designed with the benefit of hindsight.
The hypothetical backtested performance does not represent the results of actual trading using client assets nor decision-making during the period and does not and is not intended to indicate the past performance or future performance of any account or investment strategy managed by OSAM. If actual accounts had been managed throughout the period, ongoing research might have resulted in changes to the strategy which might have altered returns. The performance of any account or investment strategy managed by OSAM will differ from the hypothetical backtested performance results for each factor shown herein for a number of reasons, including without limitation the following:
Although OSAM may consider from time to time one or more of the factors noted herein in managing any account, it may not consider all or any of such factors. OSAM may (and will) from time to time consider factors in addition to those noted herein in managing any account.
OSAM may rebalance an account more frequently or less frequently than annually and at times other than presented herein.
OSAM may from time to time manage an account by using non-quantitative, subjective investment management methodologies in conjunction with the
application of factors.
The hypothetical backtested performance results assume full investment, whereas an account managed by OSAM may have a positive cash position upon rebalance. Had the hypothetical backtested performance results included a positive cash position, the results would have been different and generally would have been lower.
The hypothetical backtested performance results for each factor do not reflect any transaction costs of buying and selling securities, investment management fees (including without limitation management fees and performance fees), custody and other costs, or taxes – all of which would be incurred by an investor in any account managed by OSAM. If such costs and fees were reflected, the hypothetical backtested performance results would be lower.Therefore, it should be noted that on the previous pages of this presentation, any back-tested results may be reflected gross of fees. Had OSAM managed the back-tested Portfolio during the corresponding time period, the deduction of an OSAM fee would have decreased the reflected results. For example, the deduction of a 1.00% fee over a 10-year period would have reduced a 10% gross of fees gain to an 8.9% net of fees gain.
The hypothetical performance does not reflect the reinvestment of dividends and distributions therefrom, interest, capital gains and withholding taxes.
Accounts managed by OSAM are subject to additions and redemptions of assets under management, which may positively or negatively affect performance depending generally upon the timing of such events in relation to the market’s direction. Simulated returns may be dependent on the market and economic conditions that existed during the period. Future market or economic conditions can adversely affect the returns.


