The Factor Archives: Momentum
By Jamie Catherwood
December 2019
While they may not have been known by the same names, many modern investment factors have historical roots stretching back centuries. This series, The Factor Archives, provides historical context on the six factor themes underlying OSAM’s investment process. You can also find other posts from the Factor Archives series here.

“In the short run, the market is a voting machine but in the long run, it is a weighing machine.”
- Benjamin Graham
INTRODUCTION
The Efficient-Market Hypothesis argues that share prices reflect all available information, and thus always trade at fair value. To anyone that has spent just a few minutes reading financial history, however, this assertion is immediately questionable. If this hypothesis was true, there would not be examples of bubbles, panics, manias, and crashes stretching back centuries. Market inefficiencies have persisted since shares were first traded, with many borne out of investor behavior and human nature. By studying how and why such inefficiencies occur, investors can capture these market mistakes as alpha through a systematic investment approach.
THE FACTOR THESIS
After researching Shareholder Yield in the last piece, this installment of The Factor Archives will look at Momentum, a factor rooted in human nature. For while it may be true that markets are aggregators of information, investors don’t always pay attention. As The Economist put it:
“The efficient-market hypothesis assumes that new developments are instantly assimilated into asset prices. However, investors may be slow to adjust their opinions to fresh information. If they view a company unfavorably, they may dismiss an improvement in quarterly profits as a blip, rather than a change in trend. So, momentum may simply represent the lag between beliefs and the new reality.”1
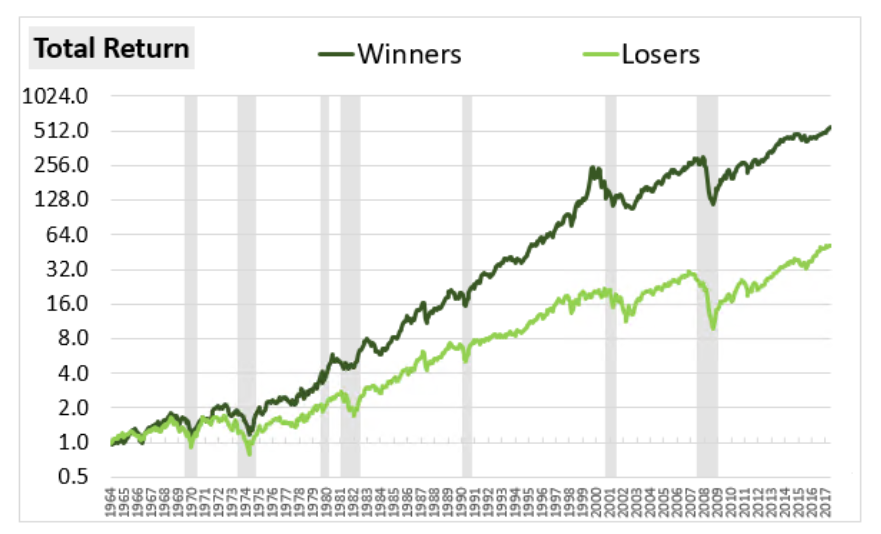
It is within this “lag between beliefs and the new reality” that factors like Momentum can generate alpha. In its simplest definition, Momentum demonstrates that over six-month and twelve-month periods, winning stocks continue to win, and losers generally continue to lose.2
For this information to be useful to an investor, however, we must understand how and why this is the case. The answer is found in behavioral finance, and human nature. In particular, the Momentum factor persists because of investor’s tendencies to chase returns, engage in herding behavior, and under or overreact to stock-specific information.
Momentum represents the moment in time when investors over-extrapolate strong earnings growth too far into the future, and ignore the possibility of mean reversion. For example, a company growing earnings 50% a year is unlikely to continue growing 50% a year forever. In the short-term, however, that company will likely perform well as investors become overly excited about its prospects. Additionally, they will likely ignore information about the slowdown in earnings once the day finally arrives, which allows the stock to trend further away from its fair value.
Put simply, stocks with unusually high growth rates get stretched well past fair value. This ‘stretching’ generates an excess return that eventually gets reversed through mean reversion. There are, however, disciplined ways to capitalize on momentum before this occurs.
THE EMPIRICAL EVIDENCE
How much value can recognizing these behavioral biases add to returns, though? The chart below summarizes our research on Momentum. On the far left, Decile 1 represents the group of stocks with strong momentum. On the far right, Decile 10 shows companies with weak momentum. As you can see, there is ample opportunity for capturing alpha.
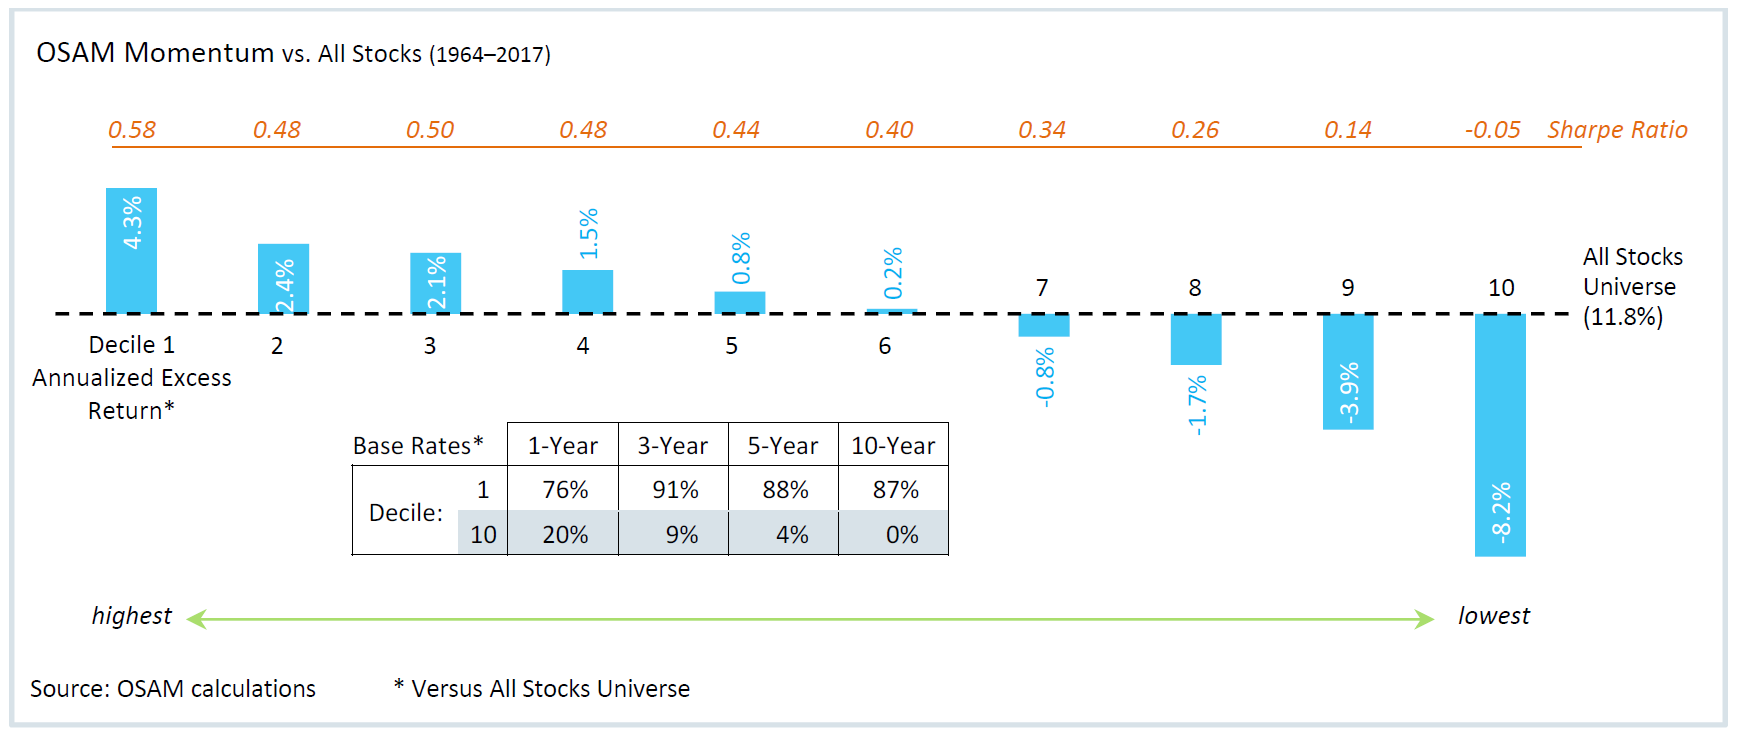
To evaluate the efficacy of Momentum, we compare each group to our All Stocks Universe by Excess Return, Sharpe Ratio, and Batting Average (Base Rates). The chart clearly demonstrates that stocks with high momentum outperform the universe, offering an excess return of 4.3% annually. On a risk‐adjusted basis, these stocks also outperform, with a Sharpe Ratio 1.5x higher than the All Stocks Universe (0.58 vs. 0.35). Finally, they are also consistent, outperforming in 91% of the 648 rolling‐three-year periods. Conversely, stocks with the lowest momentum underperform by ‐8.2%, have a worse Sharpe Ratio, and only outperform the market 9% of the time in rolling-three-year periods.
For these reasons, OSAM not only buys stocks with strong momentum, but also screens out (avoids) those with worse momentum.
HISTORICAL ORIGINS: CONFUSION DE CONFUSIONES

History is an archive of human nature, highlighting all of our behavioral biases and mistakes. Through studying history, it is readily apparent that human nature rarely changes. OSAM Chairman and Co-CIO Jim O’Shaughnessy frequently states that arbitraging human nature is the last edge. While there are countless factors and signals, many only work in shorter time frames. Conversely, factors and signals rooted in human nature provide a competitive edge that has lasted for centuries.
To demonstrate the persistence of investor’s behavioral biases, consider the first book on behavioral finance, Confusion de Confusiones. Written 300 years ago, the author had already recognized the biases plaguing investors:
“There are as many speculators as there are people, and that there will always be buyers who will free you from anxiety… The expectation of an event creates a much deeper impression upon the exchange than the event itself. When large dividends or rich imports are expected, shares will rise in price… bulls are optimistic with joy over the state of business affairs, which is steadily favorable to them; and their attitude is so full of [unthinking] confidence that even less favorable news does not impress them and causes no anxiety.”
- Joseph de la Vega (1688)3
Today, nothing about this assessment has changed. We still ignore information contradicting our beliefs, and weigh expectations more heavily than reality in our decision-making process. Instead of just recognizing these behavioral flaws, though, the Momentum factor provides an investable strategy for arbitraging human nature. By understanding the investing public’s tendency to chase returns, over / under react to news, and engage in ‘herding behavior’, OSAM incorporates the Momentum factor by screening out of stocks with poor momentum, and favoring stocks with strong momentum.
STRONGER TOGETHER: VALUE AND MOMENTUM
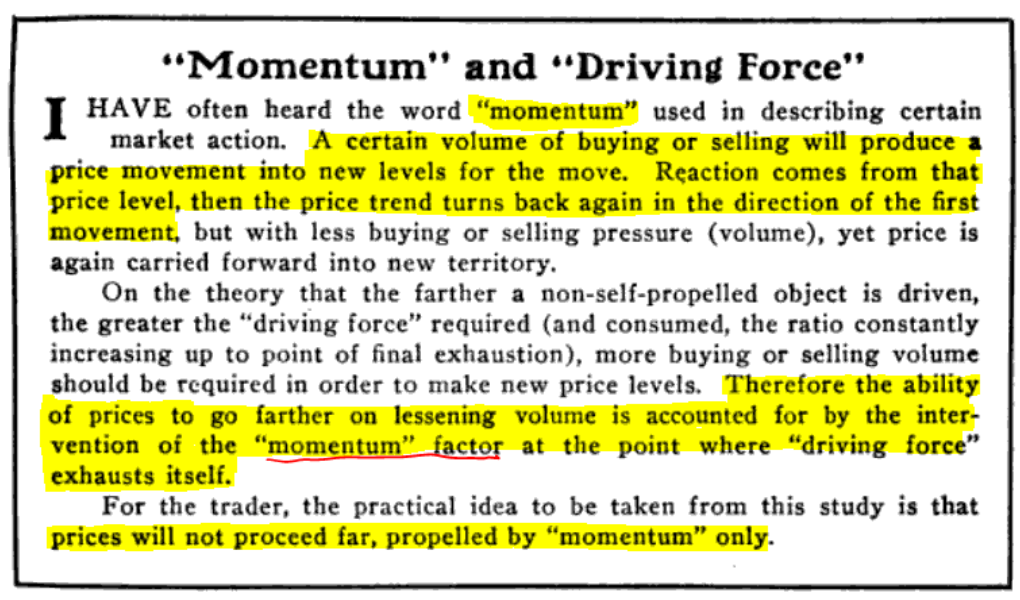
In 1913, The Magazine of Wall Street correctly pointed out that “prices will not proceed far, propelled by ‘momentum’ only.”4 While written over a hundred years ago, this insight on the Momentum factor remains true today.
Today, quantitative investors would update this statement to assert that ‘momentum is better incorporated into a multi-factor approach.’ One of the most effective ways to utilize Momentum is by pairing it with the Value factor.
The factors are a powerful combination for two key reasons. First, they work across different time frames. In our paper Alpha Within Factors, the OSAM Research team defined Value in the following way:
“The process begins when the market develops an expectation that the earnings of certain companies will decline or grow at depressed rates into the future. The market then prices those companies at a discount relative to their current earnings, turning them into ‘value stocks.’ Over the short-term, the market usually ends up being right in its expectations: value stocks usually do go on to experience declines or slowdowns in their earnings, particularly in comparison with the rest of the market. But over the long-term, they usually recover and return to normal growth. When the market prices value stocks, it tends to underestimate the likelihood and extent of their eventual recoveries. Consequently, it tends to underprice them relative to the actual stream of future earnings that they go on to generate. As the future takes shape, the market adjusts to correct this mistake, re-rating the stocks higher and delivering excess returns to those who buy at the beginning of the process.”5
Momentum, meanwhile, is effective in three-month, six-month and nine-month periods. When used together, investors can reap the benefits of buying attractive companies that are trading at cheap valuations, and trending higher with strong momentum.
Since losing stocks generally continue losing across shorter time frames, the Momentum factor can also help investors avoid companies that may be trading at cheap valuations, but for good reason. These scenarios are commonly known as ‘falling knives’, or ‘value traps’.
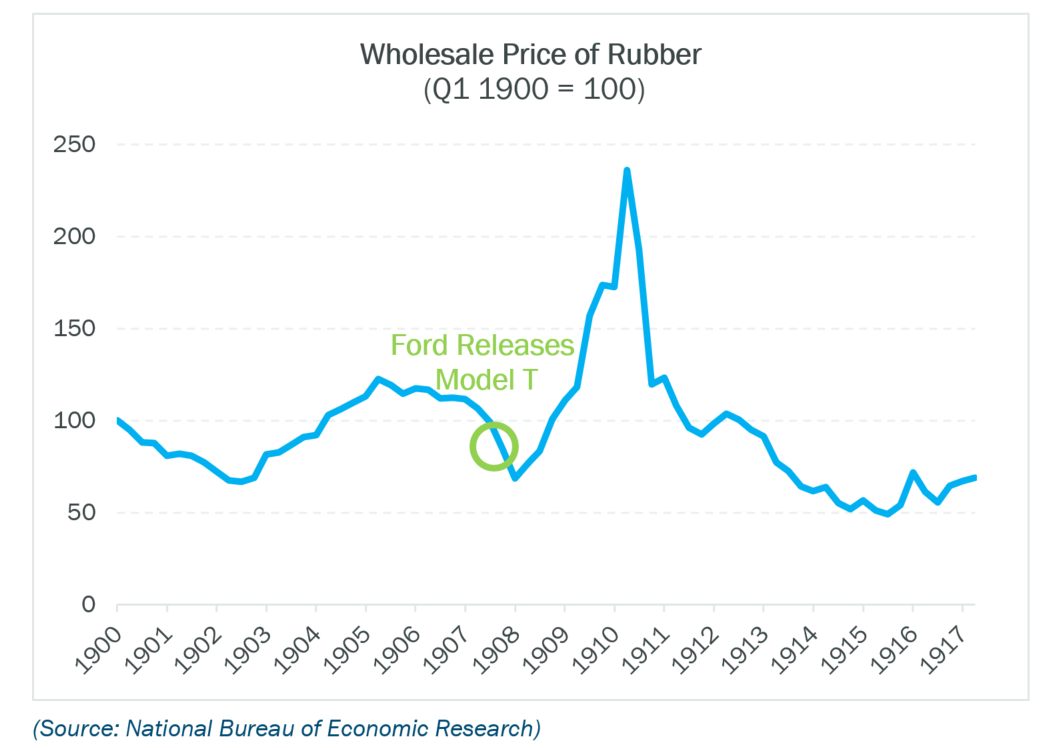
A HISTORY LESSON: THE RUBBER BOOM OF 1910
As we covered earlier, Momentum occurs when the market is confronted with exceptionally strong fundamental growth and over-extrapolates that growth into the future, failing to appreciate that mean-reversion is likely to occur. In simpler terms, you can think of Momentum as a ‘justified boom’ that eventually turns into a speculative rally as enthusiastic investors push up the price of a stock by buying at higher and higher valuations.
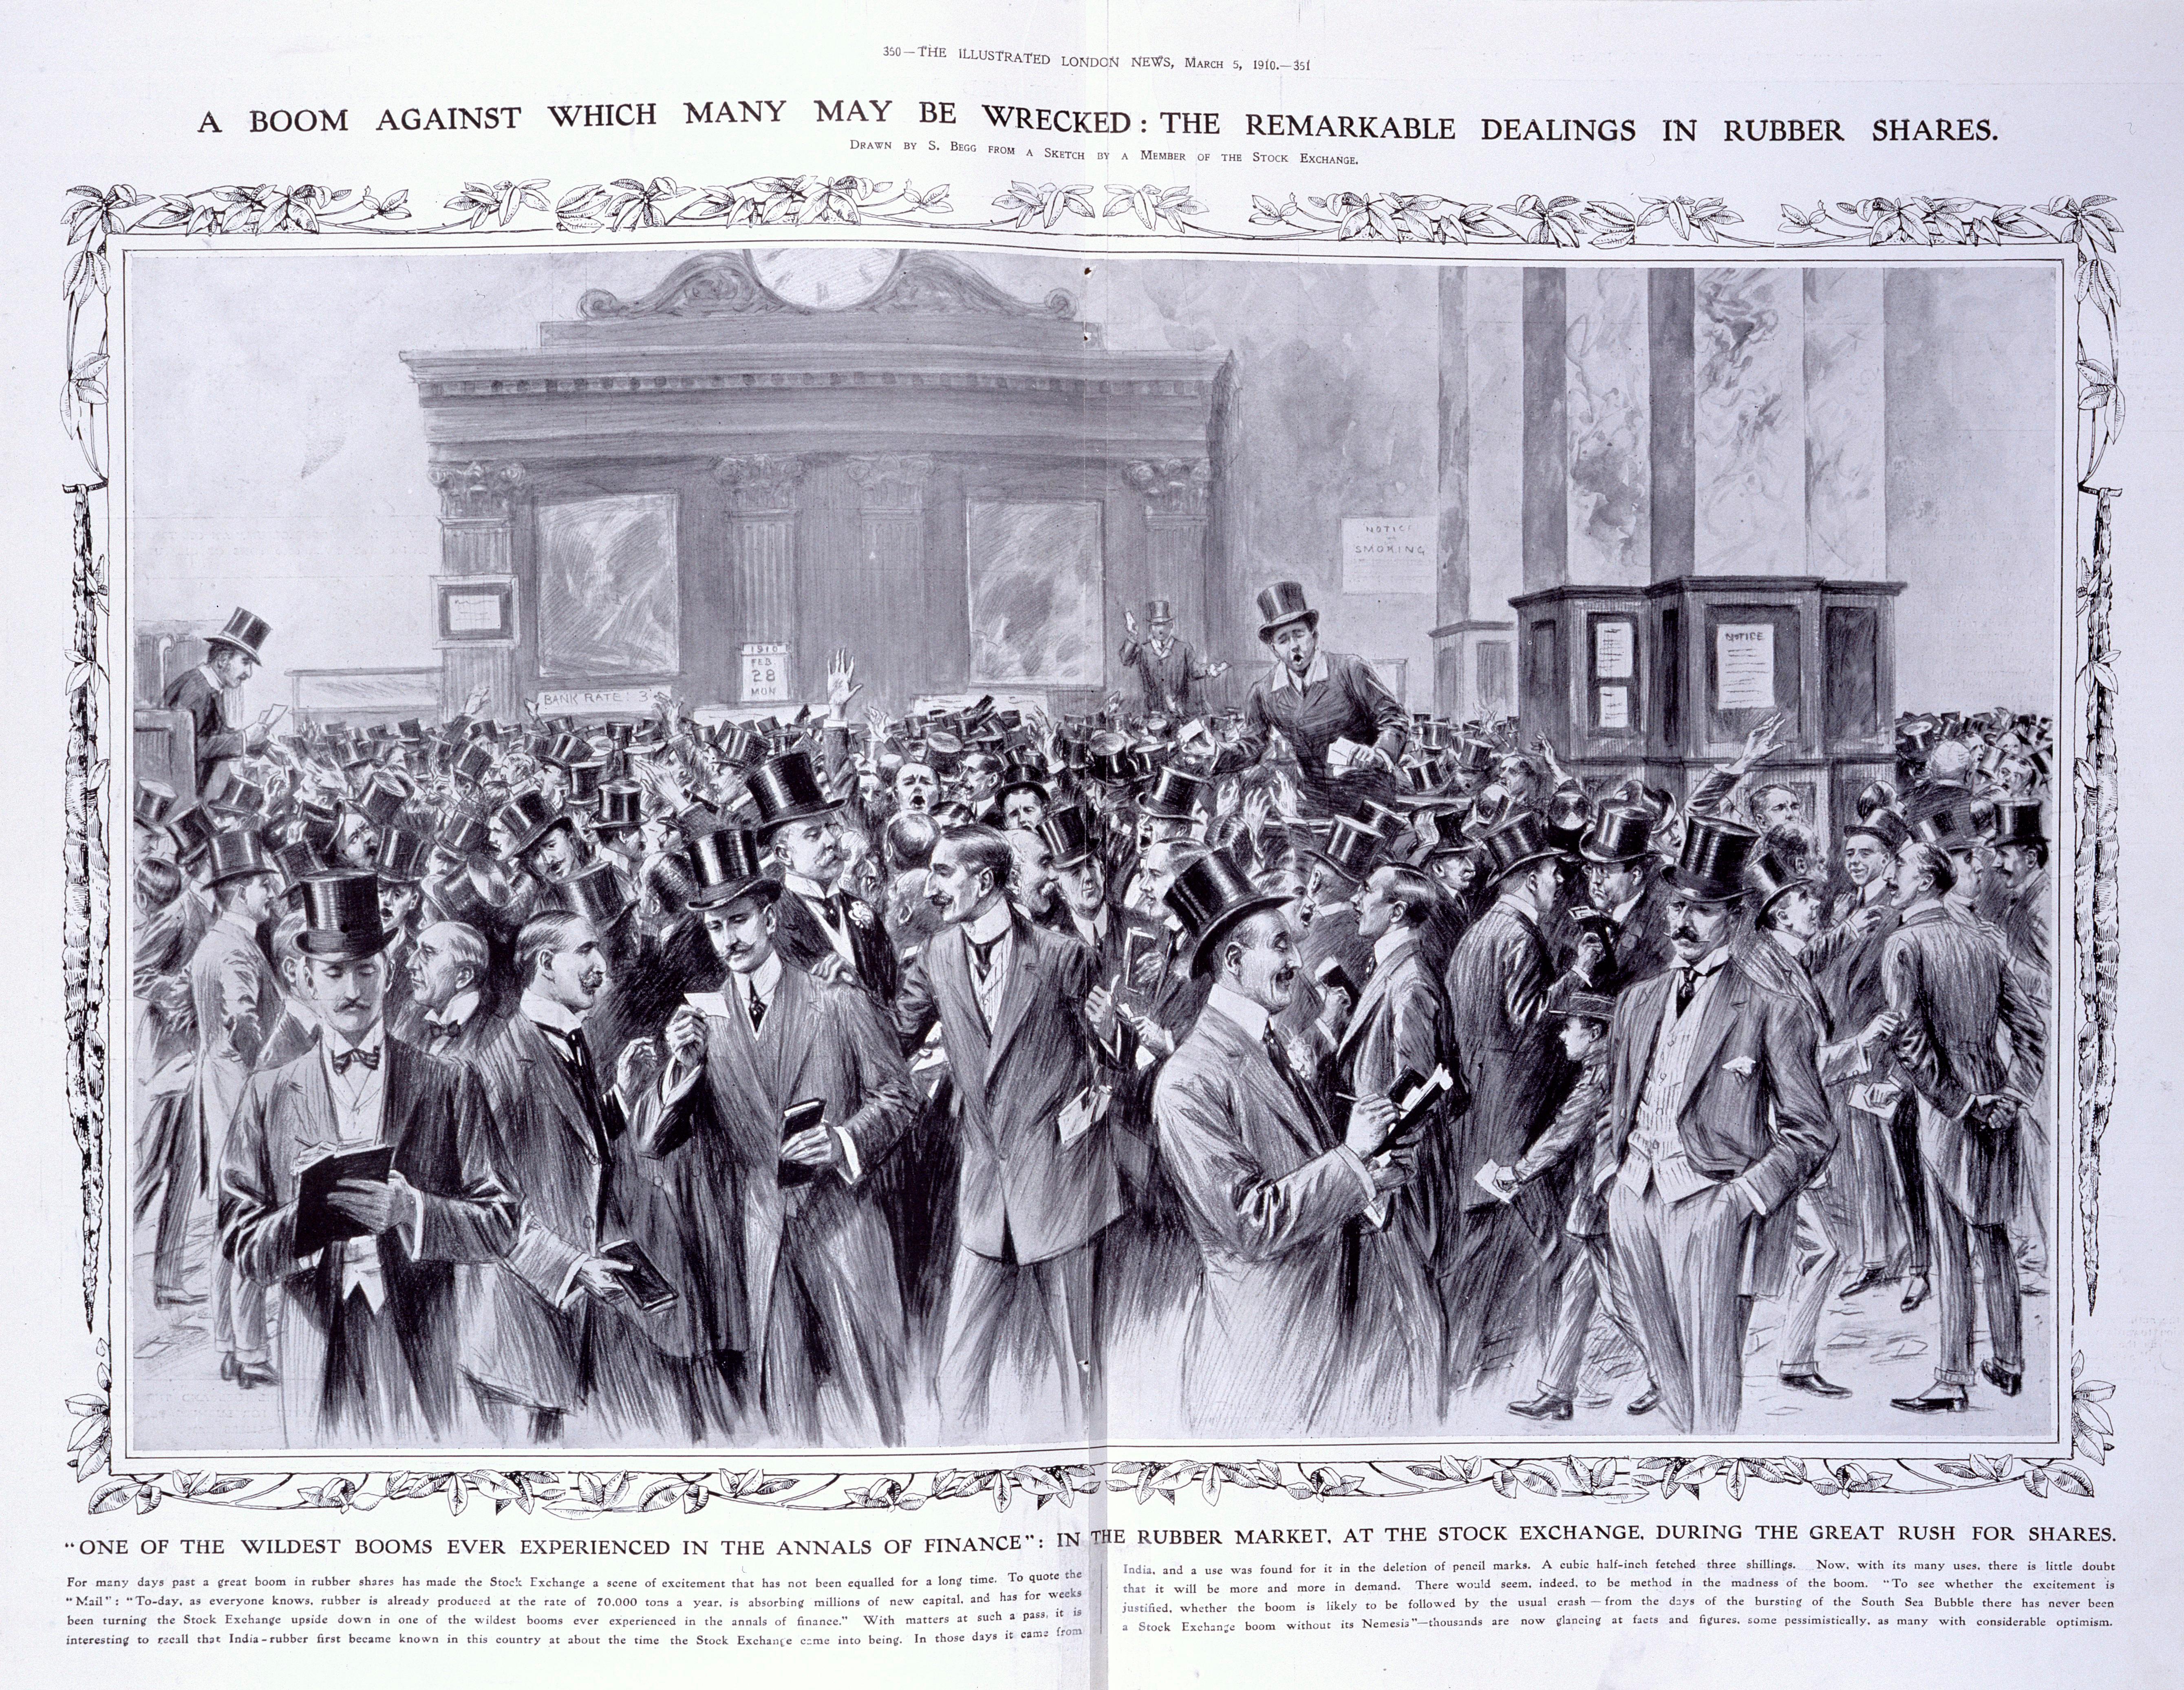
“The rubber boom stands out as unique from other kindred movements, the rise being to a large extent justified as regards the shares in the producing companies and in certain others which were moderately capitalized and had good dividend prospects.”6
A Justified Boom With Solid Foundations
The ‘Rubber Boom’ in early 20th century London offers a perfect case study of how strong stock returns originally justified by growing earnings can quickly morph into a speculative ‘boom’. Investors chased returns, herded into rubber companies' shares, and ignored information that indicated a reversal was likely.
First, it is important to understand what drove the excitement for rubber shares. As it turns out, the reasoning was simple. Coming off the back of a ‘bicycle mania’ at the end of the 19th century, another new technological innovation requiring tires had just started rolling off the assembly lines in America: the automobile. Explaining his investment thesis, one investment manager exclaimed:
“If you take two of the industries which are practically the largest users of rubber, like electricity and motor traction, I do not think that anyone can come to any other conclusion than that both these industries, large as they may be to-day, as yet are only in their infancy.”7
These two new forms of transportation, particularly the automobile, led to a burgeoning demand for tires, and consequently, rubber.
“The Rubber Boom undoubtedly has solid foundation. New uses are constantly being found for rubber, and there is an increasing demand for the articles in which it is used to present…. There are ample materials here for a legitimate boom, and there can be little doubt that there are good prospects of a prosperous future for those rubber companies which have chosen their ground well, and whose flotation has been carried with wisdom and moderation.”8
A Speculative Herd Moves In
While rubber prices soared higher, so did shares of rubber companies and plantations reaping increasingly large profits. Observing a combination of steadily climbing share prices and substantial dividends, it did not take long for the investment public to plow their capital into shares of rubber companies at exactly the wrong time, when shares were expensive. A journalist at the time lamented:
“The madness of speculation, however, decrees that at the height of its fever people shall rush in to buy whatever may be offered, whereas, on a return to sanity by the market as a whole, the sounder opportunities then presented for money-making are pushed aside with impatience, or contemplated with polite indifference."9
Suddenly, what had previously been a ‘justified’ boom in profitable rubber companies turned into a speculative fever fueled by retail investors. Stories quickly spread around London of a city merchant who quit his job to day trade rubber shares full-time, and a group of hotel guests that started a trading operation out of their room in a Swiss ski resort.10 The Economist wrote:
“There are also many signs that the point has now been reached at which prudent optimism ceases and is replaced by emotional enthusiasm. Prospectuses pour out, and subscriptions pour in. The speculative public wants rubber shares-it does not care which.”11
Taken from the same publication, a century apart, that “point” where “prudent optimism ceases, and is replaced by emotional enthusiasm” is very similar to the description of momentum included at the start of this article: “momentum may simply represent the lag between beliefs and the new reality.”
Rational Investors
Not all participants in the rubber boom were gambling speculators, however. Firms like the ‘Rubber Plantation Investment Trust’ remained disciplined both before the boom broke out, and during. In fact, the trust practiced early forms of the principles guiding OSAM’s investment philosophy today. Through careful due diligence, the trust identified rubber companies trading at cheap valuations, demonstrating good governance, and recording strong earnings.
From inception, the trust was clear in its intent to find quality businesses at reasonable or cheap prices:
“You, ladies and gentlemen, are in the fortunate position of having a good stock of shares in first-class rubber-producing companies, bought at most moderate prices and enhancing in value day by day, and I have not the slightest doubt that our mutual undertaking will have a most prosperous future.”12
By building their portfolio around cheap stocks, they benefited from the momentum in rubber stocks as retail investors recognized the value of rubber plantations, and eventually herded into the sector, pushing share prices higher. In their annual shareholder meeting, one of the managers commented:
“What a change do we find in the conditions of the rubber share market since I had the pleasure of addressing you in June last… Now everybody has a craving for rubber shares. One of the first paragraphs in the summary of every financial paper is devoted to the rubber market and a breakfast table unadorned by at least one rubber prospectus would look very unappetizing…
Your board have not omitted to take advantage of this state of things, and they have, of course, had many opportunities of furthering your interests by acquiring blocks of shares in the best rubber companies… The public subscribed all these securities with great avidity, and they have attained to substantial premia.”13
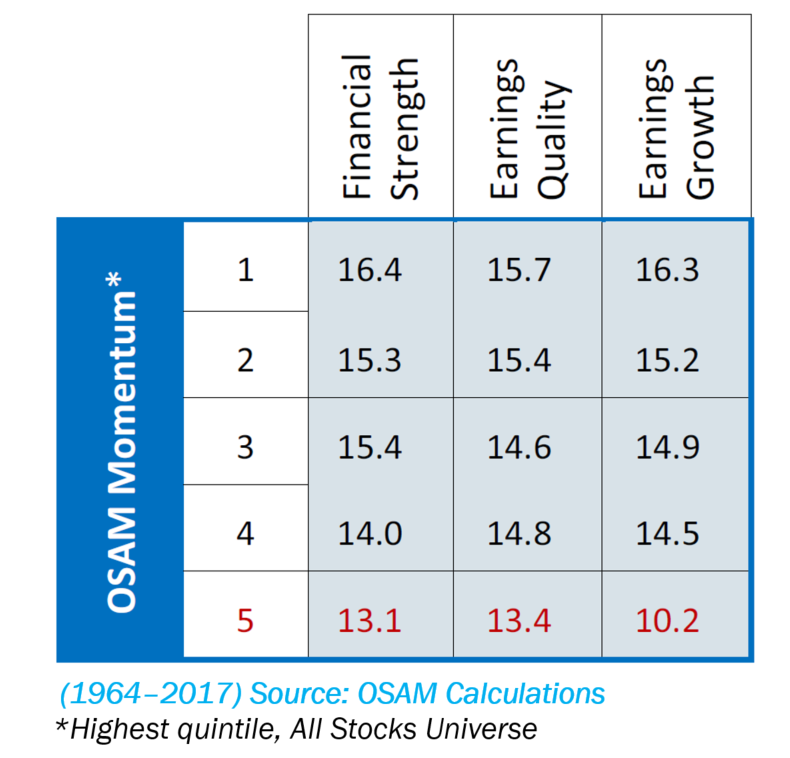
In addition to focusing on Value, Momentum can similarly improve returns when paired with other quality factor themes like Financial Strength, Earnings Growth, and Earnings Quality. The table below shows the annualized returns of the highest quintile of Momentum stocks in the All Stocks Universe paired with each of OSAM’s quality factors.
Like OSAM, The Rubber Plantation Trust also emphasized screening out poor quality companies at expensive valuations, and coined three quality themes of their own:
"These cultivated rubber estates must be properly capitalized, properly managed, properly organized in every shape and form, and then there is practically no [other] source in which money at the present moment can be employed so profitably.”14
Outside of the Rubber Plantation Trust, which was obviously sector specific, there were other rational investors who benefited from strong momentum during the rubber boom, and subsequently sold their positions to rotate into sectors trading at cheaper valuations.
"The clients who sold their rubber shares at big profits have elected to keep out, and let others have a chance of making money out of the shares from which they have clone well. There is a theory, popular in many circles, that to re-enter a market after having once made money out of it is to court disaster, and rather than run this risk, an investor or speculator will branch out into a direction entirely new. Apart from the superstition, there is sound sense in seeking some department less popular for the moment, in which to re-invest capital drawn from a market where prices are obviously high."15
This is incredibly similar to OSAMs portfolio construction process, which weights positions according to their factor profile on a monthly basis, so we are well positioned to outperform on our factor exposures.
THE WAY-WAY BACKTEST: A BOUNCE IN RUBBER PRICES
MODERN PERSPECTIVES: WHAT NOW?
There are no certainties in investing, but one can be very confident that human nature will not be changing any time soon. Since shares first traded on the stock market in the 17th century, market participants and pundits recognized the fact that behavioral biases often cloud our investment decisions. Instead of simply recognizing this fact, however, investors can take advantage of these shortcomings to generate alpha through investment factors like Momentum.
In 2011, The Economist described this gap as “the lag between beliefs and the new reality.” Over one hundred years earlier, in 1910, The Economist referred to it as “the point… at which prudent optimism ceases and is replaced by emotional enthusiasm.”
Humans are unlikely to change their behavior and tendencies to over or underreact to news, and the Momentum factor is therefore poised to continue delivering strong outperformance.
Appendix
1 Why Newton Was Wrong, The Economist, (January 6, 2011)
2 Jesse Livermore+ (Pseudonym), Chris Meredith, Patrick O’Shaughnessy, Factors from Scratch (May 2018)
3 Joseph de la Vega, Confusion de Confusiones (1688)
4 Scribner Browne, ‘Practical Points on Stock Trading’, The Magazine of Wall Street, (November 1913)
5 Jesse Livermore+ (Pseudonym), Chris Meredith, Patrick O’Shaughnessy, Alpha Within Factors (November 2018)
6 ‘After the Boom’, The Economist (June 4, 1910)
7 ‘Rubber Plantations Investment Trust Limited’, The Economist (June 11, 1910)
8 ‘The Vicissitudes of Rubber’, The Economist (February 26, 1910)
9 ‘Opportunities for A Rubber Trust’, The Economist (August 20, 1910)
10 ‘The Revival of Speculation, The Economist (March 5, 1910)
11 ‘After the Boom’, The Economist (June 4, 1910)
12 ‘Rubber Plantations Investment Trust Limited’, The Economist (June 26, 1909)
13 ‘Rubber Plantations Investment Trust Limited’, The Economist (March 5, 1910)
14 ‘Rubber Plantations Investment Trust Limited’, The Economist (June 11, 1910)
15 ‘Re-Investment of Rubber Profits’, The Economist (May 14, 1910)
GENERAL LEGAL DISCLOSURES & HYPOTHETICAL AND/OR BACKTESTED RESULTS DISCLAIMER
The material contained herein is intended as a general market commentary. Opinions expressed herein are solely those of O’Shaughnessy Asset Management, LLC and may differ from those of your broker or investment firm.
Please remember that past performance may not be indicative of future results. Different types of investments involve varying degrees of risk, and there can be no assurance that the future performance of any specific investment, investment strategy, or product (including the investments and/or investment strategies recommended or undertaken by O’Shaughnessy Asset Management, LLC), or any non-investment related content, made reference to directly or indirectly in this piece will be profitable, equal any corresponding indicated historical performance level(s), be suitable for your portfolio or individual situation, or prove successful. Due to various factors, including changing market conditions and/or applicable laws, the content may no longer be reflective of current opinions or positions. Moreover, you should not assume that any discussion or information contained in this piece serves as the receipt of, or as a substitute for, personalized investment advice from O’Shaughnessy Asset Management, LLC. Any individual account performance information reflects the reinvestment of dividends (to the extent applicable), and is net of applicable transaction fees, O’Shaughnessy Asset Management, LLC’s investment management fee (if debited directly from the account), and any other related account expenses. Account information has been compiled solely by O’Shaughnessy Asset Management, LLC, has not been independently verified, and does not reflect the impact of taxes on non-qualified accounts. In preparing this report, O’Shaughnessy Asset Management, LLC has relied upon information provided by the account custodian. Please defer to formal tax documents received from the account custodian for cost basis and tax reporting purposes. Please remember to contact O’Shaughnessy Asset Management, LLC, in writing, if there are any changes in your personal/financial situation or investment objectives for the purpose of reviewing/evaluating/revising our previous recommendations and/or services, or if you want to impose, add, or modify any reasonable restrictions to our investment advisory services. Please Note: Unless you advise, in writing, to the contrary, we will assume that there are no restrictions on our services, other than to manage the account in accordance with your designated investment objective. Please Also Note: Please compare this statement with account statements received from the account custodian. The account custodian does not verify the accuracy of the advisory fee calculation. Please advise us if you have not been receiving monthly statements from the account custodian. Historical performance results for investment indices and/or categories have been provided for general comparison purposes only, and generally do not reflect the deduction of transaction and/or custodial charges, the deduction of an investment management fee, nor the impact of taxes, the incurrence of which would have the effect of decreasing historical performance results. It should not be assumed that your account holdings correspond directly to any comparative indices. To the extent that a reader has any questions regarding the applicability of any specific issue discussed above to his/her individual situation, he/she is encouraged to consult with the professional advisor of his/her choosing. O’Shaughnessy Asset Management, LLC is neither a law firm nor a certified public accounting firm and no portion of the newsletter content should be construed as legal or accounting advice. A copy of the O’Shaughnessy Asset Management, LLC’s current written disclosure statement discussing our advisory services and fees is available upon request
The risk-free rate used in the calculation of Sortino, Sharpe, and Treynor ratios is 5%, consistently applied across time
The universe of All Stocks consists of all securities in the Chicago Research in Security Prices (CRSP) dataset or S&P Compustat Database (or other, as noted) with inflation-adjusted market capitalization greater than $200 million as of most recent year-end. The universe of Large Stocks consists of all securities in the Chicago Research in Security Prices (CRSP) dataset or S&P Compustat Database (or other, as noted) with inflation-adjusted market capitalization greater than the universe average as of most recent year-end. The stocks are equally weighted and generally rebalanced annually
Hypothetical performance results shown on the preceding pages are backtested and do not represent the performance of any account managed by OSAM, but were achieved by means of the retroactive application of each of the previously referenced models, certain aspects of which may have been designed with the benefit of hindsight
The hypothetical backtested performance does not represent the results of actual trading using client assets nor decision-making during the period and does not and is not intended to indicate the past performance or future performance of any account or investment strategy managed by OSAM. If actual accounts had been managed throughout the period, ongoing research might have resulted in changes to the strategy which might have altered returns. The performance of any account or investment strategy managed by OSAM will differ from the hypothetical backtested performance results for each factor shown herein for a number of reasons, including without limitation the following:
- Although OSAM may consider from time to time one or more of the factors noted herein in managing any account, it may not consider all or any of such factors. OSAM may (and will) from time to time consider factors in addition to those noted herein in managing any account.
- OSAM may rebalance an account more frequently or less frequently than annually and at times other than presented herein.
- OSAM may from time to time manage an account by using non-quantitative, subjective investment management methodologies in conjunction with the application of factors.
- The hypothetical backtested performance results assume full investment, whereas an account managed by OSAM may have a positive cash position upon rebalance. Had the hypothetical backtested performance results included a positive cash position, the results would have been different and generally would have been lower.
- The hypothetical backtested performance results for each factor do not reflect any transaction costs of buying and selling securities, investment management fees (including without limitation management fees and performance fees), custody and other costs, or taxes – all of which would be incurred by an investor in any account managed by OSAM. If such costs and fees were reflected, the hypothetical backtested performance results would be lower.
- The hypothetical performance does not reflect the reinvestment of dividends and distributions therefrom, interest, capital gains and withholding taxes.
- Accounts managed by OSAM are subject to additions and redemptions of assets under management, which may positively or negatively affect performance depending generally upon the timing of such events in relation to the market’s direction.
- Simulated returns may be dependent on the market and economic conditions that existed during the period. Future market or economic conditions can adversely affect the returns.


