The Quarterly: Fundamental Instability
By OSAM Research Team
November 2023
Key Developments:
- Traditional Monetary Policy lags may be longer than expected due to Housing and Labor market dynamics.
- Corporations have not yet begun to digest rising interest costs.
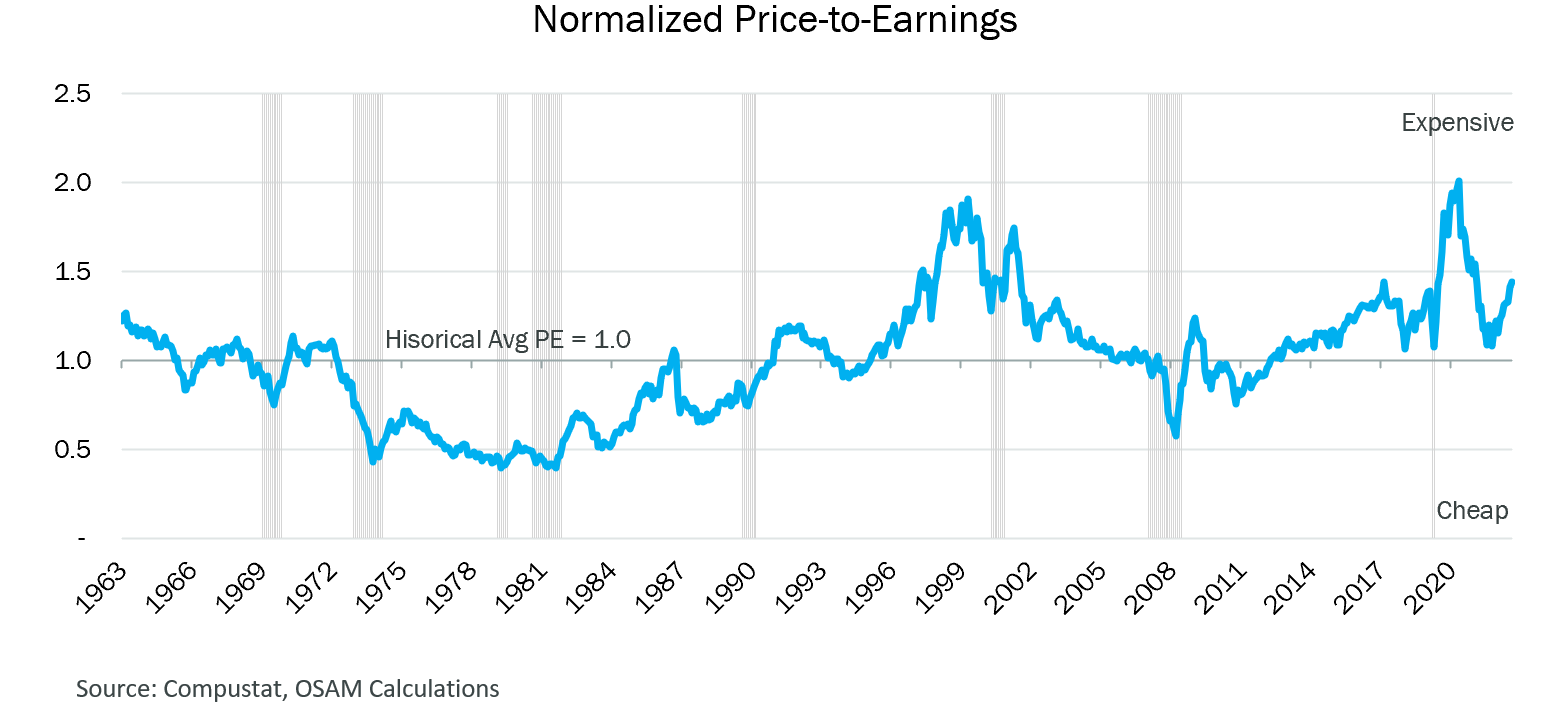
- Normalized valuations suggest the U.S. market continues to be expensive relative to history.
- The banking sector will likely continue to face pressure from rising rates and monetary policy.
- Record levels of dispersion are occurring within U.S. indexes, which has implications for active stock picking.
- Depending on how inflation dynamics evolve, monetary and fiscal policy may be at odds with each other in the coming quarters.
- From a factor perspective on the quarter, value and shareholder yield delivered strong results across U.S., developed, and emerging markets.
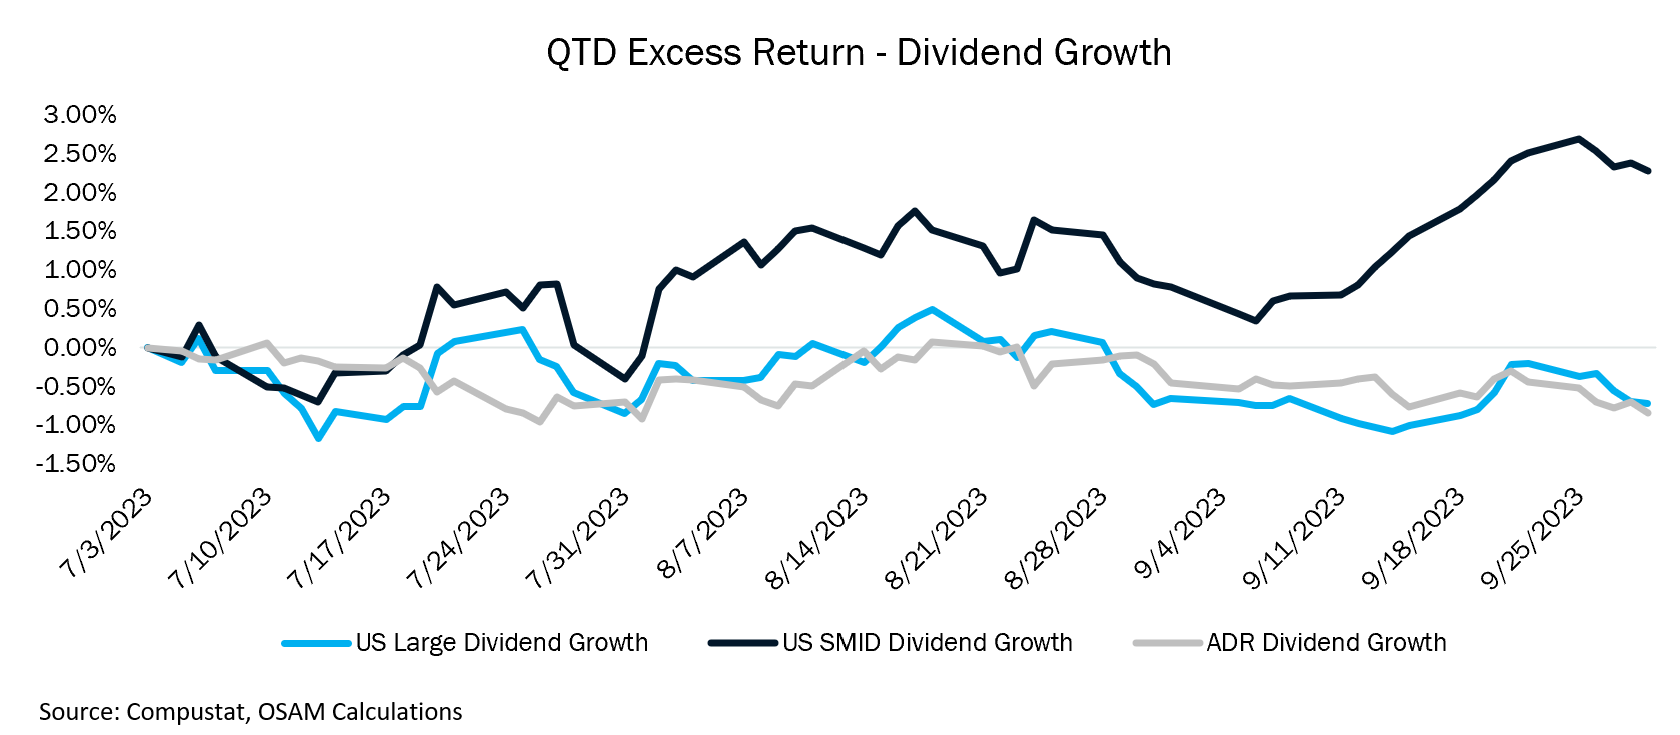
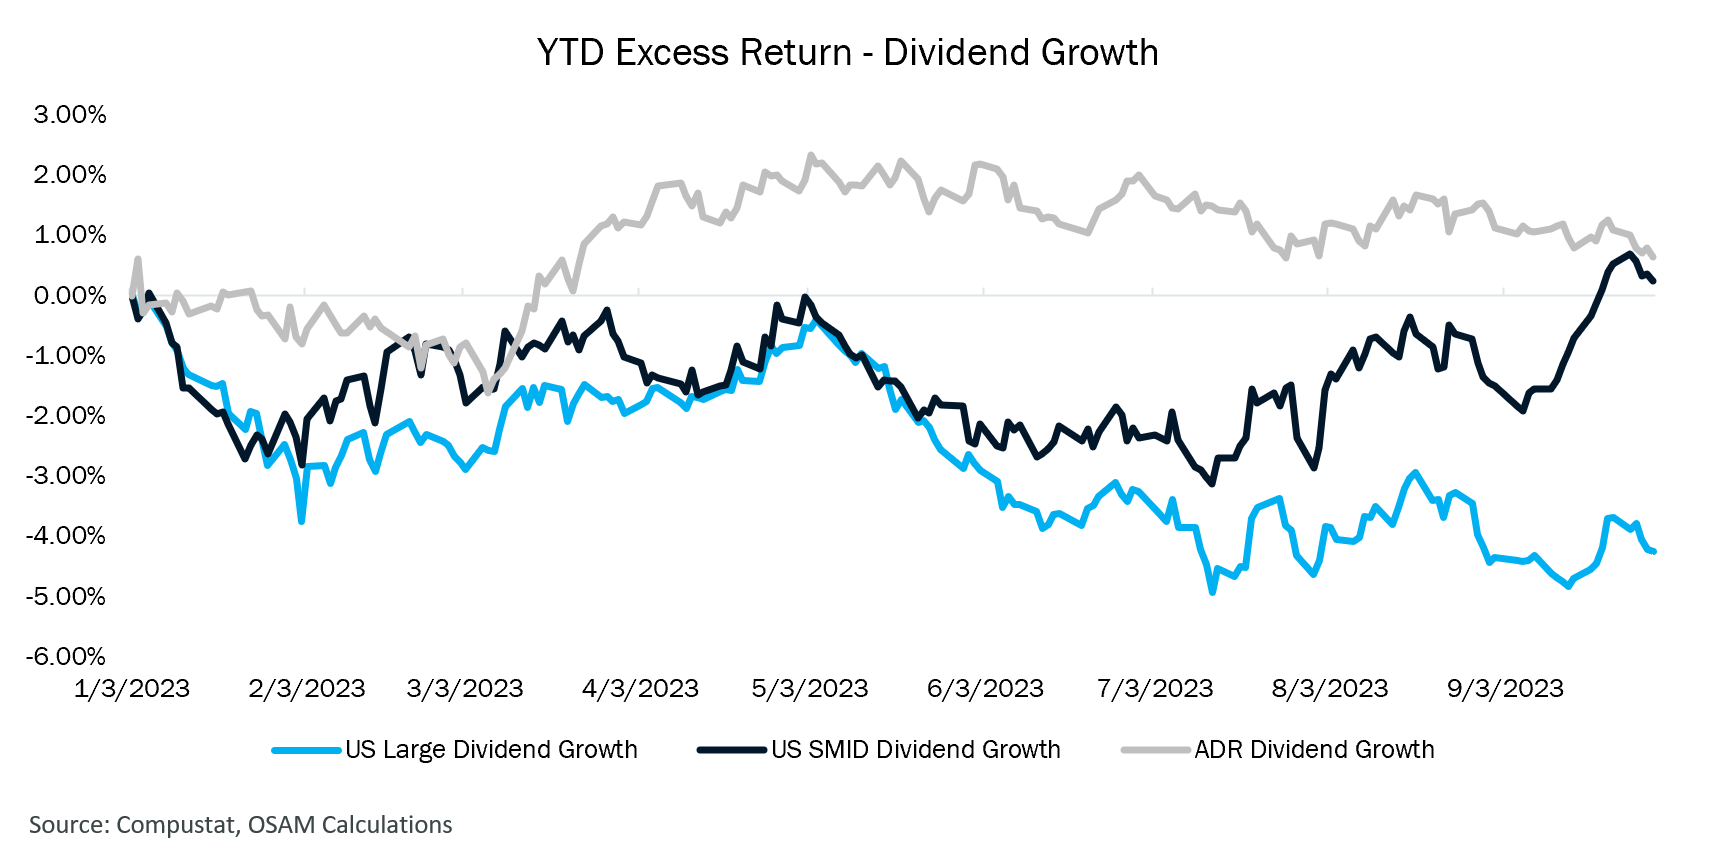
- U.S. dividend growth struggled on the quarter, adding to year-to-date negative excess return, as an underweight exposure to Energy weighed on the factor.
You could make the case that the Federal Open market Committee (FOMC) has accomplished their soft-landing objective. Despite the most aggressive tightening campaign in decades, arguably ever, the U.S. economy seems to be digesting comparatively tighter monetary conditions and higher rates. Headline inflation is trending down. Corporate earnings have dipped but remain largely intact. Employment is secularly tight but loosening. Equity markets have taken notice. Mission accomplished?
Probably not. We think the current environment lacks fundamental stability and it will take a few more quarters to be able to proclaim victory. At the beginning of the year, we suggested that inflation concerns would morph into growth concerns. With central banks in the U.S. and Europe coming to the end of their tightening cycles, this theme has largely played out. Those fears were just percolating in China and growth data has continued to disappoint as the year wears on. The Bank of Japan has not even commenced its hiking campaign, and the Yen has paid a dear price in the face of wage-driven inflation.
Despite banking failures, global growth downgrades, and global inflation upgrades, U.S. and developed equity markets have blissfully risen to within a stone’s throw of all-time highs. Given the dynamics of seasonality, year-end flows, and overall bearish sentiment, the equity markets may well continue to advance, but we think there is a lot of wood to chop based on the fundamental backdrop.
Household Wealth and Monetary Policy Transmission Lags
The current slowdown in existing home sales and mortgage refinance activity appears to be lengthening the duration of traditional monetary policy lags.
Household net worth is up about $36 trillion from the 4th quarter of 2019.1 While it appears that fiscal-stimulus-fueled excess savings are dwindling, real estate values (the largest component of household wealth) have remained elevated despite two-decade highs on mortgage rates. Homeowners are clinging to existing low mortgage rates as demonstrated by declining existing home sales, plunging mortgage refinance activity, and the lengthening of duration on benchmark mortgage-backed securities (MBS).2
The implication is that prevailing interest rates are not impacting financial conditions as they ordinarily would. Taking it a step further, the slowing of the existing housing market is inherently stimulative given the inflation backdrop. Borrowing at a rate lower than inflation on a levered asset is the type of trade the most prolific hedge funds can only dream of. With core inflation averaging 5% over the last 3 years and a mortgage at 3.5%, a homeowner with 20% equity in their home is picking up a 6% levered real return!
One way to overturn this giant macro “trade” is to induce a major life event that places into question a homeowner’s ability to service their mortgage, i.e., loss of a job. Absent such an event at the scale of the economy, the transmission of FOMC policy through the Household sector has been significantly curtailed.
Labor’s Renaissance
There is little question that the labor market is secularly strong. The unemployment rate was only lower in the late 1950s. Though well off the March 2022 peak, nonfarm job openings are well above pre-Covid levels. In December of 2019, there was one job opening for every 24 workers in the U.S. Today, there is one job opening for every 18 workers—25% greater job availability per worker.3
Three years of greater job mobility, greater household net worth, and elevated inflation have emboldened workers to demand a bigger piece of the economic pie. Around March of this year, labor negotiations the world over signaled the level to which inflation is becoming ingrained in the global economy.
Previously unheard-of compensation increases have rolled through the union labor economy—airlines, autos, health care, and transports. The unprecedented, coordinated strike by the United Auto Workers (UAW) at the Big Three automakers in September is likely a watershed moment. Though union membership has been in secular decline for decades, it would be perplexing if the recent success in negotiations doesn’t spur a unionization renaissance.
We have yet to see what the implications will be on corporate margins but suffice it to say labor’s share of profits stands to increase contractually on the order of multiple tens of billions of dollars over the next few years. Higher real incomes could fuel the ongoing maintenance of the mortgage payments while also spurring additional household savings, credit expansion, and, of course, demand-driven consumption. Such an outcome could run contrary to the Fed’s price stability mandate in the coming quarters as re-negotiated labor contracts flow through corporate financials.
Nonfinancial Corporates – Margins Down, Expectations Up
Corporations are the engine of growth for the global economy. Multiple decades of globalization have created an interconnected web of supply chains, customers, and transportation routes that have coalesced in a golden era for corporate profitability. Globalization pushed costs of production lower while interest and tax cost fell during the disinflationary Great Moderation.
Data over the last five years suggests a shift to regionalization is well underway, as can be seen in the charts below.
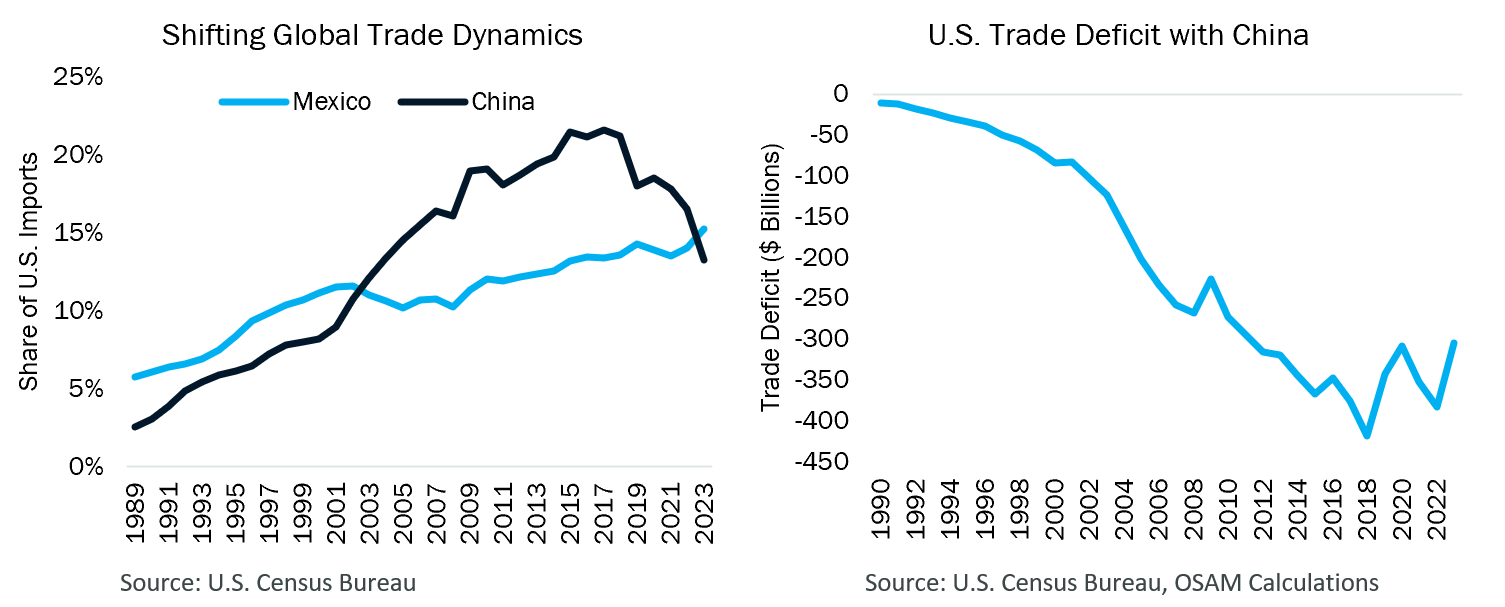
The left chart above shows the share of U.S. imports from China and Mexico. For the first time in two decades, the U.S. imported more from Mexico than China in 2023. While COVID-zero policies in China likely had an impact on the U.S.-China trade relationship, the decline in imports from China began as early as 2018 when Trump-era tariffs were put into place. With those tariffs still in place five years hence, the U.S. trade deficit with China appears to have slowed its decline and even reversed, as can be seen in the right chart above.
As the landscape of global business is shifting, we are only beginning to see the impacts of inflation and changing supply chains on corporate fundamentals. U.S. nonfinancial sales per share are at all-time highs.4 Inflation, after all, can be good for the top line of many businesses! Earnings per share, on the other hand, peaked in March 2022 and are down about 6% from that peak. Margin compression is characteristic of periods around recessions generally and inflationary environments structurally as can be seen in the chart below.
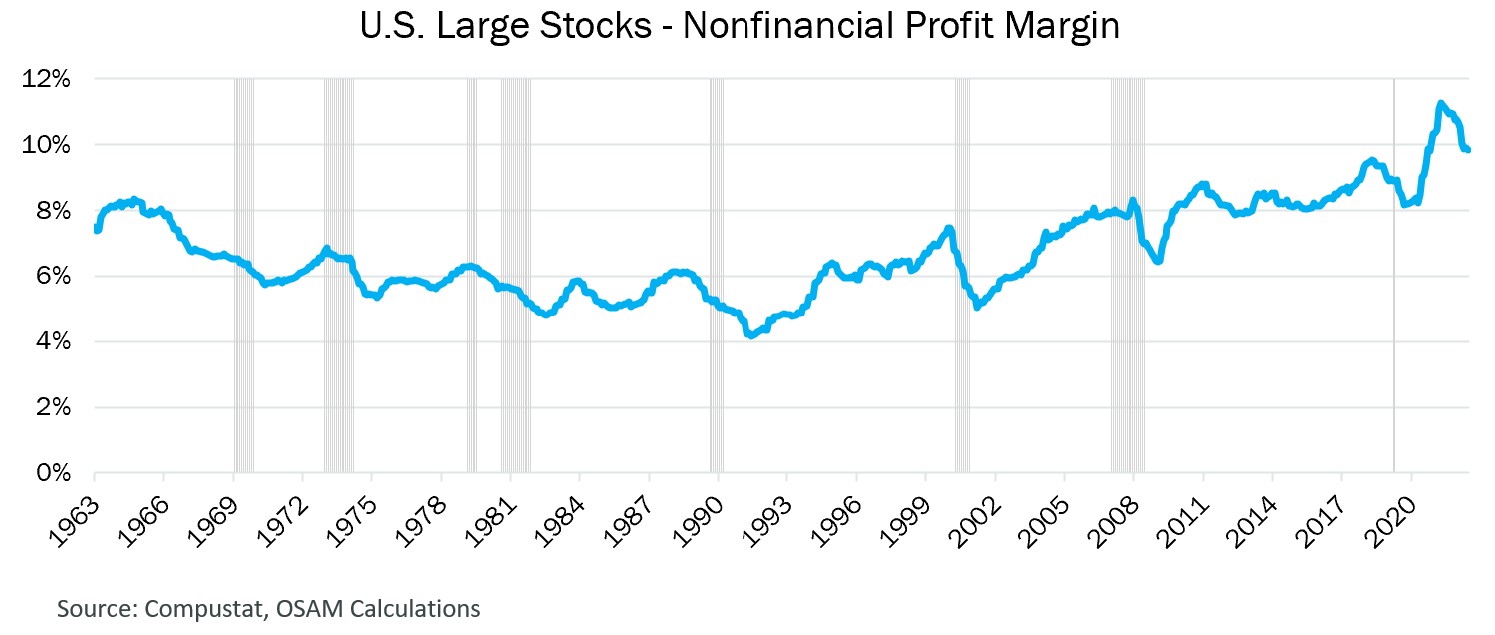
U.S. nonfinancial margins peaked in March 2022 and have been moving lower since. If we were to see continued inflationary pressures, one could make the case that margins have further to fall. In the chart above, note the structural decline in margins throughout the Great Inflation (1965-1982) and for a decade after as juxtaposed to a structural rise throughout the Great Moderation (1983-2021). Persistently rising/falling interest expense and effective tax rates contributed strongly to these trends in both directions.
During COVID, many corporations refinanced their debt to stockpile cash and take advantage of low interest rates. BNP Paribas estimates that 16% of investment grade corporate debt and 13% of high yield corporate debt will need to refinance in 2024. Though corporate interest costs have paradoxically trended down so far in 2023, the next few quarters will likely reflect a step-up in those costs, which could be a headwind for margins and earnings growth.
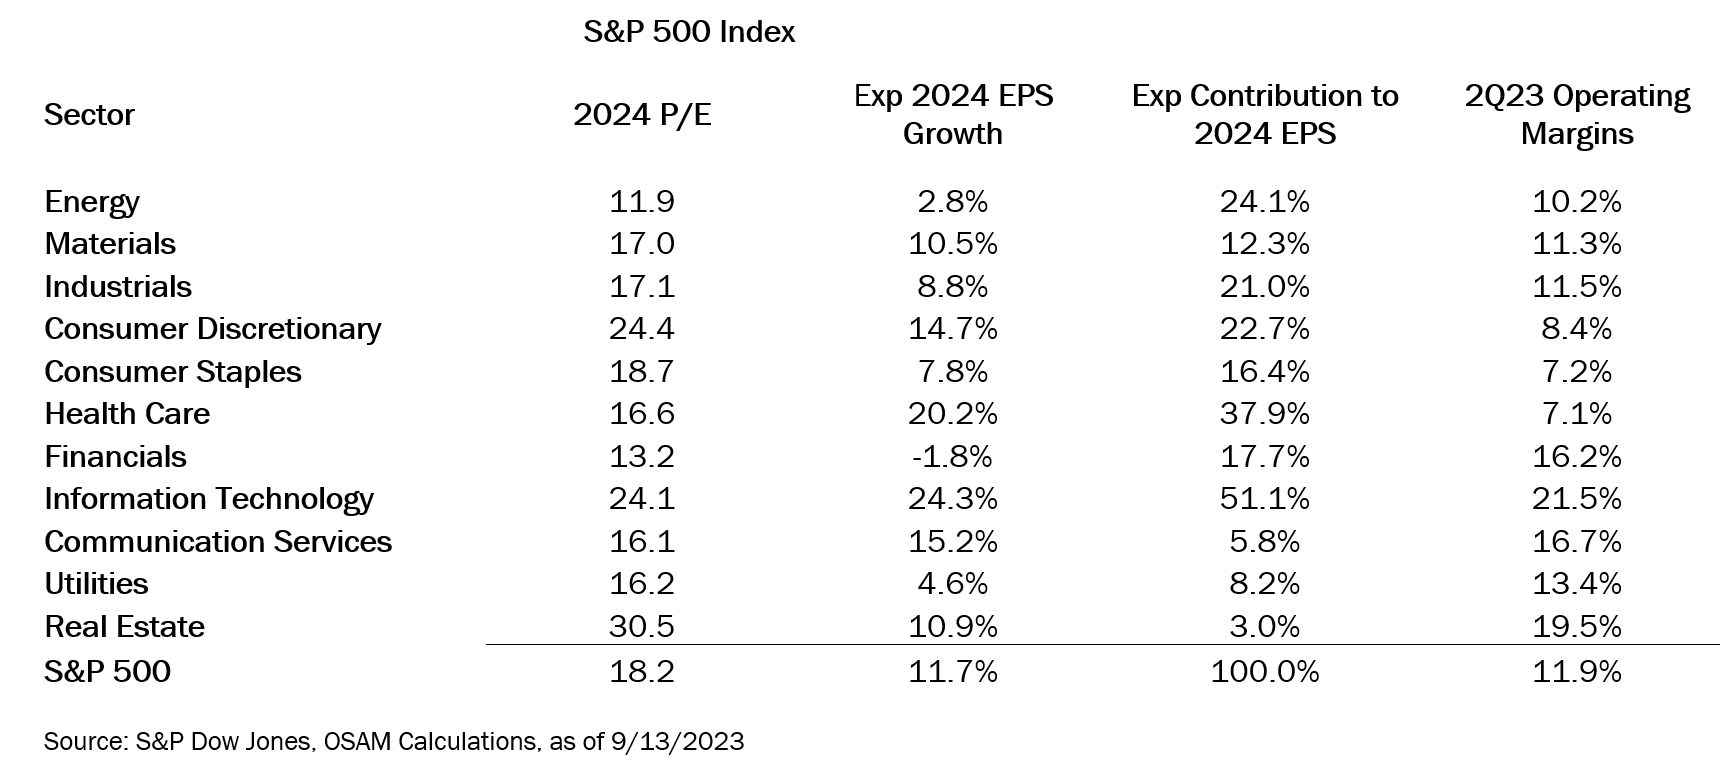
In the meantime, however, margins are still near historical highs, above pre-COVID levels, and likely a reasonable justification for historically high equity earnings multiples. As markets swooned in 2022, earnings multiples contracted, but began to rise from their recent bottom in October 2022. One potential reason is what seems to be the most widely telegraphed, yet most elusive, recession in history that has failed to manifest. Another potential reason is relentlessly upbeat analyst earnings estimates.
Analysts expect an 11.7% increase in earnings per share for the S&P 500 in 2024.5 Information Technology, the sector with the highest margins, currently contributes about 18% of U.S. large cap earnings and analysts expect the group to lead the charge with earnings per share growth of 24% in 2024.
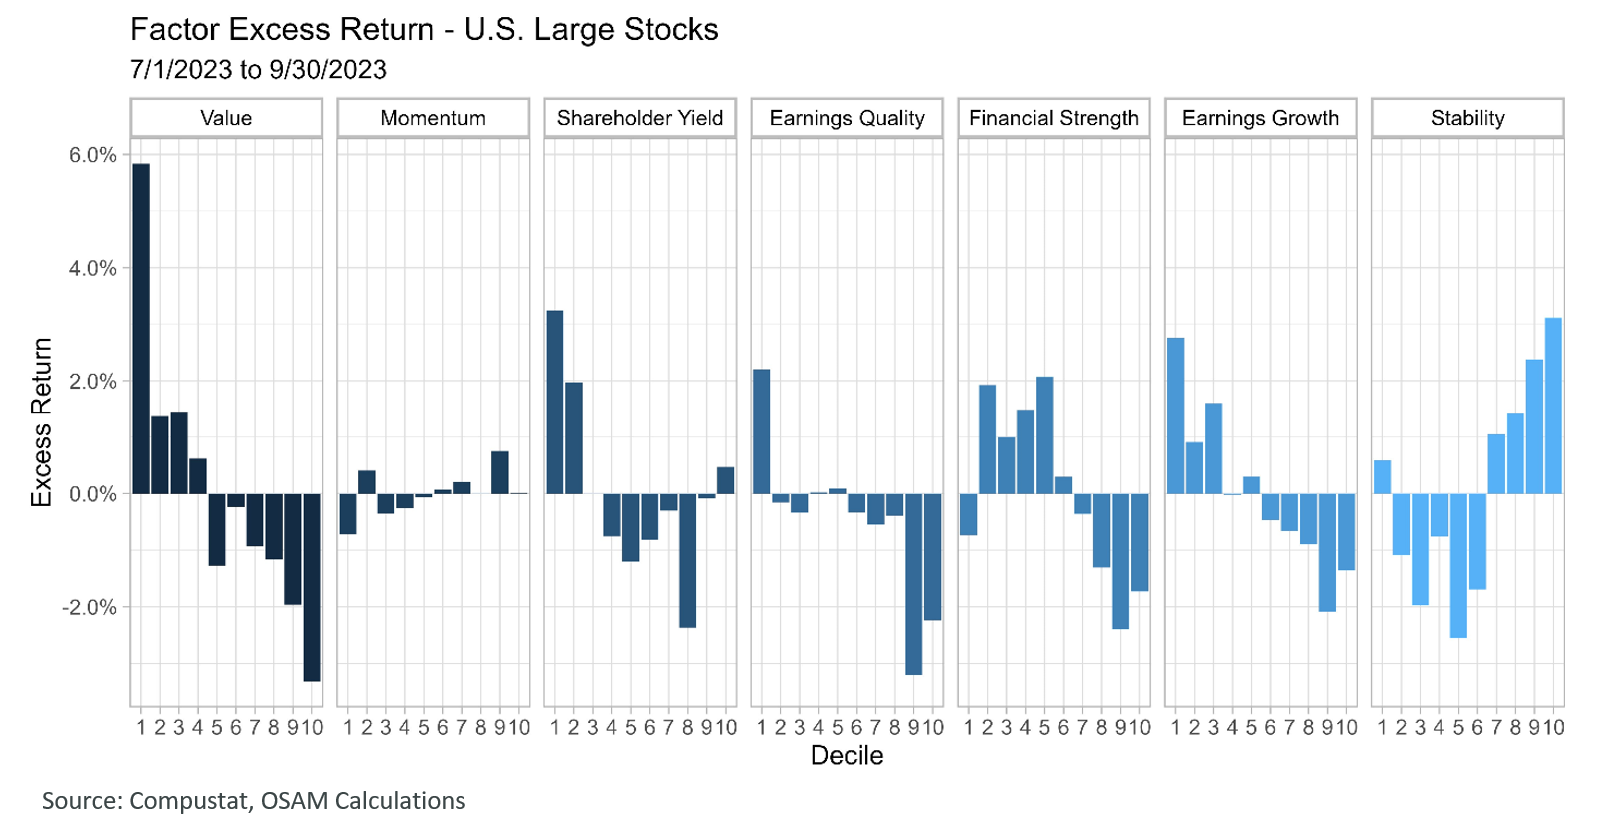
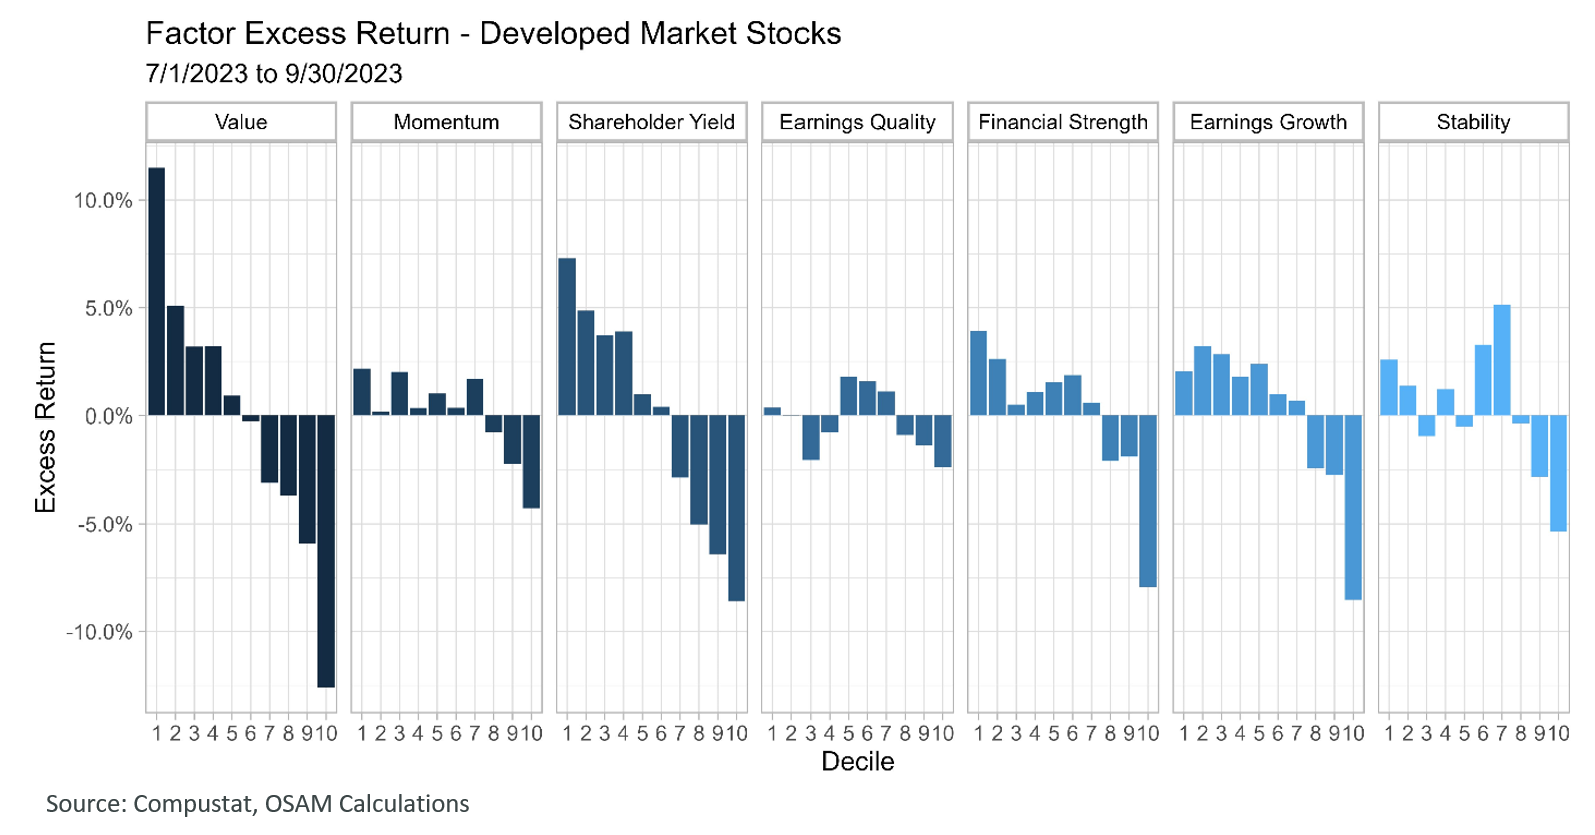
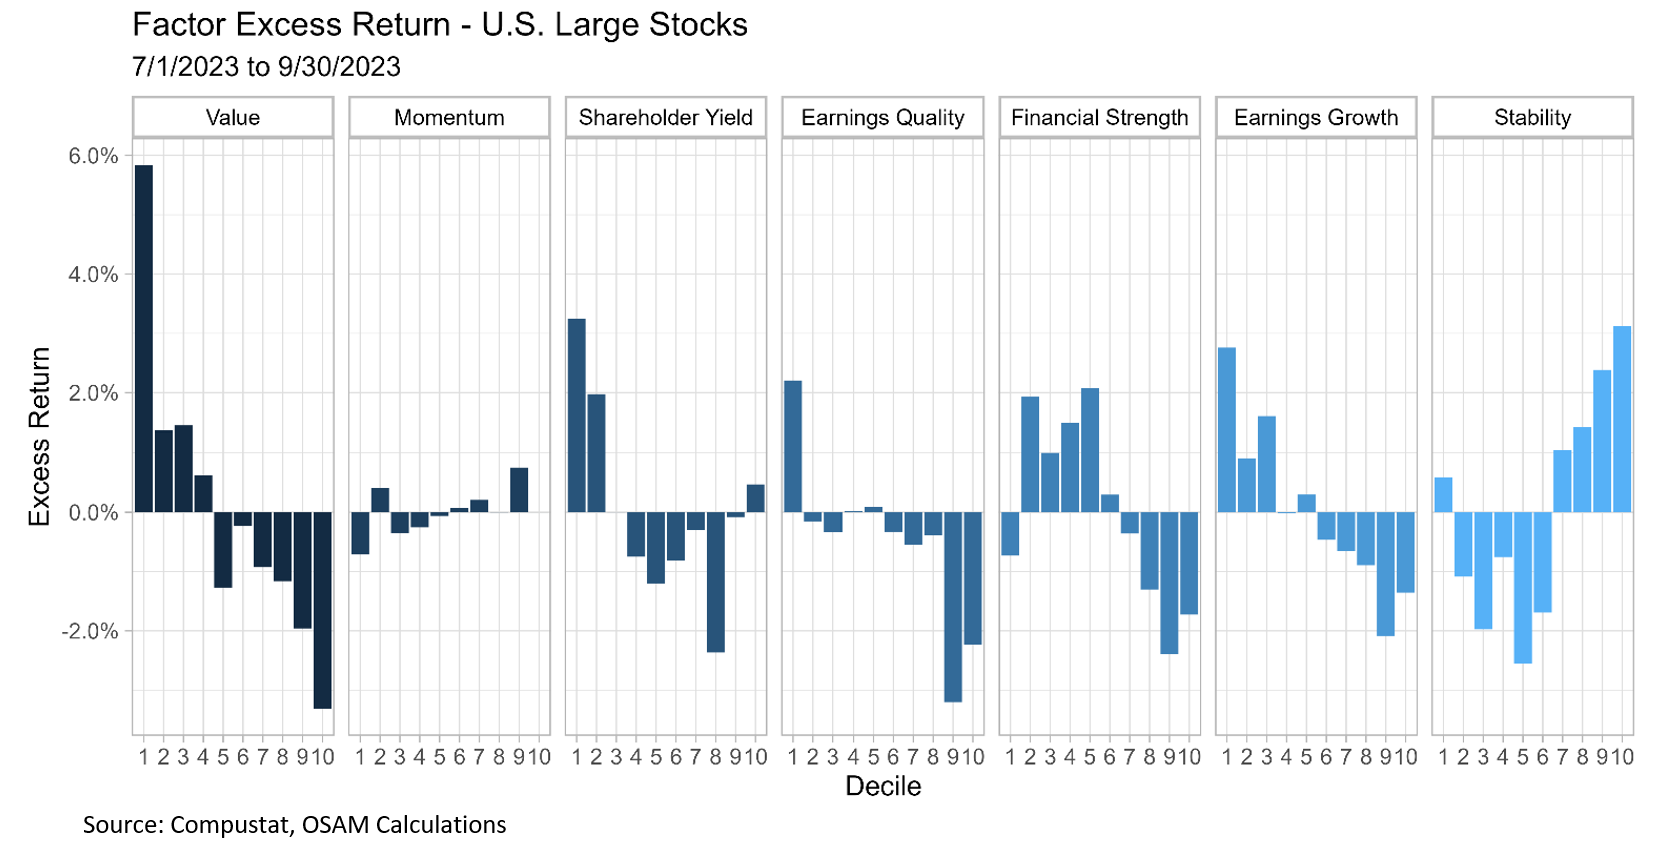
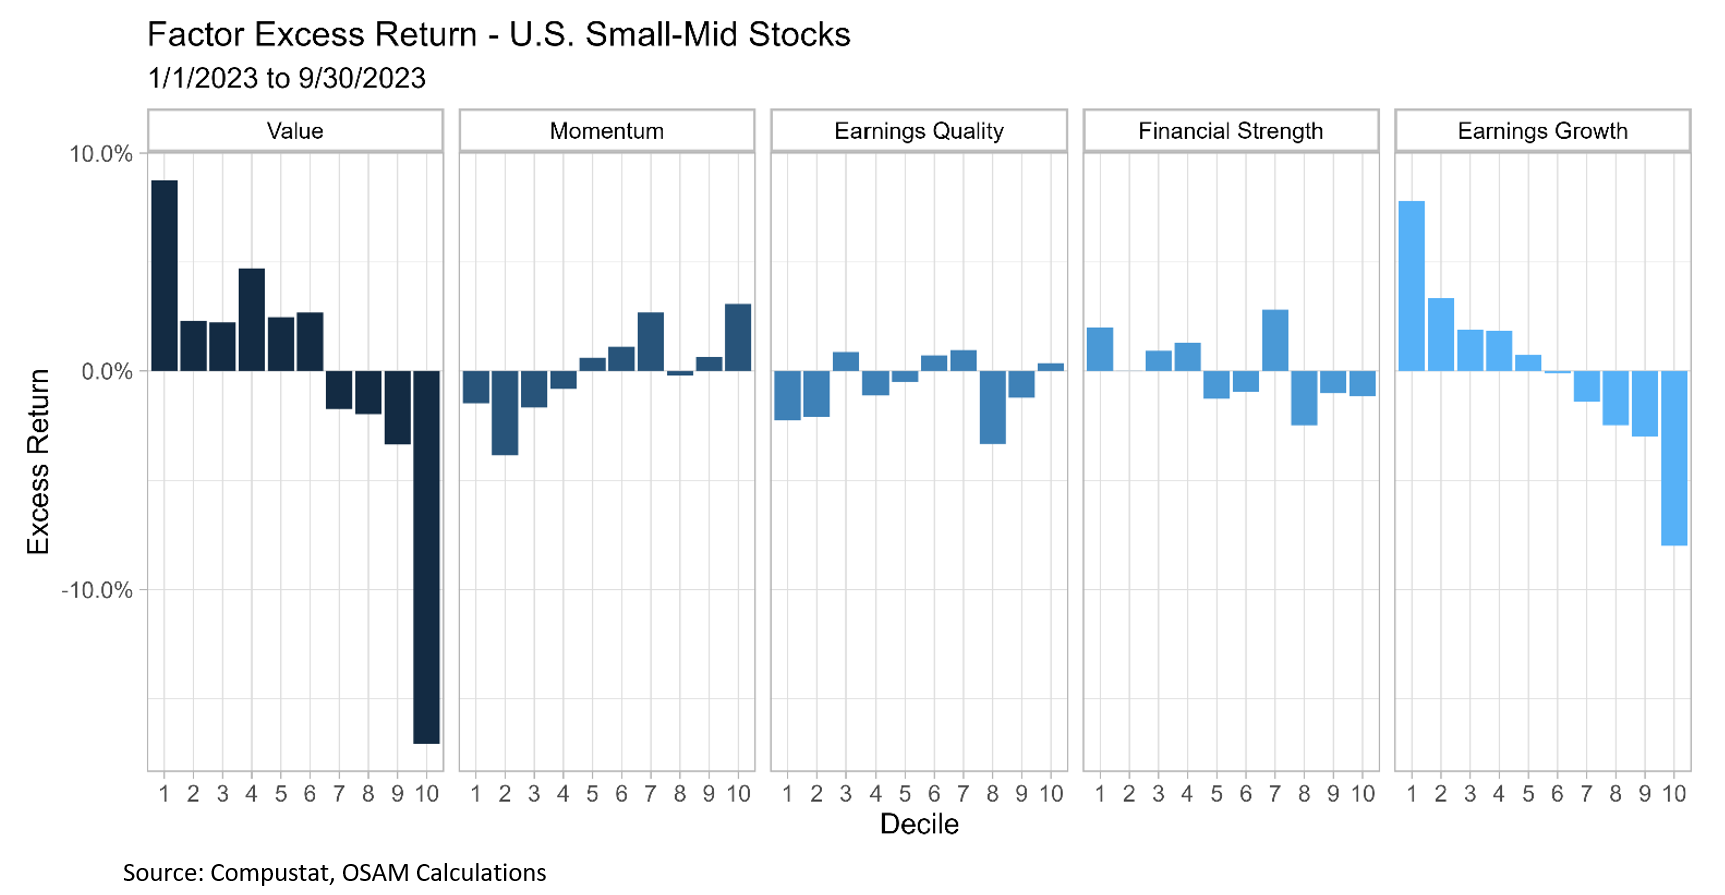
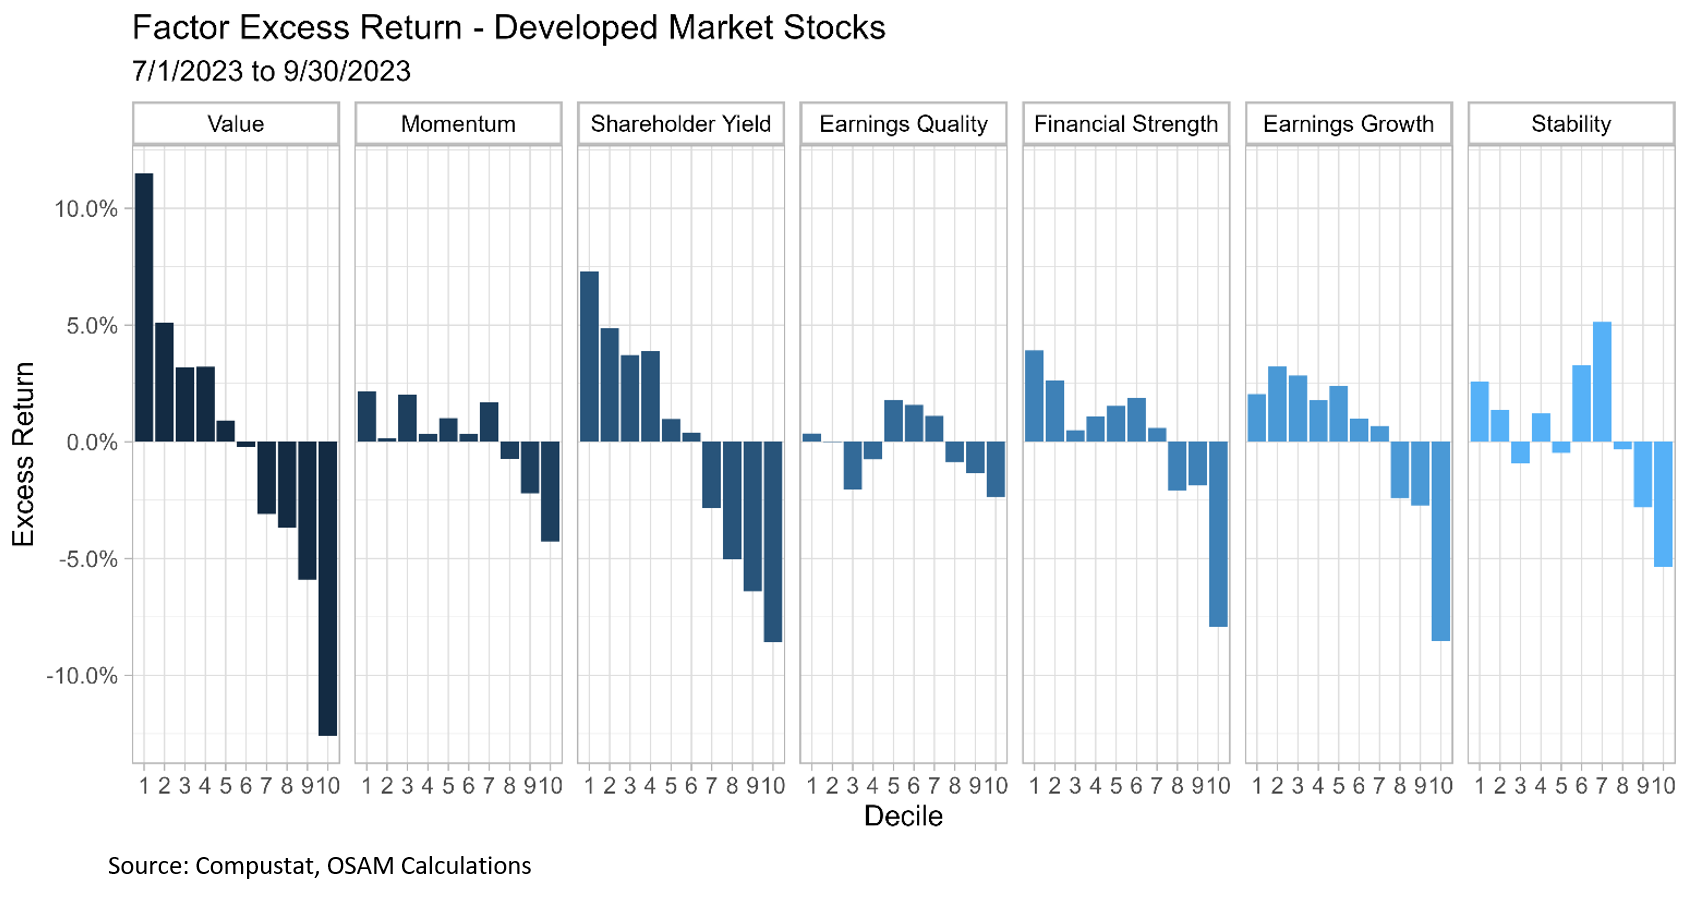
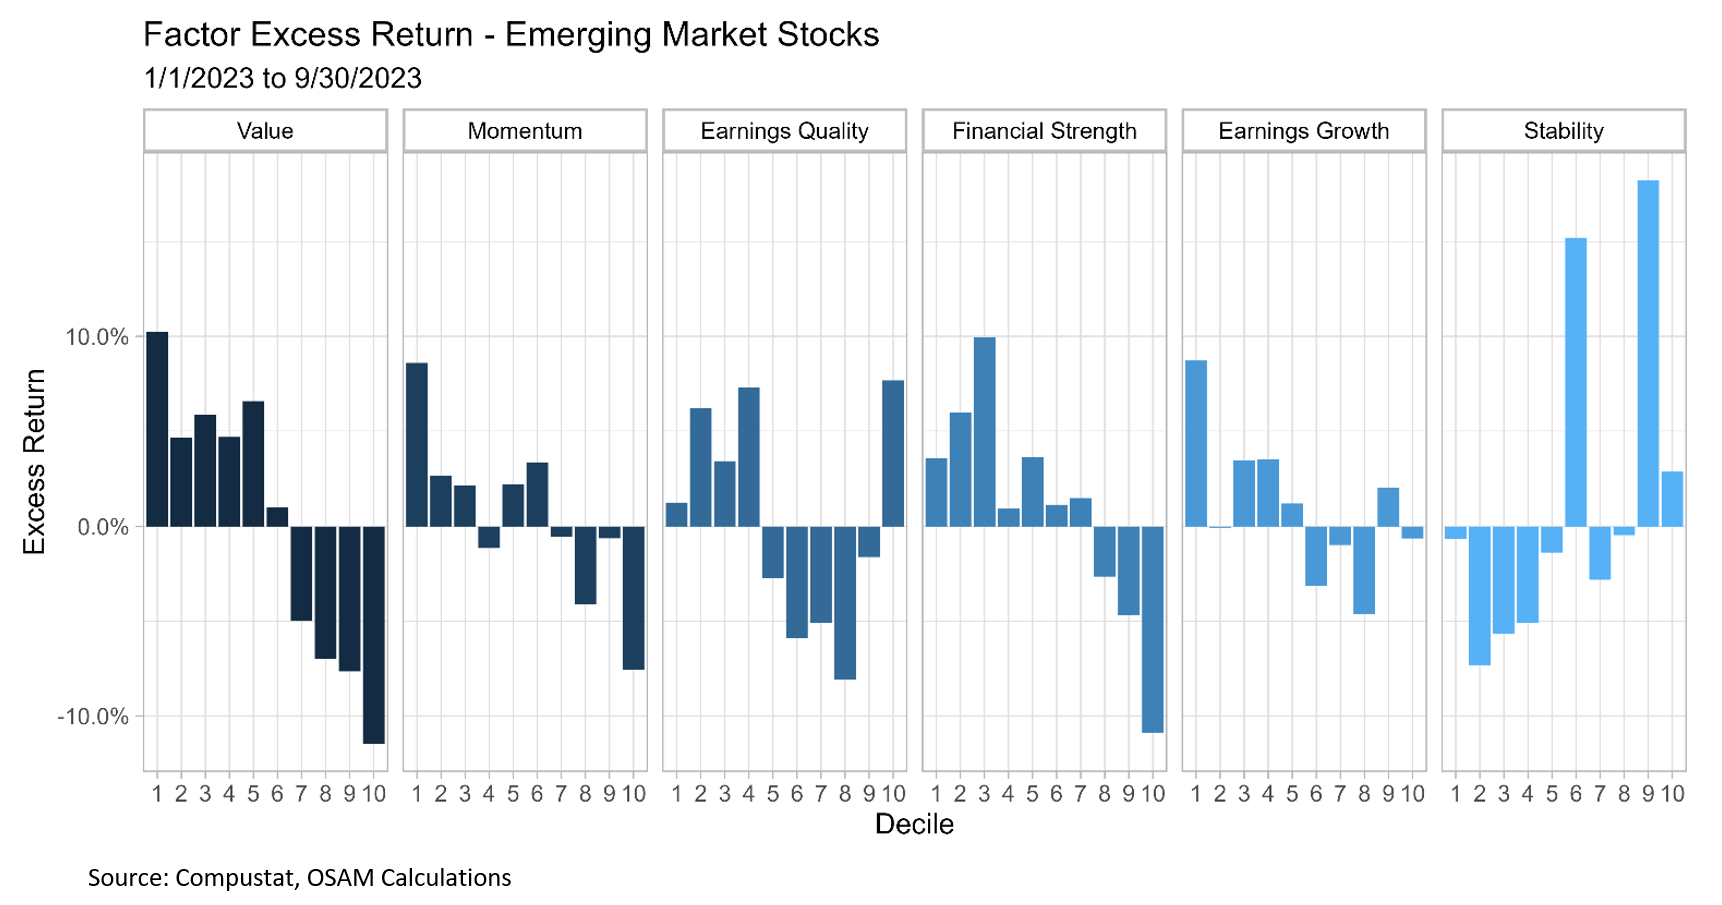
Despite high expectations for the tech complex, we saw a resumption of outperformance in our Value and Shareholder Yield factor themes for the 3rd quarter in the U.S. (see factor panels below). The two factors also delivered strong relative performance in developed markets. Stocks with high Quality rankings, as defined by our Earnings Quality, Financial Strength, and Earnings Growth themes broadly outperformed. Momentum continued to struggle in the U.S. as stocks with strong recent returns underperformed. This isn’t surprising given the ongoing rotations within the U.S. market. Within developed markets, momentum fared well and was a positive contributor.
The State of Financial Intermediation
Interest rate movements, global yield curve steepening, and regulatory data seem to indicate stress for financial intermediaries and a more challenging environment for credit availability moving forward.
On the financial side of the equation, specifically banks, the yield curve inversion is wreaking havoc, but is also unwinding in dramatic fashion. Steepening yield curves are historically emblematic of tighter credit conditions. The spread between the U.S. 10-Year and 3-Month Treasurys steepened from -1.8% in April to its current level of approximately -0.8%. Although the path and magnitude are different, similar steepening moves have occurred in European and Japanese rate markets.
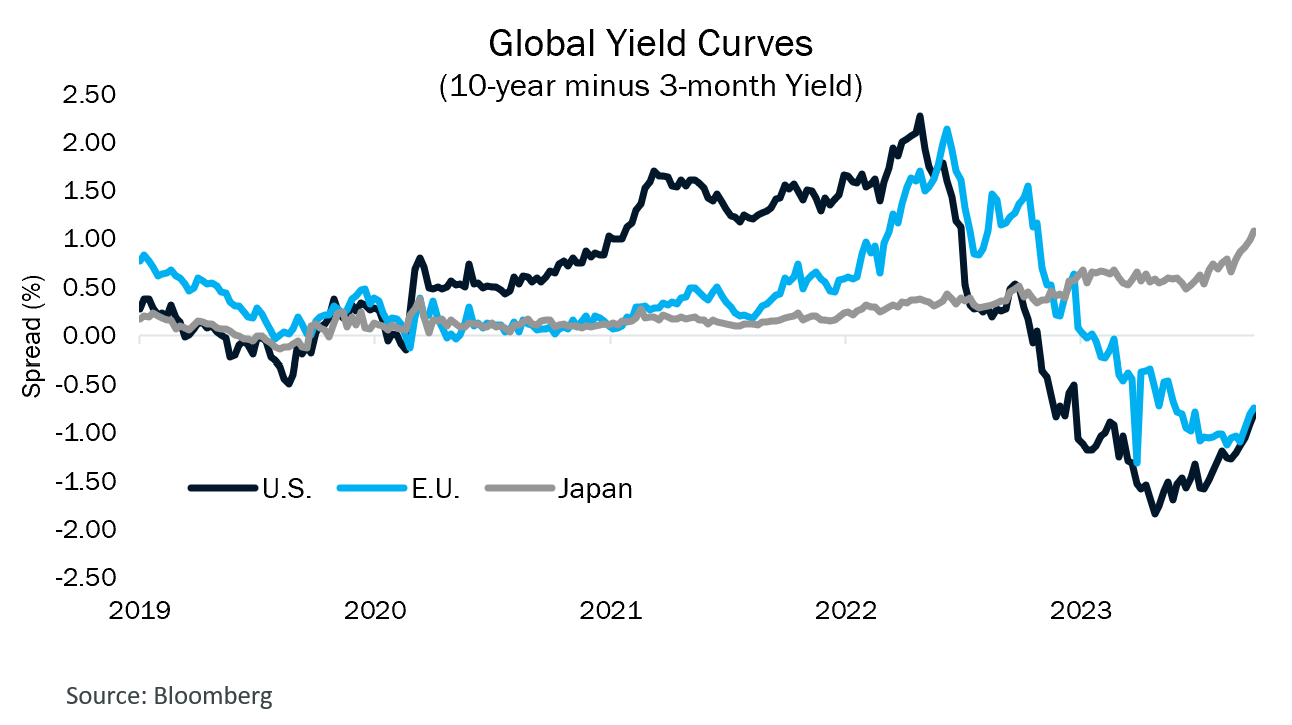
The U.S. inversion itself is notable, but not unprecedented in length or depth. Inversions were longer in 1973 and 1979, and deeper in the 1979 episode. That said, the fact that there are “only” two other comparable episodes over the last 7 decades is notable in and of itself.
Once you move away from the rungs of the giant money-center banks, the traditional business of borrowing short (deposits) and lending long (loans and securities) for regional and community banks has been under fire since the yield curve began flattening in May 2022. The toxic combination of a yield curve inversion, the massive deposit growth of the post-COVID era, surging interest rates, and exposure to long duration securities likely culminated in the banking crisis of the first quarter of 2023.
Absent the backstop of the Bank Term Funding Program (BTFP), non-GSIB6 banks would likely be in worse shape. $108 billion currently sits in the Fed program, which has grown in all but one week since early July.7 The program allows banks to post collateral at par value with a one-year maturity regardless of the market value of the assets, making it an effective capital injection into the banking sector.
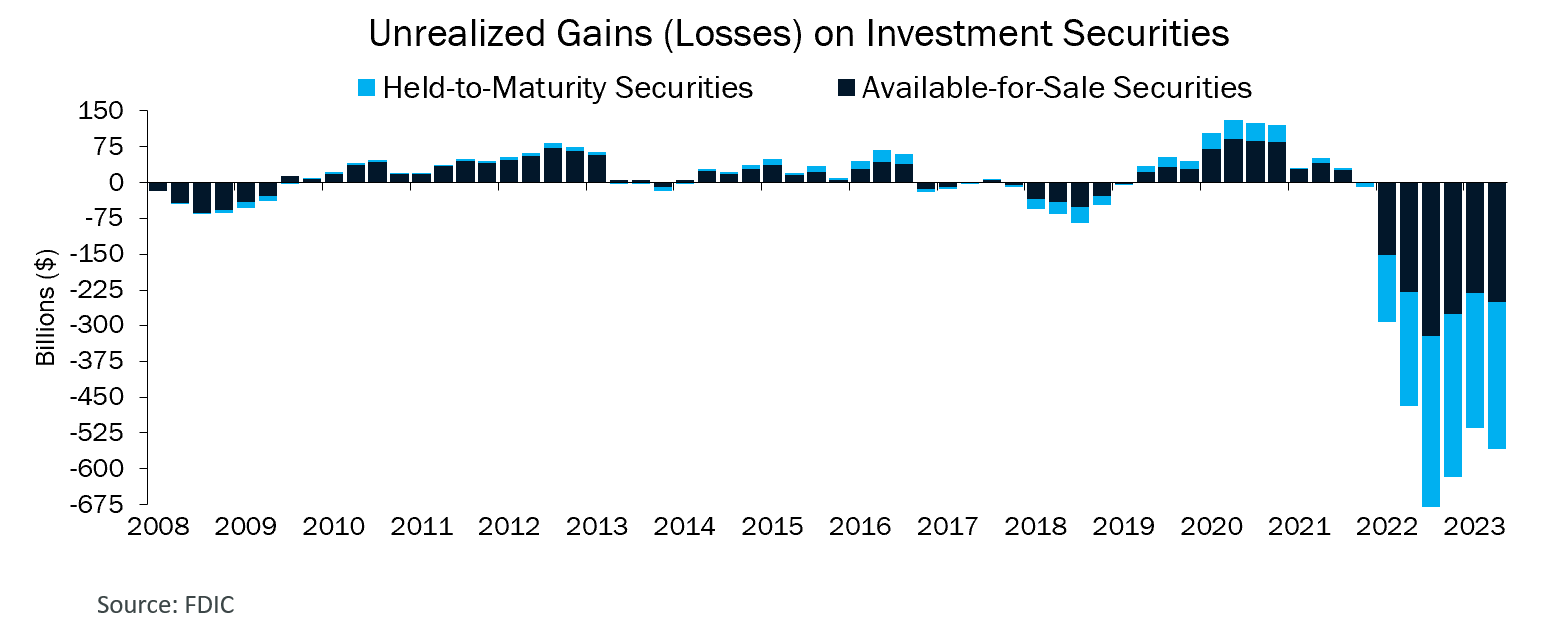
Banks holding substantial unrealized held-to-maturity losses were given the gift of time to move the securities off their books. Unrealized losses on bank balance sheets moderated as Treasury rates temporarily offered a respite (see chart below). The rise in interest rates in the 3rd quarter, however, has not been cooperative. One can only assume that the number of embedded losses will be rising as new FDIC data becomes available.
This matters because a constrained banking sector will inherently impair credit growth in the economy. Year-over-year credit growth has slowed to about half its post-WWII average. Outstanding consumer credit is now a lower percentage of GDP than it was pre-pandemic.8 This is another way of saying that credit conditions are beginning to get tighter.
Volatility – Calm on the Surface, Paddling Like the Dickens Underneath
For the previous several quarters, we have suggested that volatility could be elevated. For equity markets, volatility—as gauged by the VIX index—declined steadily throughout the year from a starting value of 32 to below 15 in mid-September. The exception was a spike in volatility during the Regional Banking Crisisi from March to May. Despite a decline in headline implied volatility, we’ve noticed realized volatility in two forms specifically.
First, volatility outside equity markets has been elevated this year, most notably in fixed income, currencies, and commodities. The 10-Year U.S. Treasury yield opened the year at 3.83%, fell to 3.25% and then ripped higher to 4.58%.9 The Japanese Yen has weakened from its high in 2023 by 18%.10 Oil opened the year at about $80 per barrel before falling to a low of $62.50 and then soaring to a high above $92 per barrel. These moves all appear to be reflective of the uncertain global growth and inflation dynamic. Though equity volatility seems comparatively low, volatility is manifesting in other assets.
The second area we have noticed volatility is increased dispersion within equity indices. The volatility of an index can be broken down into two key components—the raw volatility of stocks in the index and how correlated they are with each other. Dispersion helps measure the latter component by assessing how different the performance of constituents is from the overall index return while taking their relative weights into account.
While index volatility has been declining, dispersion within the Russell 1000 Index has shifted structurally higher. The chart below shows a measure of daily dispersion applied to the Russell 1000 Index and its constituents over the last 25 years.11 A higher percentile score on the vertical axis signifies higher dispersion. The phenomenon of higher dispersion has become so ingrained that the CBOE has recently launched derivative products allowing investors to take positions on the amount of implied dispersion in the S&P 500 index.12
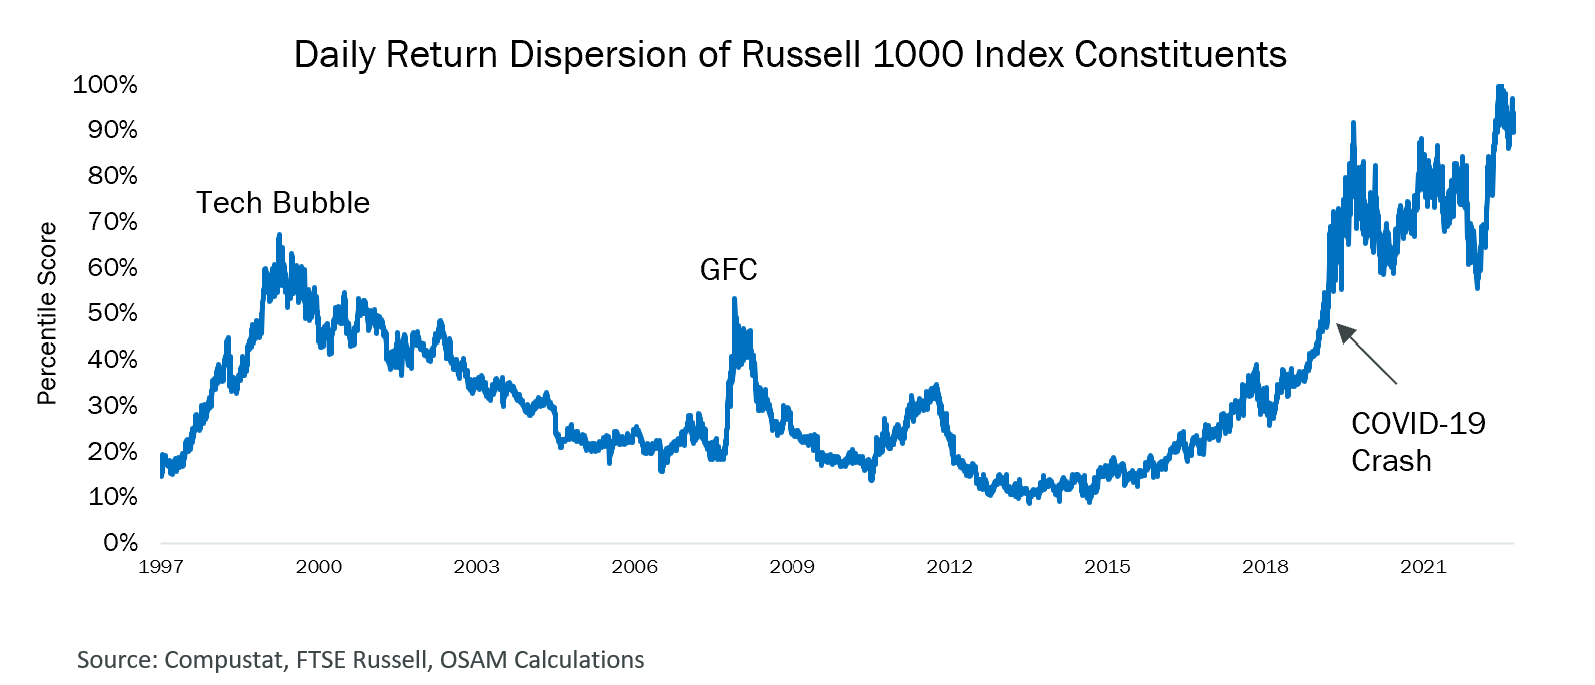
There are some interesting historical analogs in this chart. Dispersion peaked in March of 2000 just as equity indices rolled over into a multi-year bear market. From 1998-2000, the surge in dispersion was led by the Technology sector as it dramatically outperformed other index constituents. But dispersion fell lower in the run up to the Global Financial Crisis (GFC).
Dispersion peaked again in November 2008. The culprit in this episode were commodity markets. Oil peaked in the summer of 2008 at nearly $150 per barrel before falling to a low of $35 per barrel by the end of the year. During this period, the Energy sector diverged from the index with strong outperformance in the first half of the year and then strong underperformance in the second half.
In the chart above, notice that dispersion has been structurally increasing since about 2013 and currently sits just shy of an all-time high. Closer inspection reveals that this has been driven primarily by constituents of the Technology and Communication Services sectors as far back as 2008. In 2023, a surge of dispersion has been driven by the so-called “Magnificent Seven”.13 This phenomenon is an area of open research for us, notably because the same “winner-take-all” concentration does not exist outside the U.S. However, it is another data point supporting the very concentrated nature of market leadership in recent years.
The Monetary-Fiscal Tug of War
Much attention is given to monetary policy. Very little attention is given to the tug of war occurring between fiscal and monetary policy. We think this dynamic will be important for capital markets in the coming quarters. Since March of 2020, we believe stimulus has persisted in two broad phases—coordinated stimulus and stimulative push-pull.
Coordinated Stimulus (March 2020 - March 2022)
The chart below draws on data from the U.S. Treasury to generate a rolling 12-month view of Deficit spending (blue line) as compared to the Effective Fed Funds rate (grey). As of March 2020, there was approximately $1 trillion in deficit spending over the prior 12 months. Over the next 12 months, fiscal deficit spending would accelerate to $4.1 trillion!
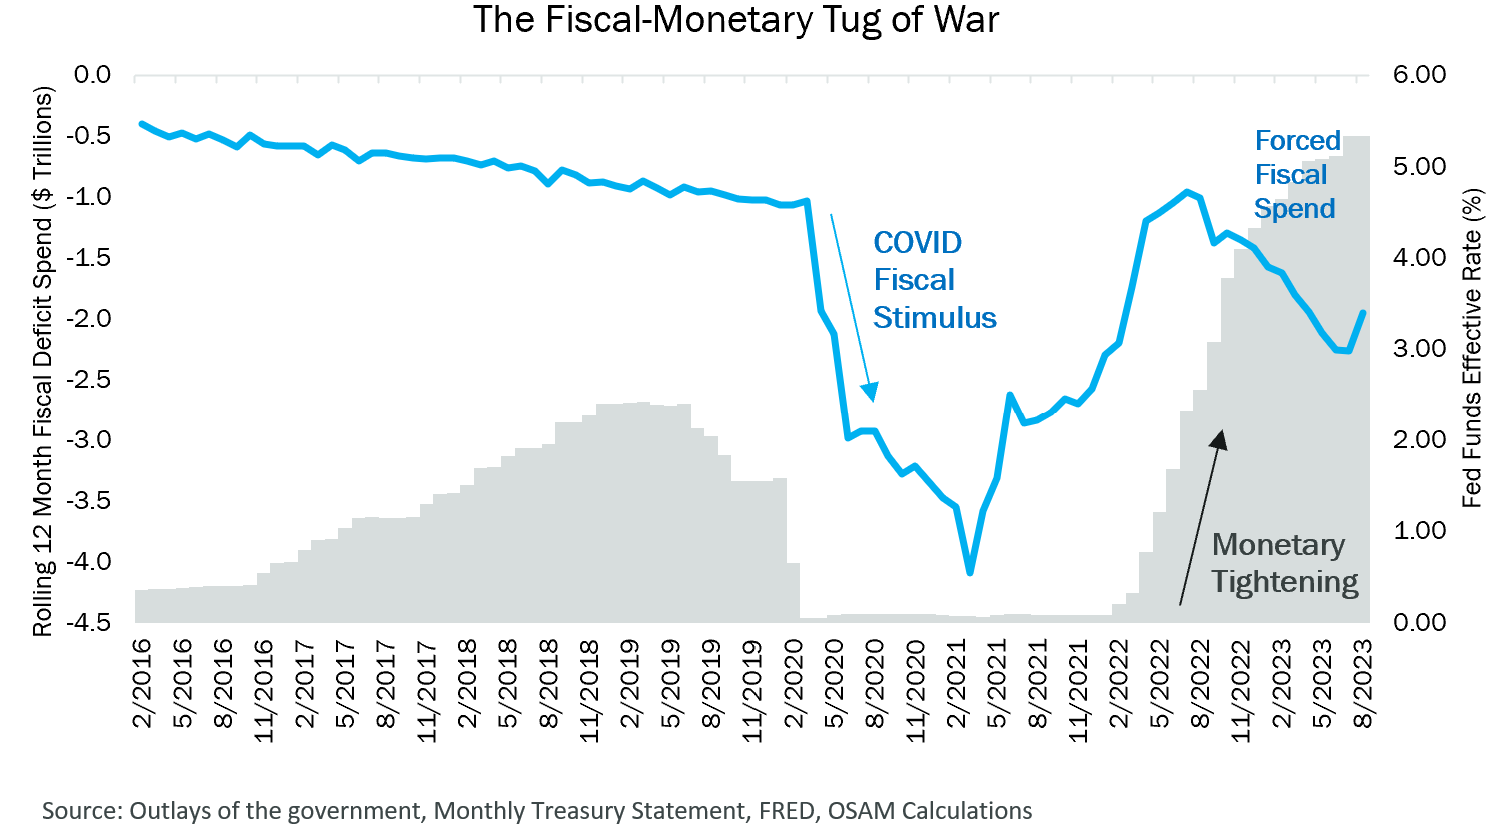
This deficit surge was the initial source of “excess COVID savings” that shored-up consumer balance sheets and fueled massive deposit growth in the banking sector that we referred to when discussing the state of financial intermediation. During this period, fiscal and monetary policy were coordinated and extremely accommodative to counteract the COVID-induced demand and supply shocks reverberating through the economy. During this period of coordinated stimulus, the S&P 500 rose approximately 113%!
Stimulative Push-Pull (March 2022 – September 2023)
Though fiscal deficit spending was still high, its impact tapered from March 2021 until August 2022. At that point, fiscal spending had reverted to its pre-COVID level of about $1 trillion per year. The waning fiscal impulse converged with surging gasoline prices over the same period to somewhat mitigate the remaining fiscal stimulus. In October 2021, the Biden administration took dead aim and began releasing from the Strategic Petroleum Reserve (SPR)—another form of fiscal stimulus—to lower gas prices.
On the monetary side of the ledger, March 2022 was the first in an extensive string of rate hikes that brought the Fed Funds rate from 0% to 5.5%. A few months later, the FOMC initiated a program of Quantitative Tightening (QT), which so far has reduced its balance sheet by $785 billion.14 Further, the FOMC has consistently used Forward Guidance to point to continued monetary tightening.15 With one exception, the BTFP, monetary policy has shifted to wholly restrictive. Some observers have even suggested that if inflation continues to drift lower, the Fed will need to cut rates just to ensure it does not become overly restrictive.
During the push-pull period, monetary and fiscal policy have been at odds. The S&P 500 is cumulatively down about 7% but saw as much as a 22% drawdown in the Stimulative Push-Pull period. The tide may be changing one more time to an inflationary push-pull dynamic.
Inflation Wildcards
The nature of the relationship between fiscal and monetary policy on a go-forward basis will largely be determined by inflation dynamics. If inflation rises, the two entities could be in conflict. If inflation falls, they will likely be aligned. The wildcards in that relationship will likely be wages, oil prices, and the deficit as they are forcing functions for policy action.
Comments from Fed Chair Powell on September 20th and the Summary of Economic Projections (SEP) seemed to suggest that the Fed is focused on its price stability mandate if labor market strength remains.
Wages
On the fiscal side, the current administration will likely continue to advocate strongly for the American worker via wage hikes and for pro-labor policies—most notably as we stroll into an election season. We have seen this manifest so far in various forms—union wage negotiations, minimum wage legislation in certain states, and some of the most prolific strikes in history. For policymakers, the track record on economic turbulence during election years is clear. Of the 19 elections since World War II, five have featured a recession in the election year and four of those resulted in the presidential party in power relinquishing control.16
Whether you look at initial jobless claims, continuing claims, the unemployment rate, job openings, etc., the evidence is clear that the U.S. labor market is secularly tight. Current labor negotiations and administration support would seem to suggest upward pressure on wages for the foreseeable future, a politically expedient eventuality that would run contrary to the FOMC’s price stability mandate.
Oil
Another key wildcard is the price of oil. A rise in oil and gas prices could re-awaken the specter of inflation. The 2021/2022 release from the SPR was objectively effective in that the surge in oil and gas prices was curtailed. This was a boon to consumers in the U.S., aided the FOMC’s domestic inflation fight, and aided other Central Banks with their own battle for growth and against inflation. The last point is an important one, and a feature of the post-COVID regime.
Due to the shale revolution, the U.S. energy situation has massively transformed since the GFC. In 2011, the U.S. was the largest energy importer globally.17 By 2019, the U.S. became a net energy exporter, primarily driven by rising exports of natural gas and petroleum products. In 2022, U.S. energy production exceeded total energy consumption!18 And this occurred despite unfriendly macro headwinds for the fossil fuel sector.
While the U.S. now falls on the more favorable side of the global energy balance, Europe and Asia fall on the opposite end of the scale. The chart below shows the Balance of Trade across various regions. The balance of net exporters is shown as a negative number, while net importers are represented by a positive number.
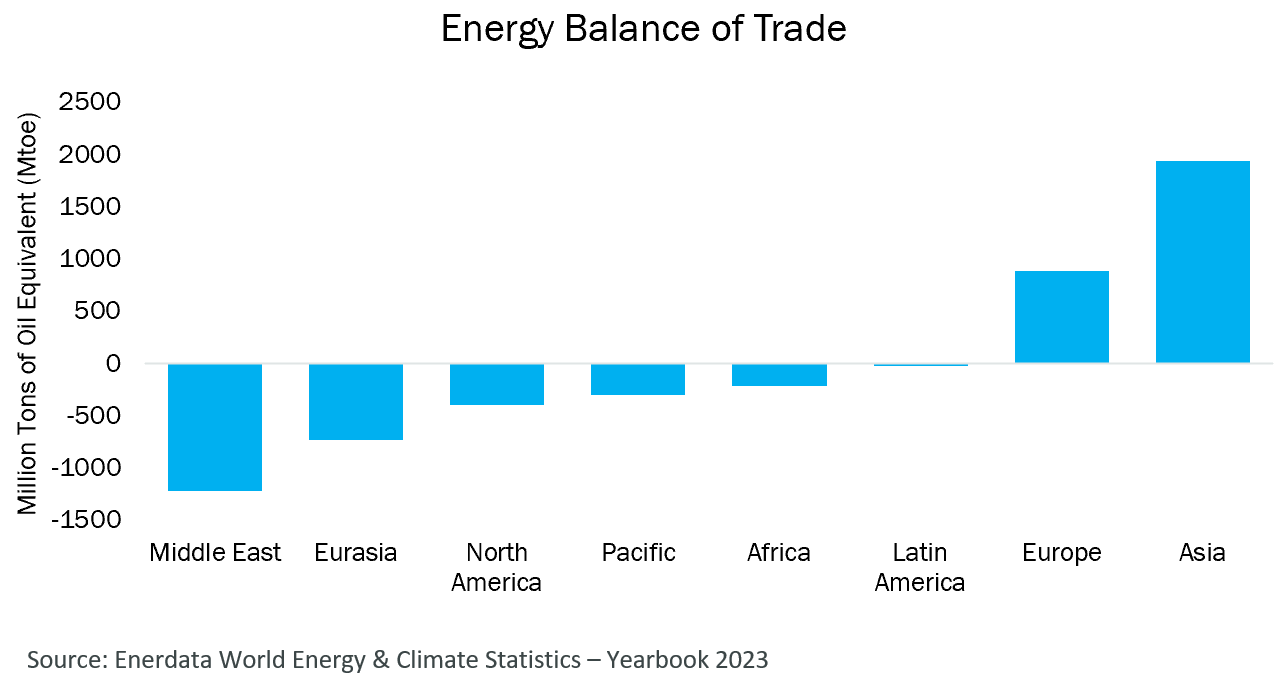
A rise in the price of oil generally hurts net importers and provides an economic tailwind to net exporters. An especially pernicious situation for net importers would be a rise in the price of oil in combination with a strengthening of the U.S. dollar relative to their local currency. This has the dual impact of importing inflation and damaging economic growth as the cost of raw inputs rises—something with which both Europe and Asia are struggling. The relief valve for both regions has been a weakening of currencies (Sterling, Euro, Yen, and Yuan).
Rising oil prices present a unique problem for the global economy. Energy infrastructure has been underinvested for years. Monetary policy has no direct control of energy prices. Fiscal authorities may not have much gas in the tank given the recent drain in SPR reserves. Absent a method to compel U.S. producers to produce more, or reversing administration policy on natural resources, the sole entity with the ability to scale production up and down is OPEC.
Deficit
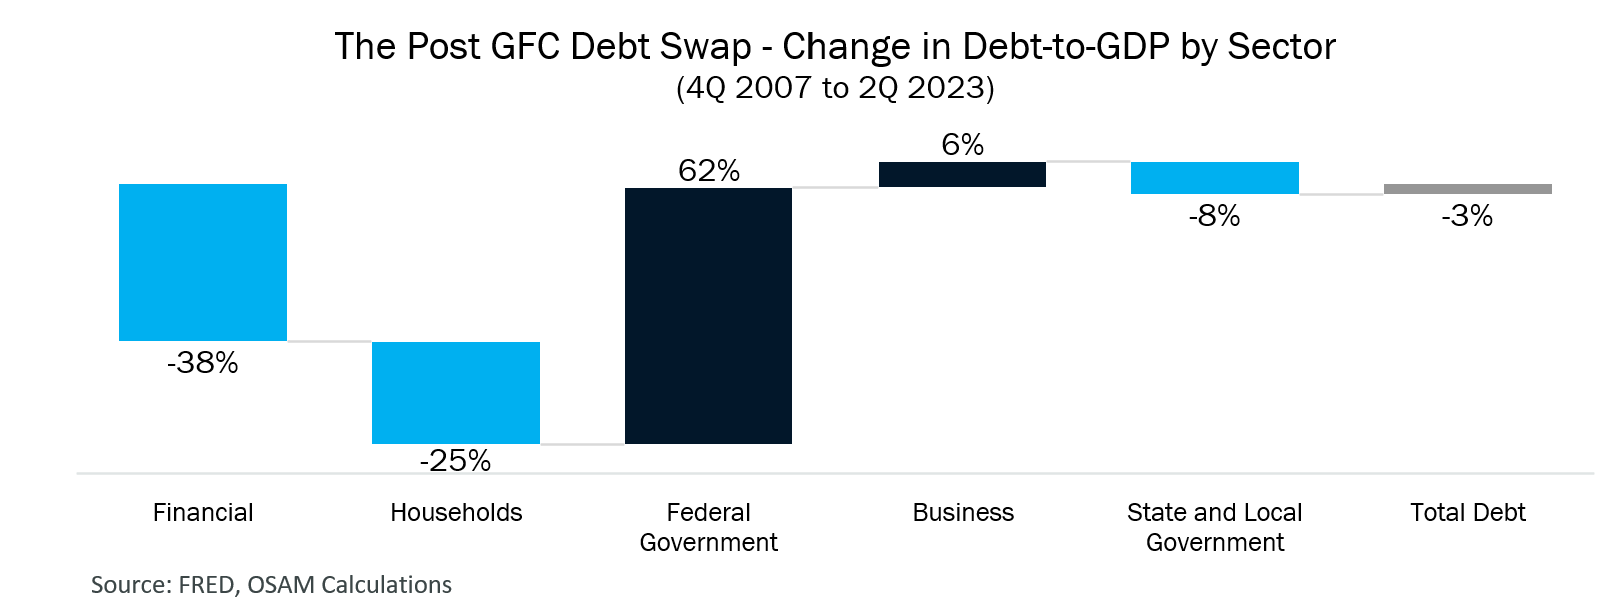
U.S. public sector debt-to-GDP sits at 119%—a level last seen in the aftermath of WWII.19 Though that number seems high, it's much worse when you factor in debt from the private sector. On that basis, debt-to-GDP is 356%, well above the post-WWII highs, but effectively flat since 2007. When broken down by sector in the chart below, the Federal Government has effectively taken on the debt burden that hampered Households and Financials during the GFC.
As of the 2nd quarter, interest payments on the debt are running at a $909.6 Billion annual pace, a 61% increase since the end of 2019.20 As Congress continues to debate spending bills, Treasury issues debt to cover already agreed upon spending, and Treasury auctions are showing signs of strain, there could be a moment at which fiscal austerity becomes the buzz word on Capitol Hill.
A welcome alternative for policymakers would be the ability to engineer a scenario where nominal GDP annualizes above the prevailing rate on long-term debt. This would allow debt-to-GDP levels to fall naturally over time as the economy grows—the ultimate soft-landing.
Outlook
Where does this all lead? To be fair, we aren’t exactly sure about the short term. In the long term, we don’t think the current situation is a stable equilibrium. Equity valuations are high relative to comparable risk-free assets, historical valuations, and the uncertainty inherent in the economic outlook. These imbalances could be resolved through a price correction, changes in growth expectations, through the passage of time as fundamentals “catch up” to valuations, or some combination of each.
As we have discussed in previous updates, long-duration Treasuries tend to be positively correlated with stocks when inflation is elevated. Treasury bond yields are composed of two broad components, the future path of short-term interest rates, and a term premium. The term premium is the compensation investors require for the uncertainty around changes in the path of rates over the life of a bond. When the path for inflation is less certain, as it is currently, term premiums historically rise, as they have in earnest since May of this year. This suggests that duration may not be the “hedge” in portfolios that it has been over the last two decades.
Seasonally, the 4th quarter is historically a strong period for stocks with November and December being the two highest ranked months on average back to 1964. However, there are headwinds from large structural flows on the fixed income side. According to the August Quarterly Refunding Announcement (QRA), the U.S. Treasury will be issuing about $280 billion in October. This will bring cumulative Treasury issuance for the year to $2.6 trillion with a few more months to go! Though the supply has been absorbed by the bond market, it is notable that the yield curve has steepened, and Treasury auctions have struggled to attract buyers recently. As the fiscal climate gets a bit more tense, Treasury auctions may become an important data point to watch heading into 2024.
Given the balance of factors, we continue to believe that multiple compression for equities is a likely scenario, and that volatility will remain the name of the game for the next several quarters. As such, allocations that favor quality and low volatility may be advantageous. Quality can be measured in multiple ways. We tend to measure it from three perspectives—Earnings Quality, Financial Strength, and Earnings Growth.
We continue to favor Value and Shareholder Yield for active allocations on a longer-term basis as inflation dynamics and a steepening yield curve tend to be supportive of sectors that are overweight within those factors—Industrials, Energy, Materials, Financials. Further, a protracted period of higher rates could be a headwind to corners of the market typically associated with “long duration”, i.e., relatively expensive growth stocks.
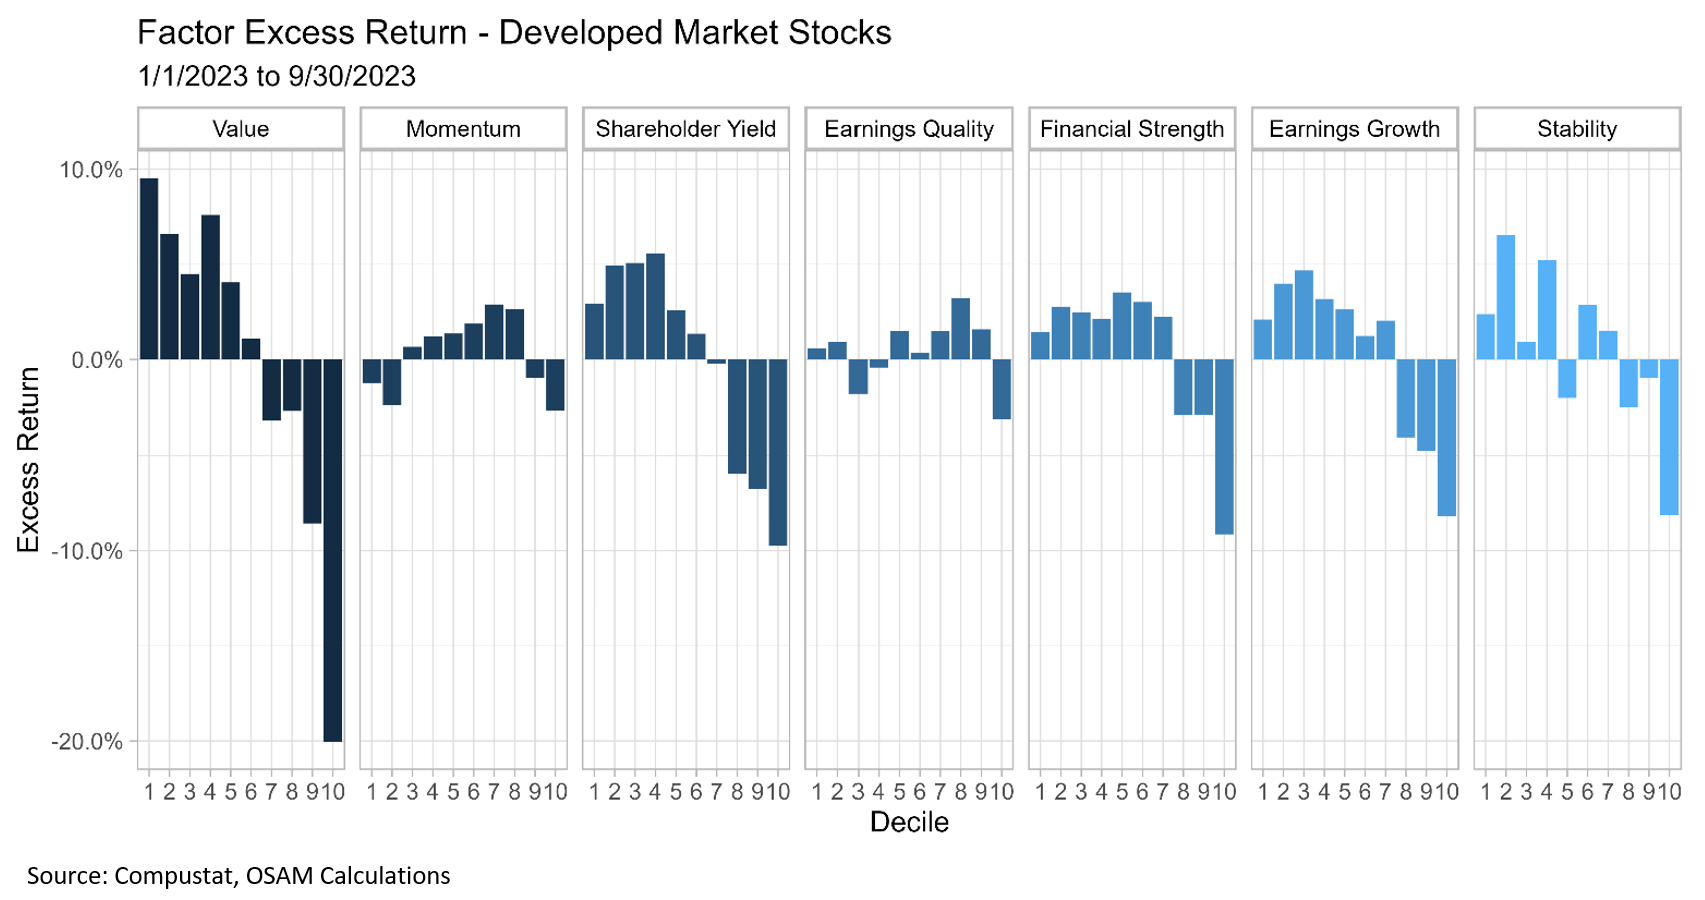
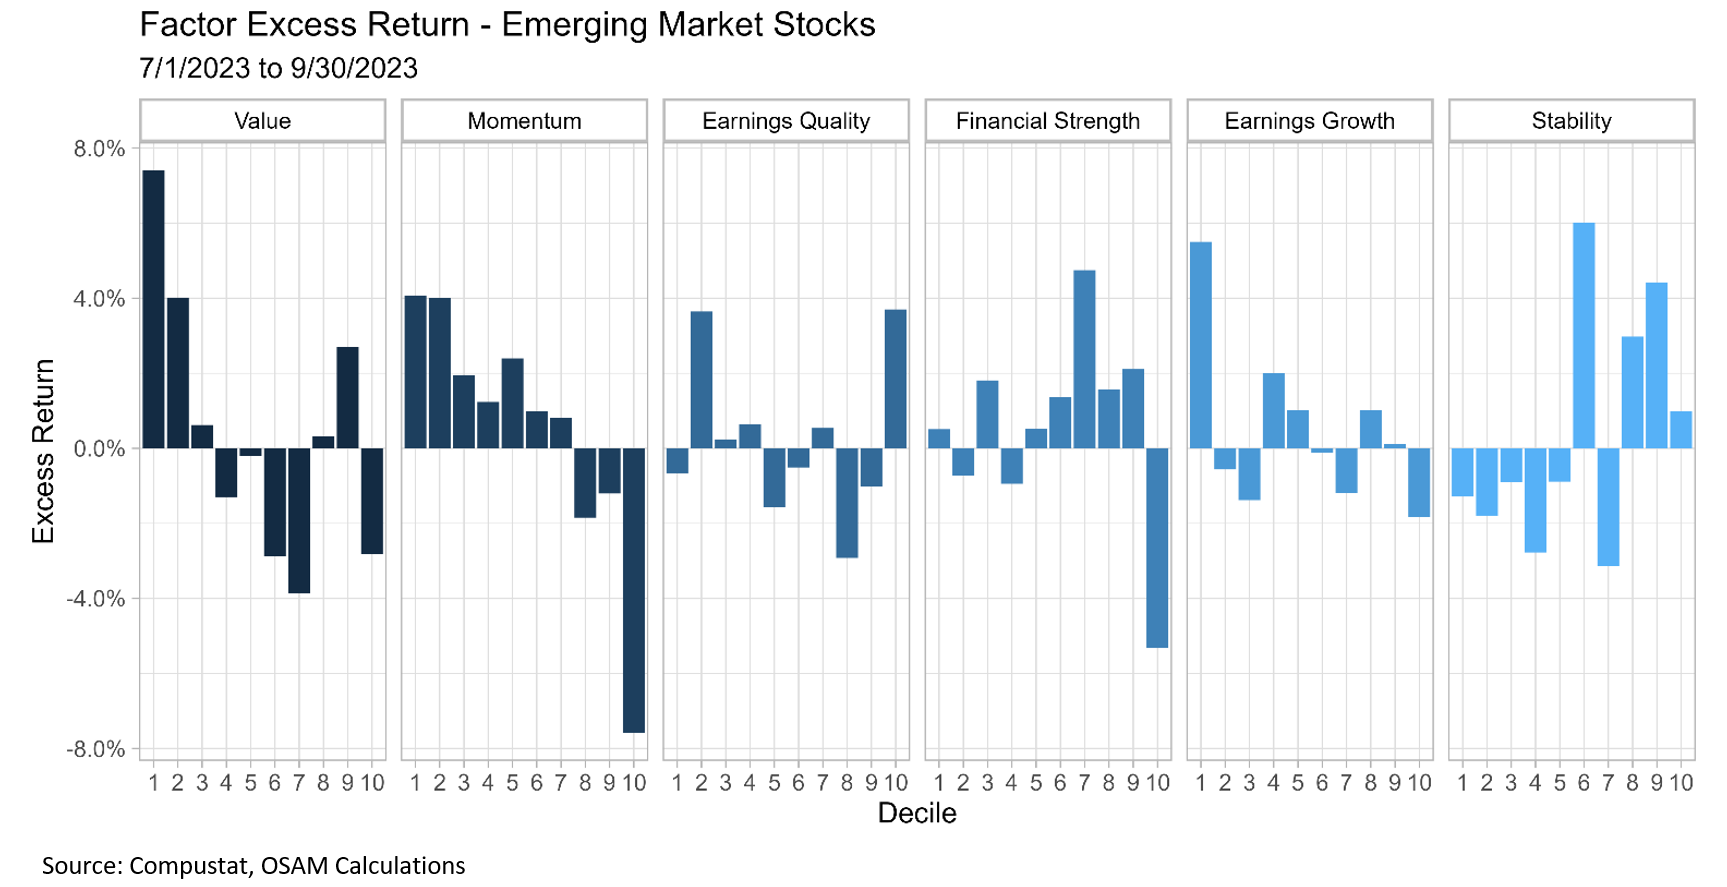
Factor Performance
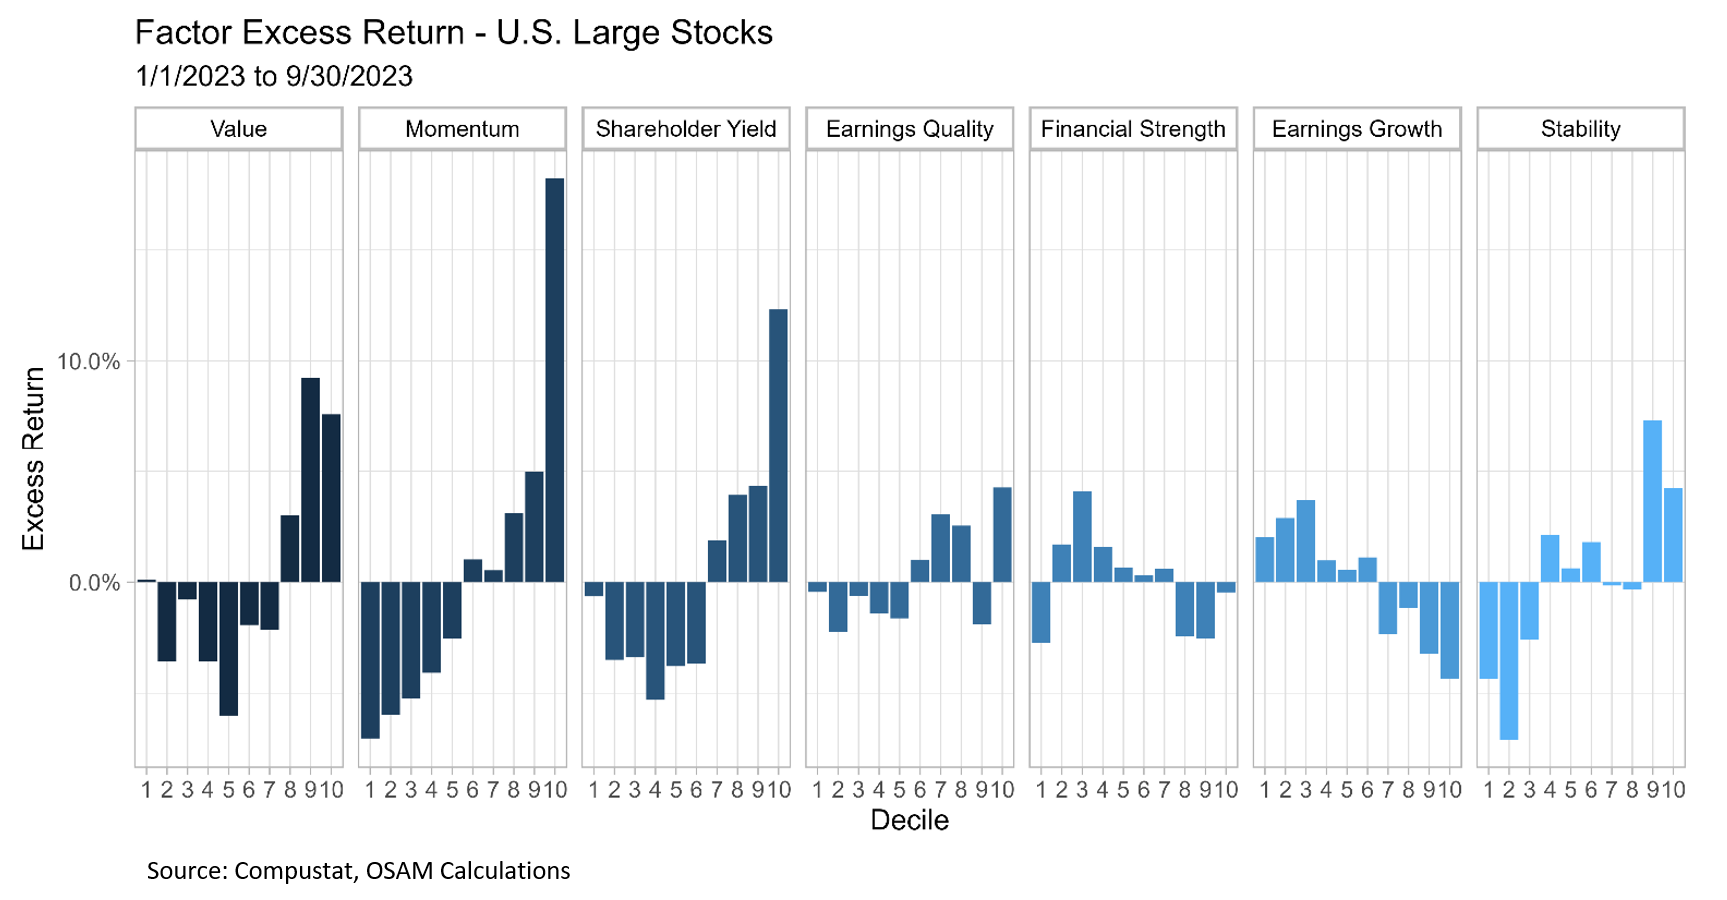
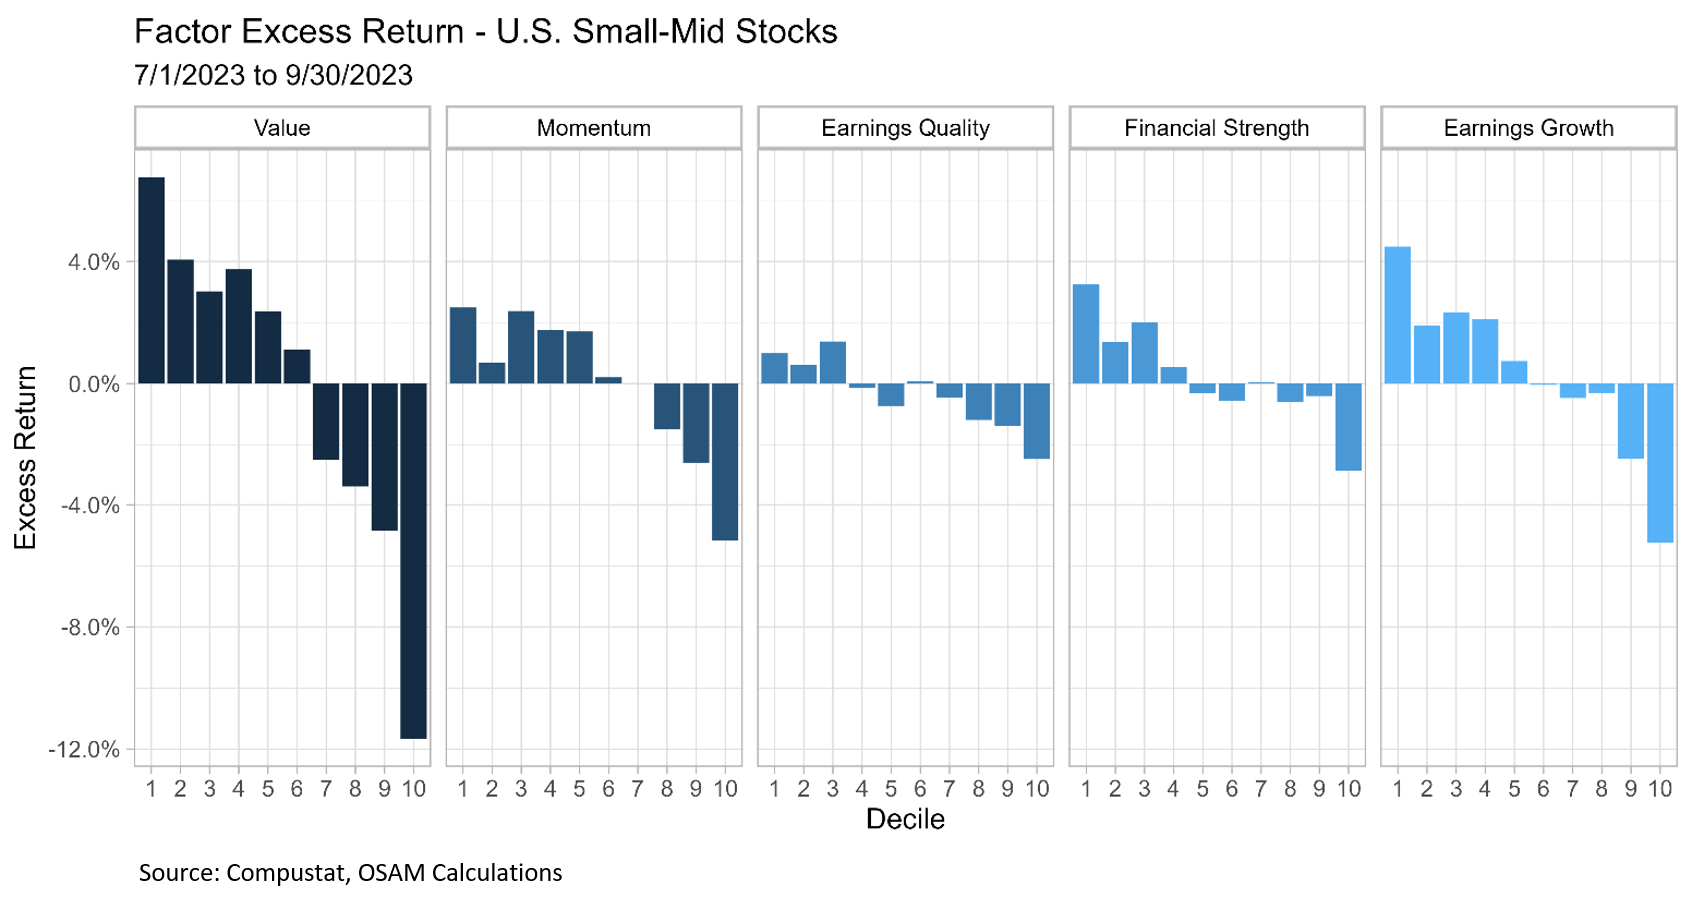
The charts below show the excess performance of the factor themes we monitor within each of our stock universes. We think of Value, Momentum, and Shareholder Yield as selection factors—helping identify stocks we want to own and overweight for generating total return. Earnings Quality, Financial Strength, and Earnings Growth are quality factors that allow us to avoid stocks with non-cash driven earnings, weak balance sheets, and questionable underlying businesses. Stability is a selection factor for identifying stocks that tend to exhibit lower volatility and historically provide improved downside capture during market drawdowns. Column 1 for each of the panels represents the highest-ranking stocks on each factor while column 10 shows the lowest ranking. Historically, owning the highest ranked stocks and avoiding the lowest ranked stocks has resulted in successful investment outcomes.
U.S. Large Stocks
U.S. Small-Mid Stocks
Developed Markets ADR All Stocks
Emerging Markets ADR All Stocks
Dividend Growth
FOOTNOTES
1 As of 6/30/2023. FRED, OSAM Calculations
2 FRED, National Association of Realtors, Bloomberg.
3 7/31/2023. Bureau of Labor Statistics. OSAM Calculations.
4 As of 8/31/2023. Compustat, OSAM Calculations.
5 S&P Dow Jones, S&P 500 Earnings and Estimate Report, 9/13/2023.
6 Global Systemically Important Banks
7 As of 9/29/2023, FRED.
8 Total Consumer Credit Owned and Securitized-to-GDP through 2Q 2023. FRED.
9 FRED, as of 9/29/2023.
10 Ibid.
11 Dispersion is measured as the square root of the sum of squared weighted constituent return differences from the index return.
12 https://www.cboe.com/us/indices/dispersion
i Regional Banking Crisis – the period from March to May 2023 when SVB, Signature Bank and First Republic were placed into receivership or acquired.
13 Apple (AAPL), Amazon.com (AMZN), Alphabet (GOOGL), Meta Platforms (META), Microsoft (MSFT), Nvidia (NVDA), and Tesla (TSLA)
14 FRED. As of 8/31/23.
15 Forward guidance refers to central bank communication about the likely future path of short-term interest rates.
16 National Bureau of Economic Research. FRED. OSAM Calculations.
17 Enerdata World Energy & Climate Statistics - Yearbook 2023
18 U.S. Energy Information Administration
19 As of 6/30/2023. FRED.
20 FRED
O'SHAUGHNESSY ASSET MANAGEMENT, L.L.C. CANVAS® PLATFORM
IMPORTANT DISCLOSURE INFORMATION (revised as of March-2023)
CANVAS® is an interactive web-based investment tool developed by O’Shaughnessy Asset Management, L.L.C. (“OSAM”) that permits an investment professional (generally a registered investment advisor or a sophisticated investor) to select a desired investment strategy for the professional’s client. At all times, the investment professional, and not OSAM, is responsible for determining the initial and ongoing suitability of any investment strategy for the investment professional’s underlying client. The professional’s client shall not rely on OSAM for any such initial or subsequent review or determination. Rather, to the contrary, at all times the professional shall remain exclusively responsible for same. See MORE ABOUT CANVAS below and Release and Hold Harmless at the end of this Important Disclosure Information.
Reliance on Investment Professional: OSAM has relied, and shall continue to rely, on the investment professional’s knowledge and experience to understand the inherent limitations of the performance presentation, including those pertaining to back-tested hypothetical performance. All performance presentations, including hypothetical performance, are the direct result of the investment professional’s request, independent of OSAM. Depending upon the investment professional’s direction and selection, hypothetical presentations can include both OSAM and non-OSAM Models and/or strategies. The below discussion as to the material limitations of back-tested hypotheticals apply to both OSAM and non-OSAM Models and/or strategies.
Intended Recipient: CANVAS content is intended for the investment professional only not to be shared with an underlying client unless in conjunction with a meeting between the investment professional and its client in a one-on-one setting. OSAM assumes that no hypothetical performance-related content will be provided directly to the professional’s client without the accompanying consultation and explanation of the professional. The content is intended to assist the professional in evaluating the appropriate investment strategy for the professional’s client.
OSAM Models: OSAM has devised various investment models (the “Models”) for CANVAS, the objectives of each are described herein. The investment professional is not obligated to consider or utilize any of the Models. As indicated above, at all times, the investment professional, and not OSAM, is responsible for determining the initial and ongoing suitability of any Model for the investment professional’s underlying client. Model performance reflects the reinvestment of dividends and other account earnings and are presented both net of the maximum OSAM’s investment management fee for the selected strategy and gross of an OSAM investment management fee. Please Note: As indicated at Item 5 of its written disclosure Brochure, OSAM’s CANVAS management fee ranges from 0.20% to 1.15%. The average percentage management fee for all CANVAS strategies is 0.29%. The percentage OSAM management fee shall depend upon the type of strategy and the corresponding amount of assets invested in the strategy; generally, the greater the amount of assets, the lower the percentage management fee. Please Also Note: The performance also do not reflect deduction of transaction and/or custodial fees (to the extent applicable), the incurrence of which would further decrease the performance. For example, if reviewing a strategy with a ten-year return of 10.0% each year, the effect of a 0.10% transaction/custodial fee would reduce the reflected cumulative returns from 10.0% to 9.9% on a 1 year basis, 33.1% to 32.7% on a 3 year basis, 61.1% to 60.3% on a 5 year basis and 159.4% to 156.8% on a 10 year basis respectively. Please Further Note: Transaction/custodial fees will differ depending upon the account broker-dealer/custodian utilized. While some broker-dealers/custodians do not charge transaction fees for individual equity (including ETF) transactions, others do. Some custodians charge fixed fees for custody and execution services. Choice of custodian is determined by the investment professional and his/her/its client. Higher fees will adversely impact account performance.
OSAM does not maintain actual historical performance results for the Models. In order to help assist the investment professional in determining whether a Model is appropriate for the professional’s client, OSAM has provided back-tested hypothetical (i.e., not actual) performance for the Model. OSAM, with minor deviations that it does not consider to be material*, currently uses the Models (i.e., live models vs. the reflected back-tested versions thereof) to manage actual client portfolios (see Model Deviations below). The performance reflects the current Model holdings, which are subject to ongoing change.
Material Limitations: The Performance is subject to material limitations. Please see Hypothetical/Material Limitations below. During any specific point in time or time-period, the Models, as currently comprised, performed better or worse, with more or less volatility, than corresponding recognized comparative indices, benchmarks or blends thereof.
Past performance may not be indicative of future results. Therefore, it should not be assumed that future performance of any specific investment or investment strategy (including the Models), will be profitable, equal any historical index or blended index performance level(s), or prove successful. Historical index results do not reflect the deduction of transaction and custodial charges, or the deduction of an investment management fee, the incurrence of which would have the effect of decreasing indicated historical performance results. The Russell 3000 is a market capitalization-weighted index of 3000 widely held large, mid, and small cap stocks. Russell chooses the member companies for the Russell 3000 based on market size and liquidity. The MSCI All Country World Index is a market capitalization weighted index designed to provide a broad measure of equity-market performance throughout the world. The MSCI is maintained by Morgan Stanley Capital International and is comprised of stocks from 23 developed countries and 24 emerging markets. The Barclays Capital Aggregate Bond Index is a market capitalization-weighted index, meaning the securities in the index are weighted according to the market size of each bond type. Most U.S. traded investment grade bonds are represented. Municipal bonds and Treasury Inflation-Protected Securities are excluded, due to tax treatment issues. The index includes Treasury securities, Government agency bonds, Mortgage-backed bonds, corporate bonds, and a small amount of foreign bonds traded in U.S. The historical performance results for the Russell 3000, MSCI and Barclays are provided exclusively for comparison purposes only, to provide general comparative information to help assist in determining whether a Model or other type strategy (relative to the reflected indices) is appropriate for his/her investment objective and risk tolerance. Please Also Note: (1) Performance does not reflect the impact of client-incurred taxes; (2) Neither Model or the selected strategy holdings correspond directly to any such comparative index; and (3) comparative indices may be more or less volatile than the Model or selected strategy.
Hypothetical/Material Limitations: Performance reflects hypothetical back-tested results that were achieved by means of the retroactive application of a back-tested portfolio and, as such, the corresponding results have inherent limitations, including: (a) the performance results do not reflect the results of actual trading using investor assets, but were achieved by means of the retroactive application of the Model or strategy (as currently comprised), aspects of which may have been designed with the benefit of hindsight; (b) back tested performance may not reflect the impact that any material market or economic factors might have had on OSAM’s (or the investment professional’s) investment decisions for the Model or the strategy; and, correspondingly; (c) had OSAM used the Model to manage actual client assets (or had the investment professional used the selected strategy to manage actual client assets) during the corresponding time periods, actual performance results could have been materially different for various reasons including variances in the investment management fee incurred, transaction dates, rebalancing dates (increases account turnover), market fluctuation, tax considerations (including tax-loss harvesting-increases account turnover), and the date on which a client engaged OSAM’s investment management services.
MORE ABOUT CANVAS®
CANVAS is an interactive web-based investment tool developed by O’Shaughnessy Asset Management, L.L.C. (“OSAM”) that permits an investment professional (generally a registered investment advisor or a sophisticated investor) to select a desired investment strategy (the “Strategy”) for the professional’s client. At all times, the investment professional, and not OSAM, is responsible maintaining the initial and ongoing relationship with the underlying client and rendering individualized investment advice to the client. In addition, the investment professional and not OSAM, is exclusively responsible for:
- determining the initial and ongoing suitability of the Strategy for the client;
- devising or determining the specific initial and ongoing desired Strategy;
- monitoring performance of the Strategy; and,
- modifying and/or terminating the management of the client’s account using the Strategy.
Hypothetical Limitations: To the extent that the investment professional seeks for CANVAS to provide hypothetical back-tested performance, material limitations apply-see above.
Model Deviations: As indicated above, OSAM, with minor deviations that it does not consider to be material*, currently use the Models to manage actual client portfolios (i.e., the live Models). The deviations include:
- the use of proxies if and when an ETF used in the back-test was not available*. While the back-tested and live strategies both utilize the same investment themes, back-tested proxies can deviate from live models based on limitations of historical information;
- back-tested data presented utilizes a month-end rebalance while actual live model performance reflects intra-month rebalances;
- OSAM, as a discretionary manager, can update its live models as determined necessary. These changes will then be applied retroactively to back-tested models, the resulting performance of which would be different than that of the actual historical models-see Hypothetical/Material Limitations above; and,
- Financial statement information may be restated over time, which information was not reflected in the historical back-tested models. Companies will also have mergers and acquisitions or other corporate events that can retrospectively affect the names and corporate identities of organizations in the historical back-tests. Data providers providing pricing and return information may update historical data upon discovering deficiencies or omissions.
Strategy Sampling Impact: The implementation of OSAM strategies utilize a sampling of the underlying individual Strategy positions, and, as the result thereof, the underlying securities’ weighting could unintentionally deviate +/- the Strategy allocation target OSAM calculates the CANVAS fees based on the mix of strategies that are utilized at the establishment of the account. Therefore, the sampling approach can cause deviations between the CANVAS strategy allocation establishment (and its corresponding fee) and the implementation of that CANVAS strategy.
ESG Portfolios/Socially Responsible Investing Limitations: To the extent applicable to the strategy chosen by the investment professional, Socially Responsible Investing involves the incorporation of Environmental, Social and Governance considerations into the investment due diligence process (“ESG). There are potential limitations associated with allocating a portion of an investment portfolio in ESG securities (i.e., securities that have a mandate to avoid, when possible, investments in such products as alcohol, tobacco, firearms, oil drilling, gambling, etc.). The number of these securities may be limited when compared to those that do not maintain such a mandate. ESG securities could underperform broad market indices. Investors must accept these limitations, including potential for underperformance. Correspondingly, the number of ESG mutual funds and exchange-traded funds are few when compared to those that do not maintain such a mandate. As with any type of investment (including any investment and/or investment strategies recommended and/or undertaken by OSAM), there can be no assurance that investment in ESG securities or funds will be profitable or prove successful.
Tax Management Function: When requested by the investment professional, OSAM will use best efforts to work within Onboarding Budgets, Annual Tax Budgets, and Tracking Error Budgets. However, market and/or specific stock price fluctuations can occur quickly and can correspondingly adversely affect our ability to manage to specified budgets. Additionally, changes to tax budgets, cash flows in and out of an account, mandatory corporate actions, and funding with securities can also impact preciseness. The investment professional must accept this risk. In addition:
- OSAM has not, and will not, verify the accuracy of any tax-related information provided;
- In the event that any such information provided is inaccurate or incomplete, the corresponding results will be inaccurate or incomplete;
- Tracking Error Budgets are relative to the Model, not the benchmark;
- OSAM is not a CPA and this is not tax advice;
- Tax laws and rates change;
- While we seek to follow investment professional prescribed target models, ranges, timeframes, tax budgets, and seek not to create wash sales or exceed expected tax budgets, there can be no assurance that the CANVAS tool will be able to accurately do so; and,
- For specific personalized tax-related advice, consult with a CPA or other tax professional.
Fixed Income ETF Model: The models are constructed using passive fixed income ETFs. The models attempt to target varying levels of duration and credit exposure relative to the Barclays Aggregate Index. The expense ratios of the underlying ETF’s are born by the investor and are separate and apart from CANVAS related fees.
Miscellaneous Limitations/Issues:
- Results in the Transition Portal reflect expense ratios corresponding to the specific funds indicated/provided by the investment professional. Expense ratios are provided by an unaffiliated database. Results also reflect projected future yields corresponding to such current indicated funds. Such data may not be precise;
- The risk-free rate used in the calculation of Sortino, Sharpe, and Treynor ratios is 5%, consistently applied across time;
- OSAM did not begin to offer CANVAS until April 2019. Prior to 2007, OSAM did not manage client assets; and,
- A copy of OSAM’s written disclosure Brochure, Form CRS and Privacy Notice remains available on this CANVAS website or at www.osam.com.
Release and Hold Harmless
The professional, to the fullest extent permitted under applicable law, agrees to release, defend, indemnify and hold OSAM (including its officers, directors, members, owners, employees, agents, and affiliates) harmless from any and all adverse consequences, financial or otherwise, of any type or nature arising from or attributable to the professional’s access to, and use of, CANVAS, including, but not limited to, any claims for alleged or actual client losses or damages of any kind or nature whatsoever (including without limitation, the reimbursement of reasonable attorney’s fees, costs and expenses incurred by OSAM relating to investigating or defending any such claims and/or demands), except to the extent that actual losses are the direct result of an act or omission by OSAM that constitutes willful misfeasance, bad faith or gross negligence as adjudged by a court of final jurisdiction.
*except in the unlikely event that the performance of the proxy used in lieu of the actual ETF was materially different (positive or negative)
Lastly, please be advised, without limitation, OSAM shall not be liable for Losses resulting from or in any way arising out of (i) any action of the investor or its previous advisers or other agents, (ii) force majeure or other events beyond the control of OSAM, including without limitation any failure, default or delay in performance resulting from computer or other electronic or mechanical equipment failure, unauthorized access, strikes, failure of common carrier or utility systems, severe weather or breakdown in communications not reasonably within the control of OSAM, inaccuracy or incompleteness of any third-party data, or other causes commonly known as “acts of God,” or (iii) general market conditions. Under no circumstances shall OSAM be liable for consequential, special, incidental or indirect damages, punitive damages, or lost profits or reputational harm. Additionally, to the extent applicable, the responsibility solely rests on the “master user” of CANVAS at each independent firm, and NOT OSAM, to close out any associated users who may terminate at any time.
Please Note: Projection/Assumption Limitations. To the extent that any portion of the content reflects assumptions and/or projections, no such content should be construed or relied upon as an absolute probability that such an assumption or projection will prove correct or projected result will occur. To the contrary, a different result (positive or negative) can, and most likely will, occur. Materially different results could occur at any specific point in time or over any specific time period. The purpose of the projections is to provide a guideline to help determine which scenario best meets current and/or anticipated financial situations and/or objectives.
Please Note: Limitations: The accuracy of the Tracking Error is co-dependent upon corresponding client-designated constraints. Depending upon nature and extent of the constraints, the results may not correspond to the tracking error.
Please Note: Potential Conflict. OSAM is wholly owned by Franklin Resources, Inc., d/b/a Franklin Templeton. CANVAS could include funds and/or managers affiliated with and/or recommended by Franklin Templeton, as the result of which OSAM’s parent (Franklin) could derive additional compensation.
Please Note: Limitations. There can be no assurance, nor should there be any expectation, that OSAM shall act on any direction, instruction and/or notice on the day it is received.
Where applicable and used in investment offering: S&P 500® (a registered trademark of S&P® Global or its affiliates, an affiliate and third-party licensor of S&P®), S&P MidCap 400® (also known as the S&P 400® index, a registered trademark of S&P® Global or its affiliates, an affiliate and third-party licensor of S&P®), S&P SmallCap 600® (also known as the S&P 600® index, a registered trademark of S&P® Global or its affiliates, an affiliate and third-party licensor of S&P®), S&P Composite 1500® (also known as the S&P 1500® index, a registered trademark of S&P® Global or its affiliates, an affiliate and third-party licensor of S&P®), S&P® Global BMI, S&P® ADR, S&P®/TSX® Composite (S&P® a registered trademark of S&P® Global or its affiliates, an affiliate and third-party licensor of S&P®, and TSX® a registered trademark of TSX®, Inc., a third-party licensor of S&P®) are products of S&P® Dow Jones® Indices LLC or its affiliates (“SPDJI”) and have been licensed for use by Franklin Templeton, of which OSAM is a wholly owned subsidiary. Standard & Poor’s® and S&P® are registered trademarks of Standard & Poor’s Financial Services LLC (“S&P®”); Dow Jones® is a registered trademark of Dow Jones® Trademark Holdings LLC (“Dow Jones®”); and these trademarks have been licensed for use by SPDJI and sublicensed for certain purposes by Franklin Templeton. S&P 500®, S&P MidCap 400® (also known as the S&P 400® index), S&P SmallCap 600® (also known as the S&P 600® index), S&P Composite 1500® (also known as the S&P 1500® index), S&P® Global BMI, S&P® ADR, S&P®/TSX® Composite are not sponsored, endorsed, sold or promoted by SPDJI, Dow Jones®, S&P®, their respective affiliates, and none of such parties make any representation regarding the advisability of investing in such product(s) nor do they have any liability for any errors, omissions, or interruptions of the previously disclosed Indices above.
Additionally, please note, where applicable, funds and/or strategies have been developed solely by OSAM or FRI. The funds and/or strategies are not in any way connected to or sponsored, endorsed, sold or promoted by the London Stock Exchange Group plc and its group undertakings (collectively, the “LSE Group”). FTSE Russell is a trading name of certain of the LSE Group companies. All rights in the “FTSE Russell Index” (the “Index”) vest in the relevant LSE Group company which owns the Index. “FTSE®” “Russell®”, “FTSE Russell®”, “FTSE4Good®”, “ICB®”, and/or “The Yield Book®,” are a trademark(s) of the relevant LSE Group company and are used by any other LSE Group company under license. The Index is calculated by or on behalf of FTSE International Limited, FTSE Fixed Income, LLC, and/or its affiliate, agent, or partner. The LSE Group does not accept any liability whatsoever to any person arising out of (a) the use of, reliance on, or any error in the Index or (b) investment in or operation of the funds and/or strategies. The LSE Group makes no claim, prediction, warranty, or representation either as to the results to be obtained from the funds and/or strategies or the suitability of the Index for the purpose to which it is being put by OSAM or FRI.
Lastly, please note, where applicable, certain funds and/or strategies described herein are indexed to an MSCI index. In addition, MSCI hereby grants to Licensee a temporary, non-sublicensable (except as provided in its Agreement with OSAM), a non-transferable, non-exclusive license to hyperlink to MSCI’s website, www.msci.com, from any Licensee web page containing MSCI data or information. Further, Licensee hereby grants MSCI a temporary non-sub licensable, non-transferable, non-exclusive license to list Licensee as a licensee of MSCI data and to hyperlink to Licensee's website. For the avoidance of doubt, nothing herein shall confer any rights to MSCI in the Informational Materials where the Marks and MSCI logos may appear. Each of these licenses may be revoked at any time by MSCI or Licensee without notice without affecting any of the other rights granted hereunder.
O’Shaughnessy Asset Management, LLC (OSAM) is wholly owned subsidiary of Franklin Resources Inc./(Franklin Templeton).


