Value & Momentum—Building a Unique Canadian Equity Portfolio
By OSAM Research Team
March 2014
KEY POINTS:
Canadian equity indices are structurally flawed, resulting in unforeseen concentration risks.
Systematic stock selection, based on multi-factor composites for value and momentum, offers superior returns to market-cap-weighted indices.
This paper shows how a highly active strategy using superior valuation and momentum has outperformed by 560 bps (basis points) annualized since inception.
Systematically buying stocks based on their valuations and market momentum has proven to be an effective way of beating market-cap-weighted indexes in markets around the world. These two themes work especially well in the Canadian equity market—a strategy based on value and momentum has beaten the S&P/TSX by a significant margin since the 1980s and continues to deliver strong excess returns. This paper outlines why these two themes work so well in Canada, and how to use them to build a market-beating strategy.
One of the more unique aspects of the Canadian market is the concentration of the S&P/TSX. The index has less than 300 names and the top ten names typically account for 30–35 percent of the market cap weighting. Sector concentration also creates some interesting challenges: currently three-quarters of the S&P/TSX is weighted to the top three sectors (Financials, Energy, and Materials) by market cap. On the other hand, the smallest three sector allocations (Utilities, Information Technology, and Health Care) add up to be less than the total weight of Royal Bank of Canada—the largest single company in the index. Due to its market-cap-weighted construction, the index has a history of outsized allocations to individual names as well, Nortel Networks serving as the most notable and extreme example. At its peak in the Summer of 2000, Nortel accounted for almost 35 percent of the index. Another noteworthy and more recent trend is the weight of gold stocks within the Materials sector. Following gold’s dramatic rise to $1,883/ounce (CAD), the weight of gold stocks in the TSX nearly tripled, jumping from 5 percent to a high of 14 percent in 2011.
The extreme concentration in a small number of Canadian names and industries has caused headaches for passive and active investors alike. A passive investor owned 35 percent Nortel at its peak of $125 and rode it all the way down to the $0.19 share price where Nortel ultimately delisted in June 2009. A passive investor also had a 14 percent weight to gold miners at their peak toward the end of 2011, and then felt the pain as gold miners more recently became one of the worst-performing industries in the index (-47.7% in 2013). But these shifts and concentration issues have created a challenging environment for active management as well. In the past five years, only 30.4 percent of active managers have been able to outperform the S&P/TSX.1
We feel the most effective way to invest in Canadian equity markets is to use a disciplined and consistent approach, similar to how the benchmark is constructed but replacing market cap as the sole criteria for selecting and weighting stocks. Instead of market cap, we use themes that have been historically proven to offer superior long-term returns. Thirty years of market history show that the best way to outperform the S&P/TSX is to use a combination of value and momentum to build a portfolio that is very different from the benchmark.2 This is the approach used for managing O’Shaughnessy All-Canadian Equity, which has outperformed the S&P/TSX by 5,670 bps since the strategy’s inception in February 2007. It has outperformed by an annualized excess return of 560 bps and has beaten the benchmark in all 48 of the 36-month rolling periods since inception.
USING A MULTI-FACTOR COMPOSITE TO TRUMP TRADITIONAL VALUE FACTORS
The long-term efficacy of value investing is well documented, but there are several definitions of value and not all are created equal. In our research to identify the best valuation ratios, we looked at three decades of Canadian market data to find the factor that had the best gross returns, risk-adjusted returns, and consistency of returns across all market cycles and sectors. We found that a composited approach—combining multiple value factors—works best. The result is a “value composite” (OSAM ValueSM), which is a combination of five factors (price-to-sales, price-to-earnings, EBITDA-to-enterprise value, free cash flow-to-enterprise value, and shareholder yield3). Notably absent from this customized measure of value is one of the more popular valuation factors: price-to-book. Grouped by deciles, Figure 1 shows the excess returns of price-to-book and OSAM Value versus the universe of Canadian All Stocks. Notice how OSAM Value’s returns have a nearly linear decline from the cheapest decile on the left toward the more expensive deciles on the right.
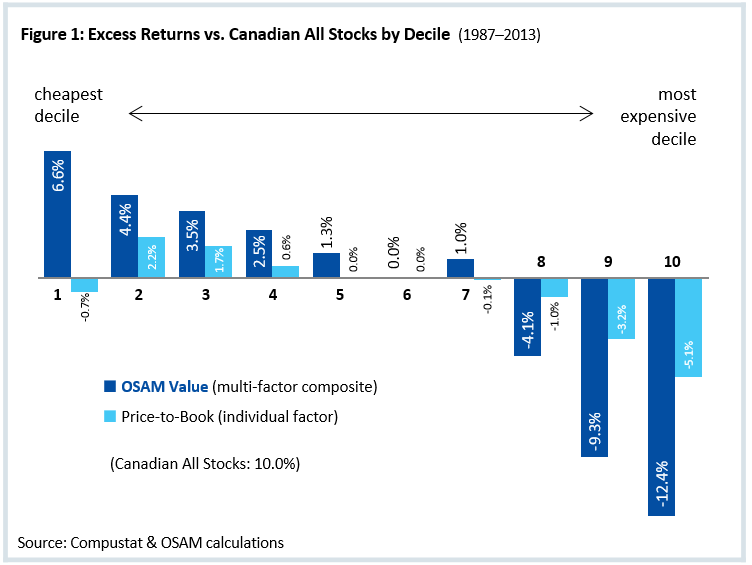
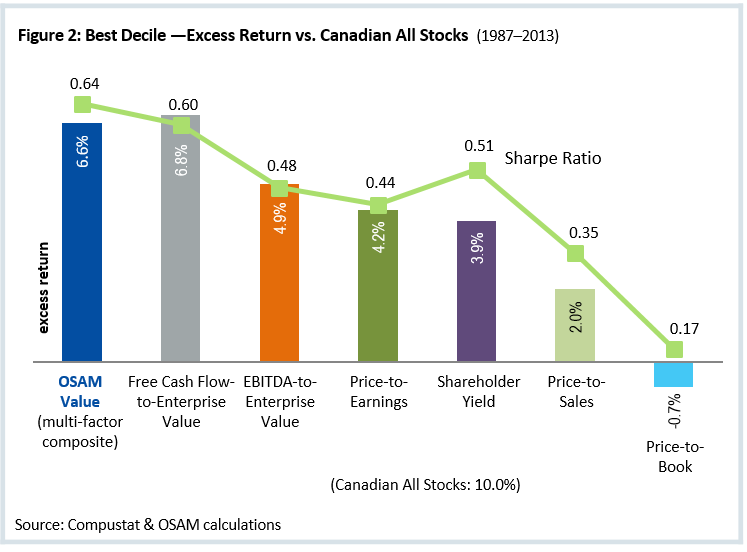
This is not the case for price-to-book, where its cheapest decile actually underperforms the market by 0.7 percent annualized. This is one reason why OSAM Value is an advantageous way to separate winners from losers, and is also a way to avoid value traps that may look inexpensive but tend to underperform. Figure 2 shows the average excess returns of portfolios constructed from the cheapest ten percent by OSAM Value and each of its individual factors.4 OSAM Value has comparable excess returns to the best individual factor (free cash flow-to-enterprise value) and better risk-adjusted returns than any of the individual factors.
Just as sectors come in and out of favor, so do individual value ratios. One factor can underperform for extended periods of time and there is no proven method to market-time these cycles. Table 1 helps illustrate this point: OSAM Value is the only one that never drops below the top three in any of the time periods shown and it is also one of only two that outperforms the market in every time period—every individual factor at some point drops into the bottom three. OSAM Value outperforms the individual factors in 87 percent of all rolling 120-month periods. These statistics further advocate the use of a composited approach to effectively create a whole that is greater than the sum of its parts.
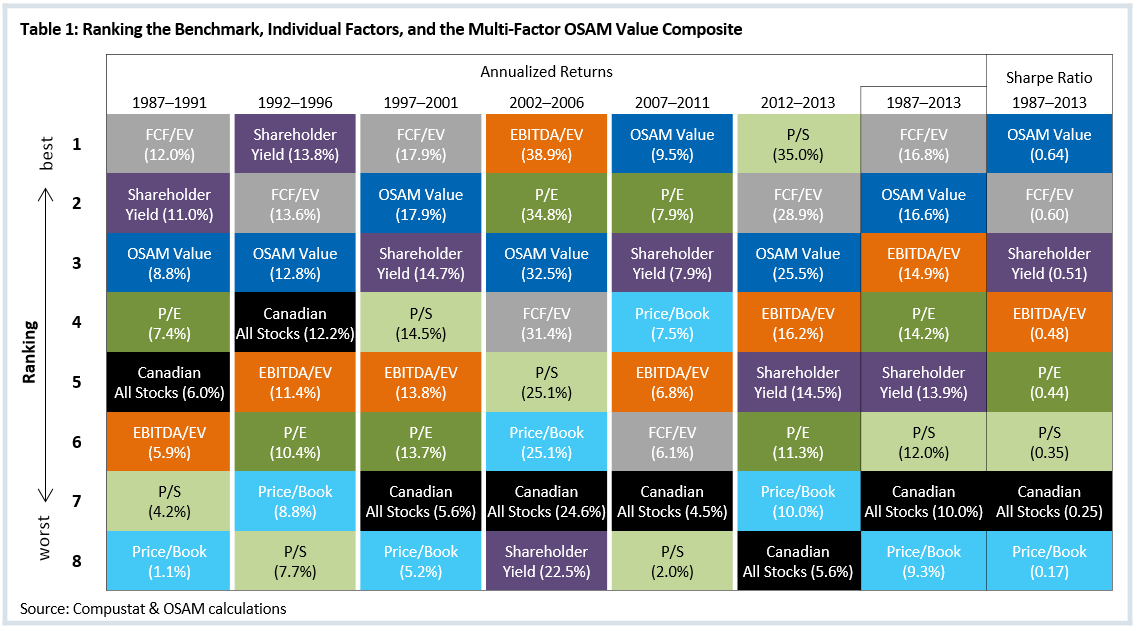
Price-to-book is the preferred definition of value by many practitioners and academics for measuring the relative cheapness of a stock versus its peers in the Canadian market. Despite its popularity, we do not use price-to-book in OSAM Value because of several problems with the factor (e.g., Figure 1 decile analysis). Notice that—in all but one of the time periods shown in Table 1—that price-to-book is ranked in the bottom three, showing it consistently has one of the lowest annualized returns of all value factors. Also, in half of the time periods shown, price-to-book underperforms the market. This issue is not isolated to the Canadian market. In the U.S., price-to-book has been a very inconsistent value ratio with prolonged periods of underperformance. From 1927 to 1963 the cheapest ten percent of stocks by price-to-book underperformed the U.S. market by an annualized 205 bps; and over the next 36 years by more than 200 bps.
Each factor has its own pros and cons and each will favor one industry versus another. Two active value managers selecting from the same pool of companies can have very different portfolios depending on which definition of value they prefer.
For example, price-to-book has a large inherent bias toward specific industries in Canada—especially towards metal and mining stocks. On the following page, Figure 3 shows the average percentile rank (1 is best and 100 is worst) of metals and mining companies in Canada based on price-to-book (thin light blue line) and OSAM Value (thick blue line). There are two immediately alarming observations. First, in every time period, metal and mining stocks look much cheaper by price-to-book than by using the multi-factored OSAM Value. Second, the gap between the two has dramatically increased in the past couple years.
At the time of this publication, the average metal and mining company in Canada has an OSAM Value score of 70 (meaning that the average company in that industry is more expensive than 70 percent of the other Canadian companies). But in the case of price-to-book that relationship is completely flipped.
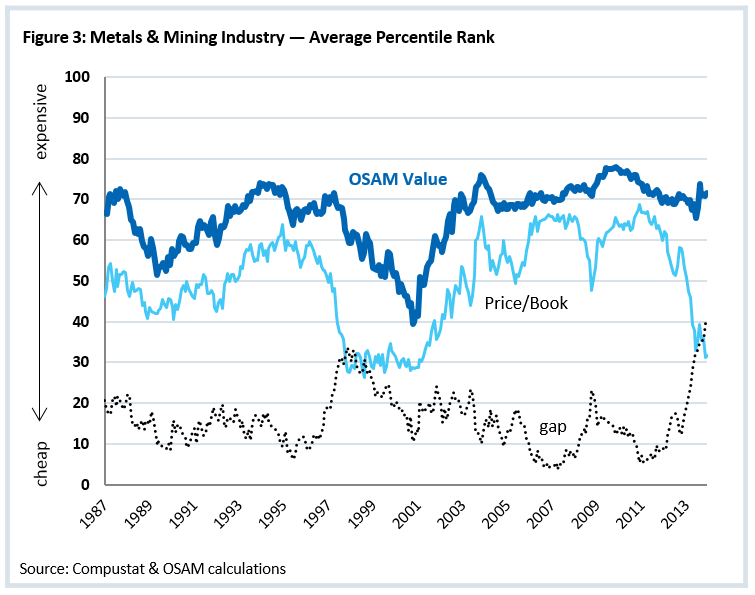
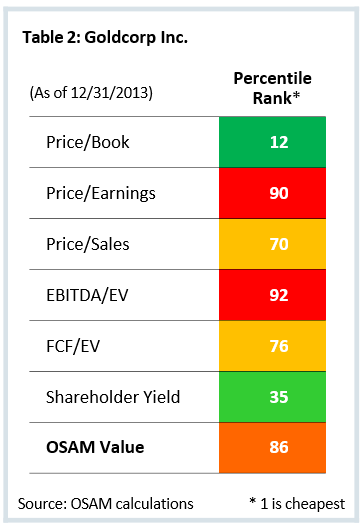
The average metal and mining company ranked by price-to-book is cheaper than 70 percent of all companies in Canada. This is a good example of how two definitions of value can tell very opposing stories about which sectors and names are “cheap” and how a multi-factor composited approach can minimize the effect of these biases. Goldcorp Inc. is a good illustration of how value definitions can differ, Table 2 shows the current rankings of Goldcorp Inc. on all the value ratios. It looks very cheap on price-to-book (cheaper than 88 percent of the Canadian market) but it is in the most expensive ten percent by price-to-earnings and worst eight percent by EBITDA-to-enterprise value, leading to a composite score in the most expensive 14 percent of all Canadian equities. Similarly, Barrick Gold is in the cheapest one-third by price-to-book but in the most expensive one percent by price-to-earnings. While these are just two examples, several more exist with a similar relationship, making the stocks look cheaper by price-to-book than they actually are. The bottom line is that, in order to assess valuation, the most effective and consistent method is to evaluate each company in several different ways and to use factors that work well in each of the various markets. In Canada, OSAM Value delivers strong and consistent excess returns but price-to-book does not.
MOMENTUM: AN UNCORRELATED COMPLEMENT TO VALUE
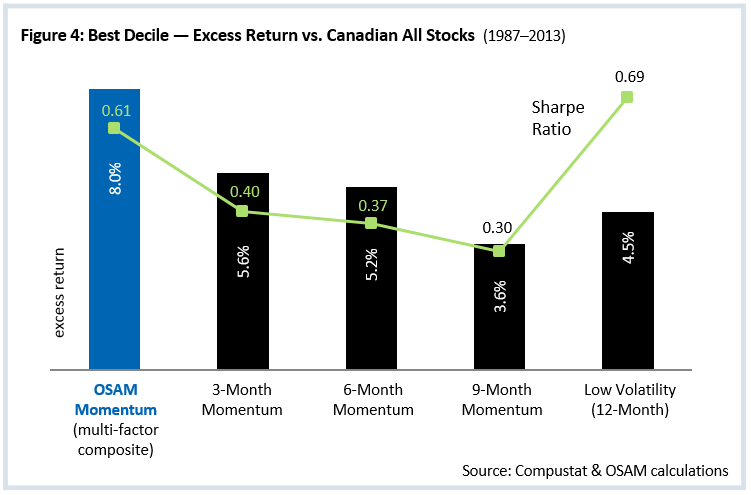
Buying Canadian stocks with strong momentum is another way to outperform the S&P/TSX. Similar to the value theme, we advocate using a composited approach when measuring momentum. In addition to selecting on high three-, six-, and nine-month momentum, we also favor companies with the lowest volatility over the previous 12 months. On the following page, Figure 4 shows that the composited approach has an annualized return that is 240–440 bps higher than any of the individual momentum factors. Our research shows that volatility has persistence, just as relative performance does, and those names with the highest volatility over the prior year are likely to continue to be volatile in the following months.
This discovery allowed us to capture the excess returns in momentum with a greatly reduced volatility. This is best illustrated by Sharpe Ratio, which measures risk-adjusted returns. The Sharpe Ratio for OSAM’s multi-factor momentum composite is more than 50 percent higher than three-, six-, or nine-month momentum on its own. OSAM MomentumSM also works especially well in Canada, where the excess return for its best decile is 800 bps—nearly double the 410 bps excess return it received in the neighboring U.S. market over the same timeframe. Momentum is a great complement to value in Canadian equity portfolios. Since there is a negative correlation between the excess returns of OSAM Value and OSAM Momentum, when used together they can offer increased diversification. Figure 5 (see next page) shows the rolling one-year excess return for the best deciles of the individual composites. In 94 percent of all rolling 12-month periods at least one of the two composites had positive excess returns. OSAM Value has underperformed in 28 percent of all rolling 12-month periods, while OSAM Momentum has underperformed in only 16 percent—but this typically occurs at different times. We advocate that Canadian investors use a combination of value and momentum, not only capturing the higher risk-adjusted returns of each but also taking advantage of the added protection and diversification benefits. This is our approach in the O’Shaughnessy All-Canadian Equity strategy.
IT PAYS TO BE DIFFERENT: TRUE ACTIVE MANAGERS HISTORICALLY OUTPERFORM
Using value and momentum in Canada can lead to portfolios that are very distinct from the S&P/TSX. OSAM has always firmly believed that the only way to consistently outperform the benchmark is to build portfolios that are different from the benchmark. Recent studies of a new measure called Active Share have taken huge strides in quantifying exactly how much payoff there is for being different. Active Share is a simple but powerful concept defined as the share of portfolio holdings that differ from the benchmark. For example, an equity portfolio with a 70 percent Active Share indicates that 70 percent of its assets differ from the passive index, while the remaining 30 percent mirror the index. These studies found that “funds with the highest Active Share significantly outperformed their benchmarks, both before and after expenses, and they exhibit strong performance persistence.”5

All this also makes sense in a market with such imbalances in sector weights. If precious metals, oil companies, or banks become overly expensive relative to the market, then a manager able and willing to build a portfolio largely underweighted to that sector will be better equipped to outperform. For example, if the diminutive airline industry (weighted 0.34 percent in the S&P/TSX) becomes increasingly attractive you would want to allow a large weight to take advantage.
The study on Active Share breaks mutual funds into three categories: Explicit Indexing, Closet Indexing (Active Share < 60%), and Truly Active (Active Share > 60%). Canada has one of the lowest levels of Explicit Indexing (eight percent). Relative to the 32 other countries in the study, Canada also has a high level of Closet Indexing (37 percent) and one of the lowest percentages of assets invested in Truly Active managers (55 percent).6
Canadian investors may be leaving money on the table with such a low weight to high Active Share managers. Cremers and Petajisto concluded that “a 30-percent increase in Active Share is associated with an increase of 217 bps in benchmark-adjusted alpha over the following year.”6
The O’Shaughnessy All-Canadian Equity strategy has an Active Share of 82.5 percent (as of 12/31/13) and is a great option for investors seeking high Active Share plus exposure to the themes of value and momentum.
RESULTS: THE O’SHAUGHNESSY ALL-CANADIAN EQUITY STRATEGY
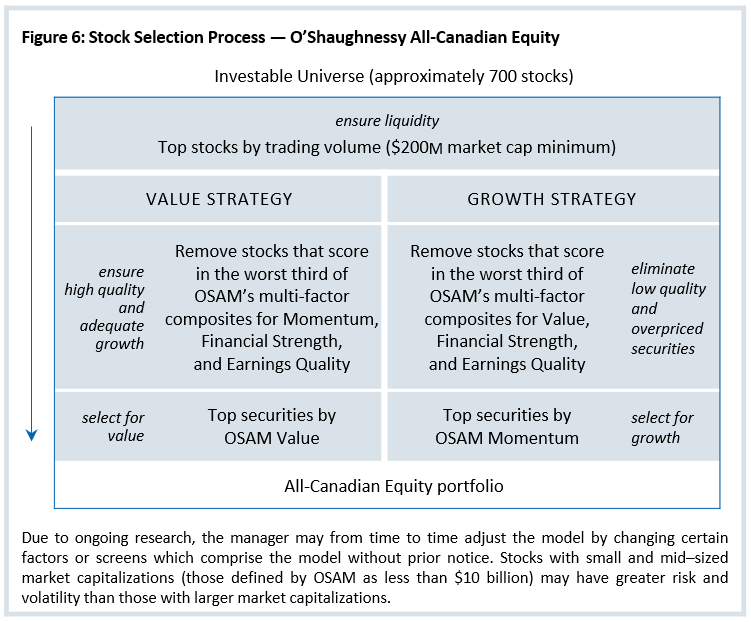
Ultimately it is the combination of the themes of value and momentum into a unique portfolio that best offers the potential to outperform Canadian markets by large margins. Figure 6 shows the All-Canadian Equity stock selection process. While value and momentum drive stock selection, it also uses multi-factor composites for Financial Strength and Earnings Quality to help avoid value traps. Since inception (2/1/2007) this strategy has outperformed the S&P/TSX by an annualized 560 bps. Also during that time period the strategy outperformed fairly consistently—it has positive excess returns in 75 percent of all rolling 12-month periods and 100 percent of all rolling 36-month periods since inception. The three-year outperformance is in line with the 96 percent observed in a historical backtest (1987–2013). The O’Shaughnessy All-Canadian Equity strategy has outperformed the S&P/TSX by 5,670 bps since inception (2/1/2007). We feel these consistent and positive returns validate our internal research showing that composited investment themes are superior to the inefficient market-cap-weighted benchmarks.
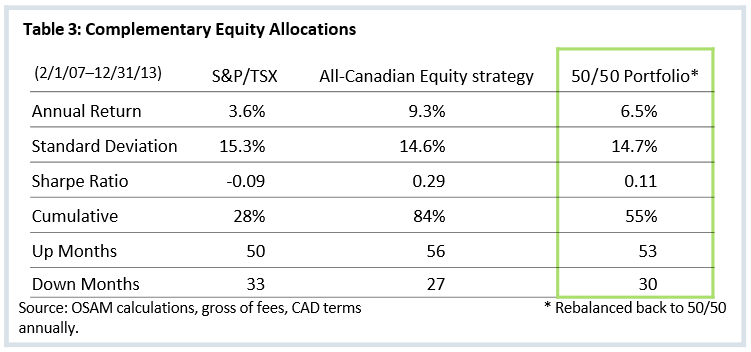
The O’Shaughnessy All-Canadian Equity strategy works well as a stand-alone equity allocation or as a complement to other Canadian equity strategies, regardless of whether it is a passive or active manager. Our high conviction, high Active Share strategy, and unique approach to stock selection, offer substantial diversification benefits. For example, Table 3 (see below) shows the return statistics resulting from a 50/50 allocation to the O’Shaughnessy All-Canadian Equity strategy and the S&P/TSX. Returns nearly doubled, and the risk-adjusted returns increased substantially, even with just half of the Canadian exposure allocated to the O’Shaughnessy All-Canadian Equity strategy.
CONCLUSION
The Canadian equity market presents many unique opportunities for active management with its history of large concentrations to individual names and sectors. Though traditional managers have had a difficult time beating the market-cap-weighted S&P/TSX over long time periods, research and the live-time performance of the O’Shaughnessy All-Canadian Equity strategy show that a highly active, disciplined approach—combining the proven themes of value and momentum—can offer Canadian equity investors the potential to outperform by significant margins over the long term.
Footnotes:
1 McGraw Hill Financial, Inc., “SPIVA® Canada Scorecard” (Mid-Year 2013) http://us.spindices.com/documents/spiva/spiva-canada-midyear-2013.pdf
2 The COMPUSTAT database has the longest history of Canadian public financial data (begins in January 1987).
3Shareholder Yield: the combination of dividend yield and buyback yield.
4 Versus Canadian All Stocks (1987–2013).
5 Cremers and Petajisto, “How Active is Your Fund Manager? A New Measure That Predicts Performance” (2009)
6 Cremers, Ferreira, Matos, and Starks, “The Mutual Fund Industry Worldwide: Explicit and Closet Indexing, Fees, and Performance” (2013)
Please note Investors cannot invest directly in an index. The S&P/TSX Composite Index is an index of the stock (equity) prices of the largest companies on the Toronto Stock Exchange as measured by market capitalization. The Toronto Stock Exchange listed companies in this index comprises about 71% of market capitalization for all Canadian-based companies listed on the TSX. For the compliant composite performance presentation of the O’Shaughnessy All-Canadian Equity strategy, please see www.osam.com/pdf/osam_all-canadian-update.pdf
International investing involves a greater degree of risk and increased volatility. Changes in currency exchange rates and differences in accounting and taxation policies outside the U.S. can raise or lower returns. Also, some overseas markets may not be as politically and economically stable as the United States and other nations. Investments in emerging markets can be more volatile.
General Legal Disclosure/Disclaimer and Backtested Results
The material contained herein is intended as a general market commentary. Opinions expressed herein are solely those of O’Shaughnessy Asset Management, LLC and may differ from those of your broker or investment firm.
Please remember that past performance is no guarantee of future results. Different types of investments involve varying degrees of risk, and there can be no assurance that the future performance of any specific investment, investment strategy, or product made reference to directly or indirectly in this presentation, will be profitable, equal any corresponding indicated historical performance level(s), or be suitable for any portfolio. Gross of fee performance computations are reflected prior to OSAM’s investment advisory fee (as described in OSAM’s written disclosure statement), the application of which will have the effect of decreasing the composite performance results (for example: an advisory fee of 1% compounded over a 10-year period would reduce a 10% return to an 8.9% annual return). Due to various factors, including changing market conditions, the content may no longer be reflective of current opinions or positions. Moreover, you should not assume that any discussion or information contained in this presentation serves as the receipt of, or as a substitute for, individualized investment advice from OSAM. Historical performance results for investment indices and/or categories have been provided for general comparison purposes only, and generally do not reflect the deduction of transaction and/or custodial charges, the deduction of an investment management fee, nor the impact of taxes, the incurrence of which would have the effect of decreasing historical performance results. It should not be assumed that any account holdings would correspond directly to any comparative indices. Account information has been compiled solely by OSAM, has not been independently verified, and does not reflect the impact of taxes on non-qualified accounts. In preparing this presentation, OSAM has relied upon information provided by the account custodian and/or other third party service providers. OSAM is a Registered Investment Adviser with the SEC and a copy of our current written disclosure statement discussing our advisory services and fees remains available for your review upon request.
The dividend yield is a gross indicated yield. There is no guarantee that the rate of dividend payment will continue and the income derived is subject to taxes and expenses which will impact the actual yield experience of each investor.
Hypothetical performance results shown on the preceding pages are backtested and do not represent the performance of any account managed by OSAM, but were achieved by means of the retroactive application of each of the previously referenced models, certain aspects of which may have been designed with the benefit of hindsight.
The hypothetical backtested performance does not represent the results of actual trading using client assets nor decision-making during the period and does not and is not intended to indicate the past performance or future performance of any account or investment strategy managed by OSAM. If actual accounts had been managed throughout the period, ongoing research might have resulted in changes to the strategy which might have altered returns. The performance of any account or investment strategy managed by OSAM will differ from the hypothetical backtested performance results for each factor shown herein for a number of reasons, including without limitation the following:
- Although OSAM may consider from time to time one or more of the factors noted herein in managing any account, it may not consider all or any of such factors. OSAM may (and will) from time to time consider factors in addition to those noted herein in managing any account.
- OSAM may rebalance an account more frequently or less frequently than annually and at times other than presented herein.
- OSAM may from time to time manage an account by using non-quantitative, subjective investment management methodologies in conjunction with the application of factors.
- The hypothetical backtested performance results assume full investment, whereas an account managed by OSAM may have a positive cash position upon rebalance. Had the hypothetical backtested performance results included a positive cash position, the results would have been different and generally would have been lower.
- The hypothetical backtested performance results for each factor do not reflect any transaction costs of buying and selling securities, investment management fees (including without limitation management fees and performance fees), custody and other costs, or taxes – all of which would be incurred by an investor in any account managed by OSAM. If such costs and fees were reflected, the hypothetical backtested performance results would be lower.
- The hypothetical performance does not reflect the reinvestment of dividends and distributions therefrom, interest, capital gains and withholding taxes.
- Accounts managed by OSAM are subject to additions and redemptions of assets under management, which may positively or negatively affect performance depending generally upon the timing of such events in relation to the market’s direction.
- Simulated returns may be dependent on the market and economic conditions that existed during the period. Future market or economic conditions can adversely affect the returns.


