OSAM Update: Blizzard, Winter, or Ice Age
By Patrick O’Shaughnessy
March 2020
March 23, 2020
Blizzard, Winter, or Ice Age
The past two weeks have been a brutal market blizzard during what is now almost certainly an economic and investing winter.
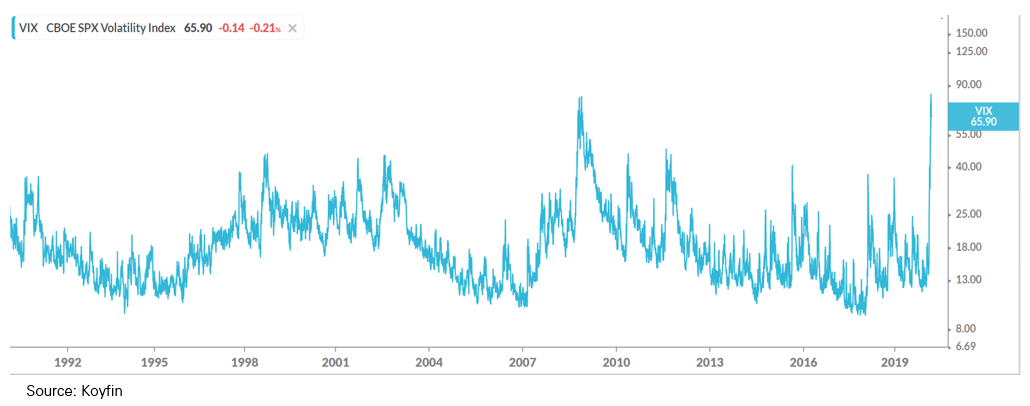
Blizzards are defined by extreme volatility and uncertainty—and we’ve had historic amounts of both since February 20th. I believe that to survive a blizzard you must focus on placing each foot in front of the other. Executing your plan or process, reigning in leverage (if applicable), and avoiding blunders in the confusion. We know that price volatility clusters at periodic peaks of uncertainty—these are market blizzards.
A winter is a sustained period of equity market drawdown and negative economic growth and rising unemployment—an economic recession. We have faced many winters before, and while the circumstances that trigger a given winter are always somewhat unique, we’ve always recovered and reached new highs in both the economy and the stock market. In a winter, cost structures change and weak hands (even considering bailouts or loans) fold. Winters have been some of the better times to invest cash into equities, by far.
We work with a lot of professional financial intermediaries: financial advisors and investment consultants who manage money for their clients. Talking to many of these people over the past two weeks, it is clear that having enough cash on hand is like having a warm fire during winter, and I personally don’t see anything wrong with making asset allocation changes to secure that fire. But full out panic and liquidation has been the clearly wrong strategy in past winters, especially for younger investors or those with years of cash on hand. I think it’s important to remember that the reality isn’t that people sell at market bottoms, markets bottom because everyone sells. With the S&P 500 down nearly 35% from its peak at the time of this writing, we’ve faced the swiftest drawdown on record. For many it has already been incredibly difficult to stick with a long-term equity allocation. Most behavioral investing errors happen in periods of uncertainty like the one we face today.
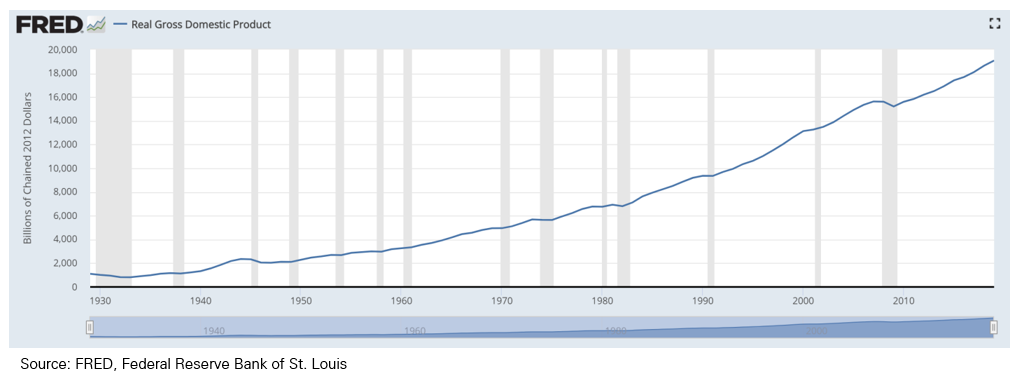
That brings us to the largest open question: is this a winter like we’ve faced before, like those visible in the chart above? Each one was hard and painful, but each was followed by a normal spring and summer on the other side. Or is this an ice age? A period more like the Great Depression or other long periods of decline and stagnation? James Bullard at the St. Louis Fed warned recently of the potential for 30% unemployment and a 50% decline in GDP—both significantly worse than the extreme levels of the Great Depression.
The October 19th, 1918 issue of the Arkansas Gazette highlighted the many ways in which the Spanish flu had decimated local businesses. A department store’s revenues were down 50%; merchants were down 40-70%; businesses were losing an average of $10,000 per day ($133k in 2007 dollars). Demand was up in drug stores, and for certain products like beds, mattresses, and bedsprings1.
Can the same thing that happened in Little Rock in 1918 happen writ large across the entire U.S. (and global) economy and last for years? Without a serious, swift, and aggressive response, it is possible. But the best data that we have suggests it's improbable.
We are now in one of those scary periods where returns are determined as much by investor behavior and psychology as by fundamental outcomes. In periods of psychological market stress, data, evidence, and process are critical. We turn to that data to build expectations of where we may go from here.
How to Value the Market, and What Returns to Expect From Here
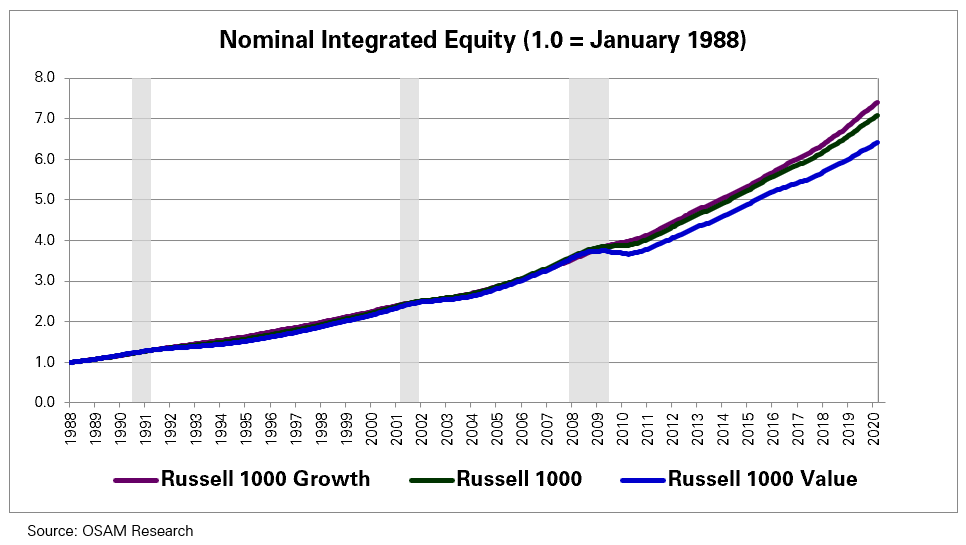
We are entering a situation in which traditional methods of market valuation may become less useful as business fundamentals fall precipitously. In that type of situation, we think the best way to value the broad market is by measuring its “integrated equity,” which we define as all capital retained and reinvested by companies, properly adjusted for inflation. Here’s what a chart of total integrated equity looks like since 1988. Notice the slight dip for value stocks in the financial crisis (due to write downs and earnings losses). Notice that the measure remains smooth and steady over time, even through periods of deep recession.
The cheaper you can buy stocks based on their integrated equity, the better. Here is an update on the estimated future 10-year returns from our price-to-integrated equity calculation. These return predictions have changed drastically since the beginning of the year:
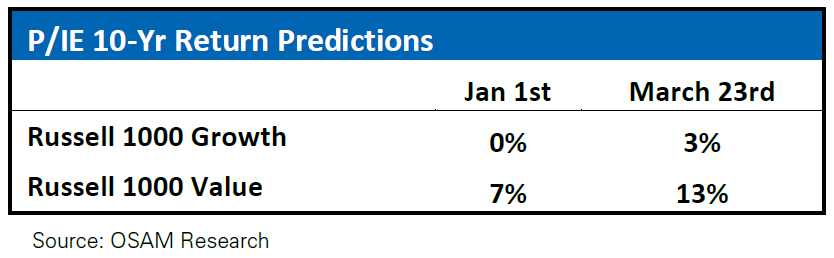
We expect 3%/year for growth stocks (still quite low despite the drop) and 13%/year for value stocks. This is the highest prediction we’ve seen for value since the highest ever in March of 2009 (a prediction which proved close to accurate), when the model predicted a return of nearly 17%/year.

These are index return predictions. We think that the way Russell builds indexes is not ideal for investing purposes, and that better tailored value strategies will achieve returns significantly higher than the 13%/year which we expect from the index.
How to Build Equity Portfolios Now
This is where I talk our own book. Normally we don’t comment on how factors look relative to one another in the near term. But there is nothing normal about the markets right now. In fact, we are witnessing relative investment opportunities in smaller, cheaper stocks that we thought we’d never see again after the madness of the tech-bubble in 2000.
There are many ways we can evaluate the value of smaller cheaper stocks. We can see how cheap they are relative to fixed income yields, we can see how cheap they are versus their own history, and we can see how cheap they are relative to the large growth category of stocks that have led this market cycle since 2009 and thus far have led the market in this drawdown.
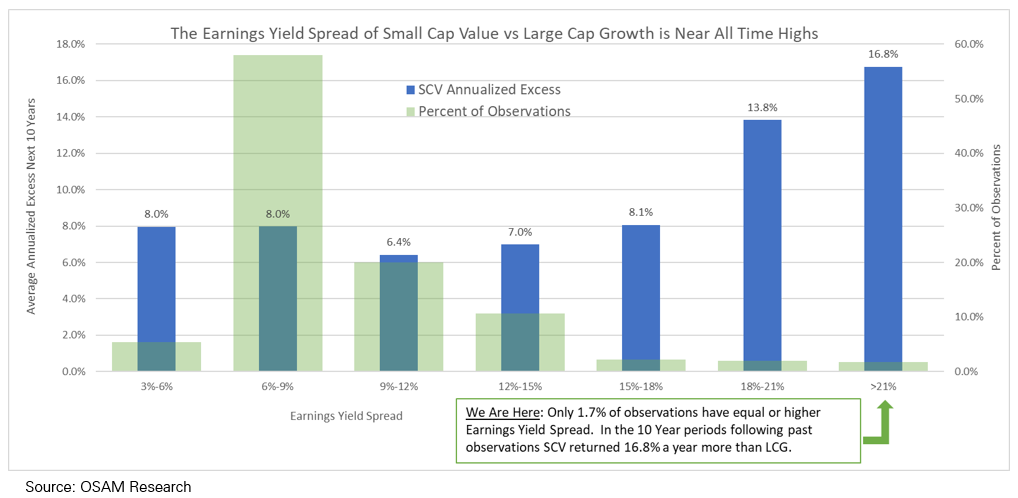
In each case, we see historic readings. As one example, when we compare the earnings yield of the cheapest small stocks (cheapest decile by price-to-earnings) to the most expensive decile of large cap stocks, we see a spread of more than 21%. Following extreme periods like this historically, small value outperformed large growth by 16.8%/year over the subsequent 10 years.
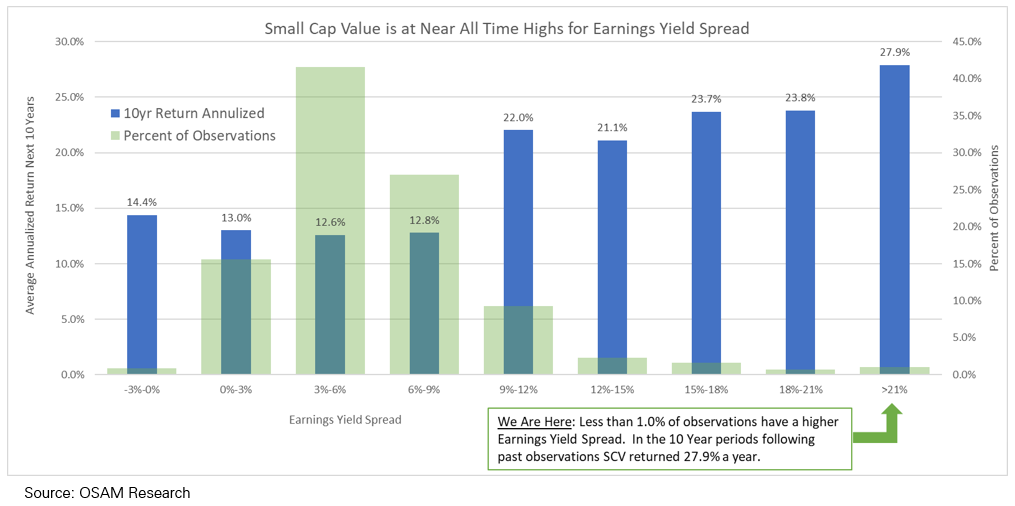
We can also compare the earnings yield on small cap stocks (cheapest decile) to the yield on the U.S. government 10-year bond. Most of the time, that spread is between 3-6%. Today it is greater than 20%. Following similar spreads in the past, small value stocks returned an average of 27.9% in the subsequent 10-year period.
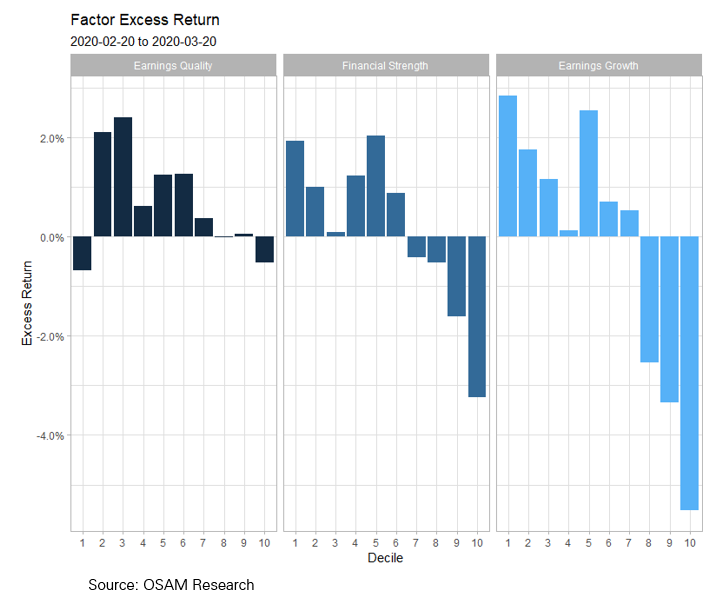
We use small value here as a simple proxy for many quantitative strategies but must emphasize that we don’t think you should just buy the cheapest decile of stocks. We know that many stocks will suffer huge earnings declines, and so quality and trend remain critically important in any investing modeling process. Since the market peak on February 20th, we’ve seen how important quality can be. In this chart you can see that across our quality factors, low quality stocks have done much worse than the market. We think these factors will remain important from here.
Value has been pummeled for years, and now even more acutely for weeks during the COVID market crash. As a result, we are now faced with historic readings and perhaps a historic opportunity. This isn’t to say the market doesn’t have more downside—I have no clue when the blizzard will end. But the data suggests the market as a whole will reward investors, and that it will reward investors focused on quality and valuations even more.
Is the World Going to End?
Since I’ve been unable to sleep this week, I’ve been rereading Frank Herbert’s Dune at night—the book where we get the famous quote: “fear is the mind killer” (which everyone and their brother is trotting out right now). It is a damn good passage:
"I must not fear. Fear is the mind-killer. Fear is the little-death that brings total obliteration. I will face my fear. I will permit it to pass over me and through me. And when it has gone past I will turn the inner eye to see its path. Where the fear has gone there will be nothing. Only I will remain."
We are in a state of global fear and uncertainty. I’ve been asked a lot about what I’ll call “ice age hedges”—through a combination of cash, productive hard assets, or even unproductive scarce assets like gold and bitcoin. I’ll admit that because it's possible (though again, in my view, improbable) that we face a true ice age, I can’t argue with ice age hedges of some type. Personally, I am not buying these things, and am keeping normal cash on hand—but I understand those that are.
With the country—and world—shut down, can we cross the chasm, help businesses survive the revenue drought, and re-emerge on the other side? I believe that we can. I am an optimist. I believe in the resilience of people, and of this country and the world. I believe that it is hard to bake this resilience and the human response into epidemic models, and so I am optimistic that our response to this menace will curtail the worst-case outcomes, and that we will avoid an ice age.
I have hope. But as Herbert writes in Dune soon after the famous fear passage, “hope clouds observation.” I agree. Fear is the mind-killer but hope alone is insufficient. We must quickly embrace reality and then seek to improve it. We must focus on the things in our control that we can make go up as prices go down, that we can improve as things devolve. In our case that means perfect execution, more research than ever, more transparent conversations than ever, more information sharing than ever, and a constant assessment and appropriate rebalancing of portfolios. I know everyone else is starting to do the same: asking how they can help, how they can fight, how they can survive and advance, better than before. I promise that everyone at OSAM will be a small part of that fight.
1 https://www.stlouisfed.org/~/media/files/pdfs/community-development/research-reports/pandemic_flu_report.pdf
General Legal Disclosures & Hypothetical and/or Backtested Results Disclaimer
The material contained herein is intended as a general market commentary. Opinions expressed herein are solely those of O’Shaughnessy Asset Management, LLC and may differ from those of your broker or investment firm.
Please remember that past performance may not be indicative of future results. Different types of investments involve varying degrees of risk, and there can be no assurance that the future performance of any specific investment, investment strategy, or product (including the investments and/or investment strategies recommended or undertaken by O’Shaughnessy Asset Management, LLC), or any non-investment related content, made reference to directly or indirectly in this piece will be profitable, equal any corresponding indicated historical performance level(s), be suitable for your portfolio or individual situation, or prove successful. Due to various factors, including changing market conditions and/or applicable laws, the content may no longer be reflective of current opinions or positions. Moreover, you should not assume that any discussion or information contained in this piece serves as the receipt of, or as a substitute for, personalized investment advice from O’Shaughnessy Asset Management, LLC. Any individual account performance information reflects the reinvestment of dividends (to the extent applicable), and is net of applicable transaction fees, O’Shaughnessy Asset Management, LLC’s investment management fee (if debited directly from the account), and any other related account expenses. Account information has been compiled solely by O’Shaughnessy Asset Management, LLC, has not been independently verified, and does not reflect the impact of taxes on non-qualified accounts. In preparing this report, O’Shaughnessy Asset Management, LLC has relied upon information provided by the account custodian. Please defer to formal tax documents received from the account custodian for cost basis and tax reporting purposes. Please remember to contact O’Shaughnessy Asset Management, LLC, in writing, if there are any changes in your personal/financial situation or investment objectives for the purpose of reviewing/evaluating/revising our previous recommendations and/or services, or if you want to impose, add, or modify any reasonable restrictions to our investment advisory services. Please Note: Unless you advise, in writing, to the contrary, we will assume that there are no restrictions on our services, other than to manage the account in accordance with your designated investment objective. Please Also Note: Please compare this statement with account statements received from the account custodian. The account custodian does not verify the accuracy of the advisory fee calculation. Please advise us if you have not been receiving monthly statements from the account custodian. Historical performance results for investment indices and/or categories have been provided for general comparison purposes only, and generally do not reflect the deduction of transaction and/or custodial charges, the deduction of an investment management fee, nor the impact of taxes, the incurrence of which would have the effect of decreasing historical performance results. It should not be assumed that your account holdings correspond directly to any comparative indices. To the extent that a reader has any questions regarding the applicability of any specific issue discussed above to his/her individual situation, he/she is encouraged to consult with the professional advisor of his/her choosing. O’Shaughnessy Asset Management, LLC is neither a law firm nor a certified public accounting firm and no portion of the newsletter content should be construed as legal or accounting advice. A copy of the O’Shaughnessy Asset Management, LLC’s current written disclosure statement discussing our advisory services and fees is available upon request.
Hypothetical performance results shown on the preceding pages are backtested and do not represent the performance of any account managed by OSAM, but were achieved by means of the retroactive application of each of the previously referenced models, certain aspects of which may have been designed with the benefit of hindsight.
The hypothetical backtested performance does not represent the results of actual trading using client assets nor decision-making during the period and does not and is not intended to indicate the past performance or future performance of any account or investment strategy managed by OSAM. If actual accounts had been managed throughout the period, ongoing research might have resulted in changes to the strategy which might have altered returns. The performance of any account or investment strategy managed by OSAM will differ from the hypothetical backtested performance results for each factor shown herein for a number of reasons, including without limitation the following:
▪ Although OSAM may consider from time to time one or more of the factors noted herein in managing any account, it may not consider all or any of such factors. OSAM may (and will) from time to time consider factors in addition to those noted herein in managing any account.
▪ OSAM may rebalance an account more frequently or less frequently than annually and at times other than presented herein.
▪ OSAM may from time to time manage an account by using non-quantitative, subjective investment management methodologies in conjunction with the application of factors.
▪ The hypothetical backtested performance results assume full investment, whereas an account managed by OSAM may have a positive cash position upon rebalance. Had the hypothetical backtested performance results included a positive cash position, the results would have been different and generally would have been lower.
▪ The hypothetical backtested performance results for each factor do not reflect any transaction costs of buying and selling securities, investment management fees (including without limitation management fees and performance fees), custody and other costs, or taxes – all of which would be incurred by an investor in any account managed by OSAM. If such costs and fees were reflected, the hypothetical backtested performance results would be lower. Therefore, it should be noted that on the previous pages of this presentation, any back-tested results may be reflected gross of fees. Had OSAM managed the back-tested Portfolio during the corresponding time period, the deduction of an OSAM fee would have decreased the reflected results. For example, the deduction of a 1.00% fee over a 10-year period would have reduced a 10% gross of fees gain to an 8.9% net of fees gain.
▪ The hypothetical performance does not reflect the reinvestment of dividends and distributions therefrom, interest, capital gains and withholding taxes.
▪ Accounts managed by OSAM are subject to additions and redemptions of assets under management, which may positively or negatively affect performance depending generally upon the timing of such events in relation to the market’s direction.
▪ Simulated returns may be dependent on the market and economic conditions that existed during the period. Future market or economic conditions can adversely affect the returns.
Composite Performance Summary
For full composite performance summaries. please follow this link: http://www.osam.com
O’Shaughnessy Asset Management – Canvas™ Disclosures
O’SHAUGHNESSY ASSET MANAGEMENT, L.L.C.


