Hope for the Best, But Prepare for the Worst: Defensive Equity Investing in An Uncertain Market
By Euan Mackay
March 2022
Despite the economic and social turbulence caused by the coronavirus pandemic, U.S. and global stocks proved remarkably resilient during the crisis. COVID-19 saw the fastest market decline in history, and the quickest recovery.
As macroeconomic challenges have mounted this year, markets have proved less sanguine. Rampant inflation has fueled concerns about rising interest rates, while the war in Ukraine has sparked fears of an expanding international conflict. As the specter of recession has returned, equity markets are down, and volatility is up.
This volatility has reminded many investors of the benefits of a defensive approach to equity investing. As in most down markets, companies with the most stable fundamentals have held up well. History suggests that they should continue to do so if markets remain volatile and that this defensiveness in difficult markets helps to explain why stable companies have consistently outperformed the market over the long term.
Defensive Stability
OSAM’s Defensive Stability strategy follows a similar approach to our other active, factor-oriented, investment strategies. Through rigorous analysis of long-term data, we isolate the most attractive attributes of stable companies, and we look to build portfolios that emphasize these characteristics.
We evaluate stability through three lenses – a company’s operations, its management, and the volatility of its shares in the market. We rank all stocks by these metrics, focus on the top 10%, and remove those with the lowest scores on any of our other factors. This helps to avoid low quality stocks or those with other undesirable features, like speculative valuations or weak momentum.
Exhibit 1: OSAM’s Defensive Stability Factor Profile

Source: OSAM. Data as of December 31.
Our analysis of this approach reveals a strategy with advantageous long-term risk-adjusted returns relative to the broad market, and a significant portion of this advantage generated in down markets.
Current Market Environment
Since around Thanksgiving 2021, investors have experienced wider swings in equity markets. Initially driven by the Fed’s “hawkish pivot” towards tighter monetary policy and compounded lately by the conflict in Ukraine, the most common gauge of market volatility (the so-called VIX Index) has more than doubled from 17.9 to a peak above 36.
Throughout this period, OSAM’s Defensive Stability strategy has performed in line with the expectations set by our historical analysis. From November 19 through a recent low on March 14, the Russell 1000 Index was down 12.7%, while Defensive Stability was down 5.4%.
Performance attribution for the period identifies the strategy’s factor profile – its emphasis on the most stable companies – as the key driver of its excess returns.
By emphasizing stability, the portfolio has a large exposure to consumer staples stocks, which have performed well as the market has declined. Holdings in defensively oriented health care stocks have also held up relatively well. Energy stocks have been unusually buoyant in this year’s down market as oil prices have soared amid supply concerns. At present, the strategy finds no energy stocks that meet its selection criteria; this has weighed on the strategy’s returns but helped to dampen its volatility, which has been 30% less than the market.
Exhibit 2: OSAM Defensive Stability and Russell 1000 Index Cumulative Returns since November
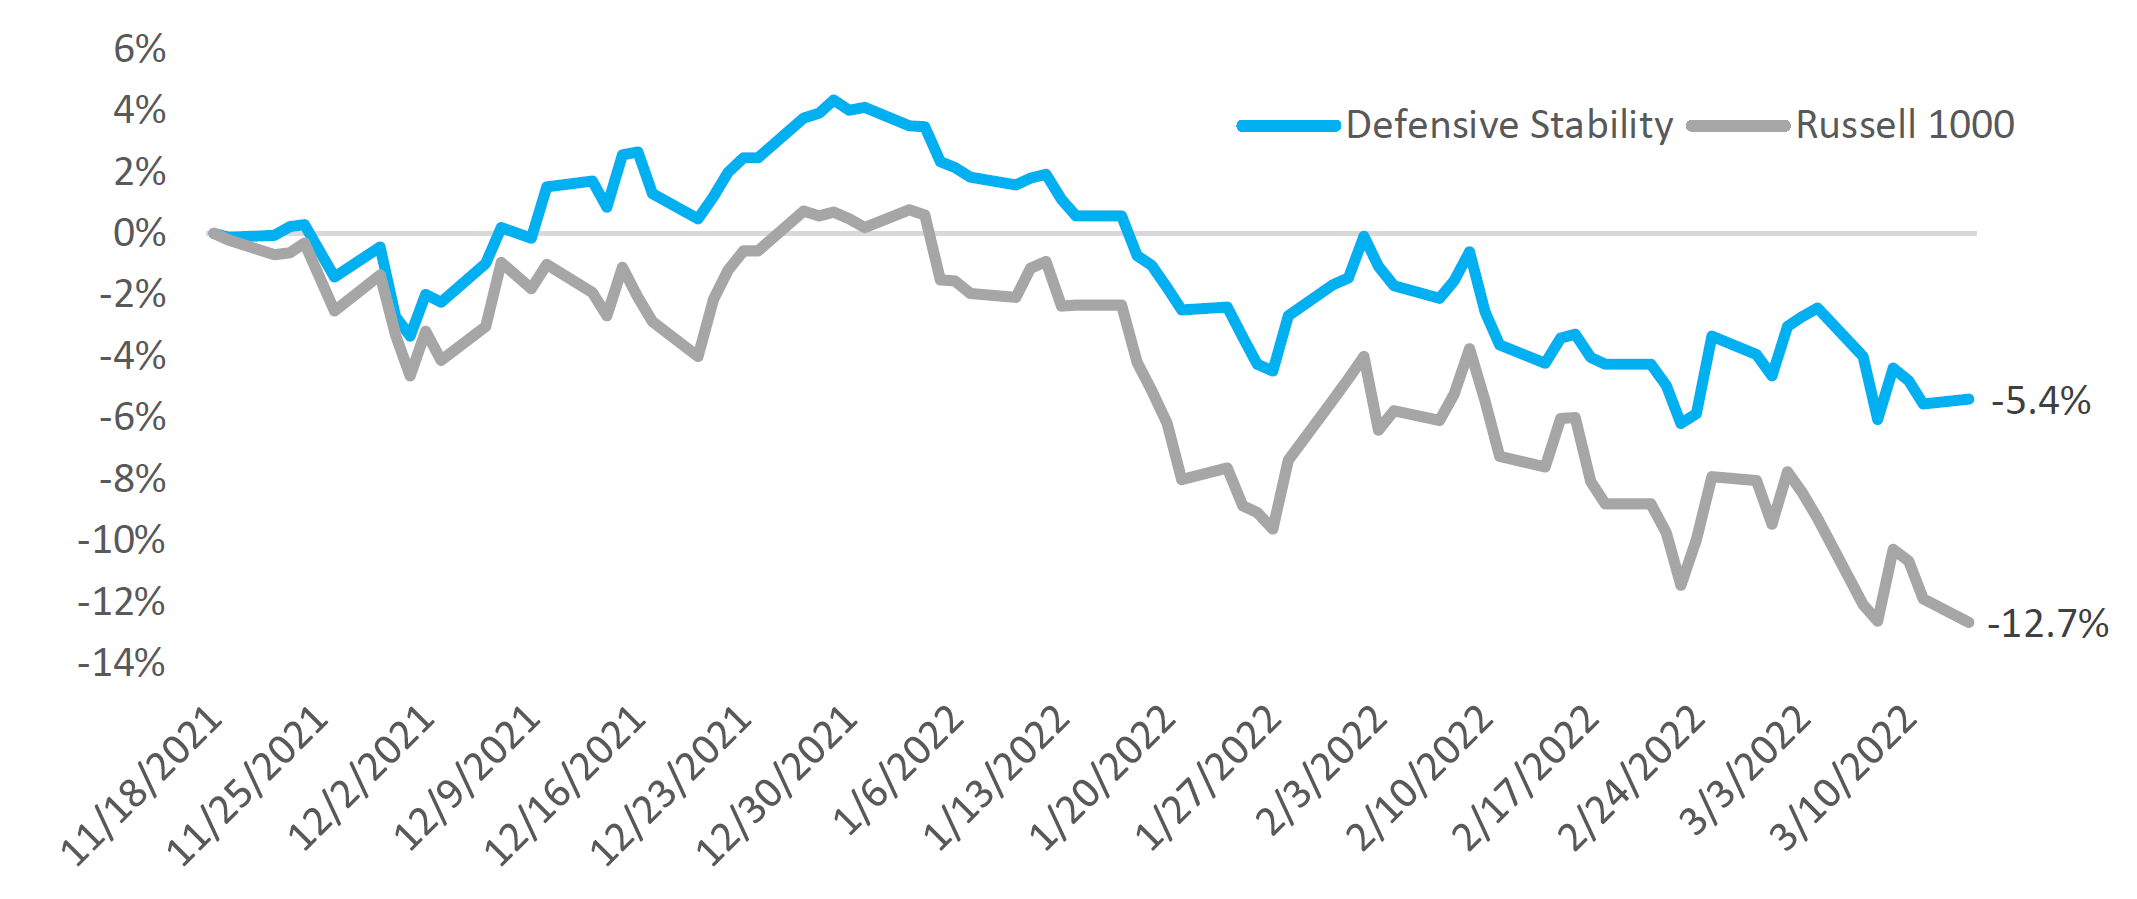
Source: OSAM, FTSE Russell. Data as of March 14.
Outlook
Of course, investors are united in hoping that this year’s market weakness, as well as the economic and geopolitical forces that have fueled it, will prove to be short-lived.
But hope is not a legitimate investment strategy. Instead, our research finds that focusing on the most stable companies can provide protection in down markets. Should the risks in today’s market materialize, this could help investors to shield their portfolios.
Importantly, however, long-term data suggest that lower-risk strategies can be an important part of an investor’s core equity allocation, not simply a response to challenging near-term conditions. By protecting on the downside – preparing for market weakness before it hits your portfolio – defensive equity strategies have delivered meaningfully better risk-adjusted returns over the long term.
Important Legal, Canvas®, Hypothetical and/or Back-tested Disclosure Information
CANVAS® is an interactive web-based investment tool developed by O’Shaughnessy Asset Management, L.L.C. (“OSAM”) that permits an investment professional (generally a registered investment advisor or a sophisticated investor) to select a desired investment strategy for the professional’s client. At all times, the investment professional, and not OSAM, is responsible for determining the initial and ongoing suitability of any investment strategy for the investment professional’s underlying client. The professional’s client shall not rely on OSAM for any such initial or subsequent review or determination. Rather, to the contrary, at all times the professional shall remain exclusively responsible for same. See more about CANVAS below and Release and Hold Harmless at the end of this Important Disclosure Information.
Reliance on Investment Professional: OSAM has relied, and shall continue to rely, on the investment professional’s knowledge and experience to understand the inherent limitations of the performance presentation, including those pertaining to back-tested hypothetical performance. All performance presentations, including hypothetical performance, are the direct result of the investment professional’s request, independent of OSAM. Depending upon the investment professional’s direction and selection, hypothetical presentations can include both OSAM and non-OSAM Models and/or strategies. The below discussion as to the material limitations of back-tested hypotheticals apply to both OSAM and non-OSAM Models and/or strategies.
Intended Recipient: CANVAS content is intended for the investment professional only not to be shared with an underlying client unless in conjunction with a meeting between the investment professional and its client in a one-on-one setting. OSAM assumes that no hypothetical performance-related content will be provided directly to the professional’s client without the accompanying consultation and explanation of the professional. The content is intended to assist the professional in evaluating the appropriate investment strategy for the professional’s client.
OSAM Models. OSAM has devised various investment models (the “Models”) for CANVAS, the objectives of each are described herein. The investment professional is not obligated to consider or utilize any of the Models. As indicated above, at all times, the investment professional, and not OSAM, is responsible for determining the initial and ongoing suitability of any Model for the investment professional’s underlying client. Model performance reflects the reinvestment of dividends and other account earnings and are presented both net of the maximum OSAM’s investment management fee for the selected strategy and gross of an OSAM investment management fee. Please Note: As indicated at Item 5 of its written disclosure Brochure, OSAM’s CANVAS management fee ranges from 0.20% to 1.15%. The average percentage management fee for all CANVAS strategies is 0.36%. The percentage OSAM management fee shall depend upon the type of strategy and the corresponding amount of assets invested in the strategy; generally, the greater the amount of assets, the lower the percentage management fee. Please Also Note: The performance also do not reflect deduction of transaction and/or custodial fees (to the extent applicable), the incurrence of which would further decrease the performance. For example, if reviewing a strategy with a ten-year return of 10.0% each year, the effect of a 0.10% transaction/custodial fee would reduce the reflected cumulative returns from 10.0% to 9.9% on a 1-year basis, 33.1% to 32.7% on a 3-year basis, 61.1% to 60.3% on a 5-year basis and 159.4% to 156.8% on a 10-year basis respectively. Please Further Note: Transaction/custodial fees will differ depending upon the account broker-dealer/custodian utilized. While some broker-dealers/custodians do not charge transaction fees for individual equity (including ETF) transactions, others do. Some custodians charge fixed fees for custody and execution services. Choice of custodian is determined by the investment professional and his/her/its client. Higher fees will adversely impact account performance.
OSAM does not maintain actual historical performance results for the Models. In order to help assist the investment professional in determining whether a Model is appropriate for the professional’s client, OSAM has provided back-tested hypothetical (i.e., not actual) performance for the Model. OSAM, with minor deviations that it does not consider to be material*, currently uses the Models (i.e., live models vs. the reflected back-tested versions thereof) to manage actual client portfolios (see Model Deviations below). The performance reflects the current Model holdings, which are subject to ongoing change.
Material Limitations: The Performance is subject to material limitations. Please see Hypothetical/Material Limitations below. During any specific point in time or time-period, the Models, as currently comprised, performed better or worse, with more or less volatility, than corresponding recognized comparative indices, benchmarks or blends thereof.
Past performance may not be indicative of future results. Therefore, it should not be assumed that future performance of any specific investment or investment strategy (including the Models), will be profitable, equal any historical index or blended index performance level(s), or prove successful. Historical index results do not reflect the deduction of transaction and custodial charges, or the deduction of an investment management fee, the incurrence of which would have the effect of decreasing indicated historical performance results. The Russell 3000 is a market capitalization-weighted index of 3000 widely held large, mid, and small cap stocks. Russell chooses the member companies for the Russell 3000 based on market size and liquidity. The MSCI All Country World Index is a market capitalization weighted index designed to provide a broad measure of equity-market performance throughout the world. The MSCI is maintained by Morgan Stanley Capital International and is comprised of stocks from 23 developed countries and 24 emerging markets. The Barclays Capital Aggregate Bond Index is a market capitalization-weighted index, meaning the securities in the index are weighted according to the market size of each bond type. Most U.S. traded investment grade bonds are represented. Municipal bonds and Treasury Inflation-Protected Securities are excluded, due to tax treatment issues. The index includes Treasury securities, Government agency bonds, Mortgage-backed bonds, corporate bonds, and a small amount of foreign bonds traded in U.S. The historical performance results for the Russell 3000, MSCI and Barclays are provided exclusively for comparison purposes only, to provide general comparative information to help assist in determining whether a Model or other type strategy (relative to the reflected indices) is appropriate for his/her investment objective and risk tolerance. Please Also Note: (1) Performance does not reflect the impact of client-incurred taxes; (2) Neither Model or the selected strategy holdings correspond directly to any such comparative index; and (3) comparative indices may be more or less volatile than the Model or selected strategy.
Hypothetical/Material Limitations-performance reflects hypothetical back-tested results that were achieved by means of the retroactive application of a back-tested portfolio and, as such, the corresponding results have inherent limitations, including: (a) the performance results do not reflect the results of actual trading using investor assets, but were achieved by means of the retroactive application of the Model or strategy (as currently comprised), aspects of which may have been designed with the benefit of hindsight; (b) back tested performance may not reflect the impact that any material market or economic factors might have had on OSAM’s (or the investment professional’s) investment decisions for the Model or the strategy; and, correspondingly; (c) had OSAM used the Model to manage actual client assets (or had the investment professional used the selected strategy to manage actual client assets) during the corresponding time periods, actual performance results could have been materially different for various reasons including variances in the investment management fee incurred, transaction dates, rebalancing dates (increases account turnover), market fluctuation, tax considerations (including tax-loss harvesting-increases account turnover), and the date on which a client engaged OSAM’s investment management services.
MORE ABOUT CANVAS®
CANVAS® is an interactive web-based investment tool developed by O’Shaughnessy Asset Management, L.L.C. (“OSAM”) that permits an investment professional (generally a registered investment advisor or a sophisticated investor) to select a desired investment strategy (the “Strategy”) for the professional’s client. At all times, the investment professional, and not OSAM, is responsible maintaining the initial and ongoing relationship with the underlying client and rendering individualized investment advice to the client. In addition, the investment professional and not OSAM, is exclusively responsible for:
- determining the initial and ongoing suitability of the Strategy for the client;
- devising or determining the specific initial and ongoing desired Strategy;
- monitoring performance of the Strategy; and,
- modifying and/or terminating the management of the client’s account using the Strategy.
Hypothetical Limitations: To the extent that the investment professional seeks for CANVAS to provide hypothetical back-tested performance, material limitations apply-See above.
Model Deviations: As indicated above, OSAM, with minor deviations that it does not consider to be material*, currently use the Models to manage actual client portfolios (i.e., the live Models). The deviations include:
- the use of proxies if and when an ETF used in the back-test was not available*. While the back-tested and live strategies both utilize the same investment themes, back-tested proxies can deviate from live models based on limitations of historical information;
- back-tested data presented utilizes a month-end rebalance while actual live model performance reflects intra-month rebalances;
- OSAM, as a discretionary manager, can update its live models as determined necessary. These changes will then be applied retroactively to back-tested models, the resulting performance of which would be different than that of the actual historical models-see Hypothetical/Material Limitations above; and,
- Financial statement information may be restated over time, which information was not reflected in the historical back-tested models. Companies will also have mergers and acquisitions or other corporate events that can retrospectively affect the names and corporate identities of organizations in the historical back-tests. Data providers providing pricing and return information may update historical data upon discovering deficiencies or omissions.
Strategy Sampling Impact: The implementation of OSAM strategies utilize a sampling of the underlying individual Strategy positions, and, as the result thereof, the underlying securities’ weighting could unintentionally deviate +/- the Strategy allocation target OSAM calculates the CANVAS fees based on the mix of strategies that are utilized at the establishment of the account. Therefore, the sampling approach can cause deviations between the Canvas strategy allocation establishment (and its corresponding fee) and the implementation of that CANVAS strategy.
ESG Portfolios/Socially Responsible Investing Limitations. To the extent applicable to the strategy chosen by the investment professional, Socially Responsible Investing involves the incorporation of Environmental, Social and Governance considerations into the investment due diligence process (“ESG). There are potential limitations associated with allocating a portion of an investment portfolio in ESG securities (i.e., securities that have a mandate to avoid, when possible, investments in such products as alcohol, tobacco, firearms, oil drilling, gambling, etc.). The number of these securities may be limited when compared to those that do not maintain such a mandate. ESG securities could underperform broad market indices. Investors must accept these limitations, including potential for underperformance. Correspondingly, the number of ESG mutual funds and exchange-traded funds are few when compared to those that do not maintain such a mandate. As with any type of investment (including any investment and/or investment strategies recommended and/or undertaken by OSAM), there can be no assurance that investment in ESG securities or funds will be profitable or prove successful.
Tax Management Function: When requested by the investment professional, OSAM will use best efforts to work within Onboarding Budgets, Annual Tax Budgets, and Tracking Error Budgets. However, market and/or specific stock price fluctuations can occur quickly and can correspondingly adversely affect our ability to manage to specified budgets. Additionally, changes to tax budgets, cash flows in and out of an account, mandatory corporate actions, and funding with securities can also impact preciseness. The investment professional must accept this risk. In addition:
- OSAM has not, and will not, verify the accuracy of any tax-related information provided;
- In the event that any such information provided is inaccurate or incomplete, the corresponding results will be inaccurate or incomplete;
- Tracking Error Budgets are relative to the Model, not the benchmark;
- OSAM is not a CPA and this is not tax advice;
- Tax laws and rates change;
- While we seek to follow the investment professional prescribed target models, ranges, timeframes, tax budgets, and seek not to create wash sales or exceed expected tax budgets, there can be no assurance that the CANVAS tool will be able to accurately do so;; and,
- For specific personalized tax-related advice, consult with a CPA or other tax professional.
Fixed Income ETF Model-The models are constructed using passive fixed income ETFs. The models attempt to target varying levels of duration and credit exposure relative to the Barclays Aggregate Index. The expense ratios of the underlying ETF’s are born by the investor and are separate and apart from CANVAS related fees.
Miscellaneous Limitations/Issues:
- Results in the Transition Portal reflect expense ratios corresponding to the specific funds indicated/provided by the investment professional. Expense ratios are provided by an unaffiliated database. Results also reflect projected future yields corresponding to such current indicated funds. Such data may not be precise;
- The risk-free rate used in the calculation of Sortino, Sharpe, and Treynor ratios is 5%, consistently applied across time;
- OSAM did not begin to offer CANVAS until April 2019. Prior to 2007, OSAM did not manage client assets; and,
- A copy of OSAM’s written disclosure Brochure, Form CRS and Privacy Notice remains available on this CANVAS website or at www.osam.com.
Release and Hold Harmless
The professional, to the fullest extent permitted under applicable law, agrees to release, defend, indemnify and hold OSAM (including its officers, directors, members, owners, employees, agents, and affiliates) harmless from any and all adverse consequences, financial or otherwise, of any type or nature arising from or attributable to the professional’s access to, and use of, CANVAS, including, but not limited to, any claims for alleged or actual client losses or damages of any kind or nature whatsoever (including without limitation, the reimbursement of reasonable attorney’s fees, costs and expenses incurred by OSAM relating to investigating or defending any such claims and/or demands), except to the extent that actual losses are the direct result of an act or omission by OSAM that constitutes willful misfeasance, bad faith or gross negligence as adjudged by a court of final jurisdiction.
*except in the unlikely event that the performance of the proxy used in lieu of the actual ETF was materially different (positive or negative)
Lastly, please be advised, without limitation, OSAM shall not be liable for Losses resulting from or in any way arising out of (i) any action of the investor or its previous advisers or other agents, (ii) force majeure or other events beyond the control of OSAM, including without limitation any failure, default or delay in performance resulting from computer or other electronic or mechanical equipment failure, unauthorized access, strikes, failure of common carrier or utility systems, severe weather or breakdown in communications not reasonably within the control of OSAM, inaccuracy or incompleteness of any third-party data, or other causes commonly known as “acts of God,” or (iii) general market conditions. Under no circumstances shall OSAM be liable for consequential, special, incidental or indirect damages, punitive damages, or lost profits or reputational harm. Additionally, the responsibility solely rests on the “master user” of CANVAS at each independent firm, and NOT OSAM, to close out any associated users who may terminate at any time.
O’Shaughnessy Asset Management, LLC (OSAM) is a wholly owned subsidiary of Franklin Resources Inc./(Franklin Templeton).


