Mispriced Innovation – Patents as a Leading Indicator for Earnings Growth
By Daniel Nitiutomo, Lucas Von Reuss, Phlip Creutzmann
July 2019
By protecting intellectual property rights, patents act as a safeguard for the economic interests of inventors and give them incentive to innovate. The innovations that they were designed to protect are a driving force of technological and social change. From Thomas Edison’s incandescent light bulb to Karl Benz’s gas-engine automobile to Apple’s iPhone, many iconic inventions that have had profound impacts on society can be traced back to patents granted by International patent offices. While the vast majority of those inventions did not have the same level of economic success as the iPhone, they were nonetheless indicative of some value to those that patented them. Given the expenses and effort necessary to innovate, it follows that most patent applicants have the expectation that they will be compensated by the ideas they seek to protect. This could be through the exclusive sale of a new pharmaceutical drug discovered, the competitive advantages gained from improved operating processes, or receiving royalties from a revolutionary gene-editing technology. Everything considered, patents provide a signal of future economic value through the creation of a competitive moat.
The resulting value, however, is uncertain in both timing and magnitude. This uncertainty drives inefficiencies in the market and creates opportunities for investors who can attribute value to the potential outcomes. The market often ignores this information due to a lack of knowledge or a lack of availability. With the rise of the intangible economy, these off-balance sheet items are set to become more and more relevant to assessing the fundamental growth prospects of a company. The industry leaders of today are attempting to protect their status by innovating and engaging in a flurry of patent activity; as demonstrated by the steady increase in worldwide patent applications over the last 30 years. This trend shows no sign of stopping. The increasing pace of technological change evaporates competitive moats, mandating constant innovation. Companies able to stay at the technical and ideological forefront of their respective fields will inevitably stay ahead of the competition; as will investors able to identify these innovation leaders.
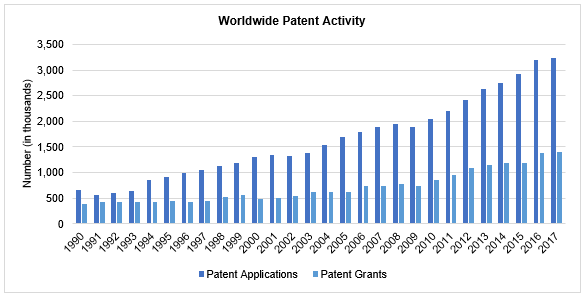
Source: WIPO IP Statistics Data Center1
Through our Research Partners program, OSAM has established a partnership with Quant IP, a company that has developed expertise preparing the data for use in quantitative finance and asset management. The team at Quant IP is comprised of patent experts and data scientists that have already structured and organized publicly available patent data from multiple International patent offices. This paper is a combined effort, matching their deep expertise of patents with our deep expertise in market research.
Granted Patents2
A patent is a legal title that gives inventors the right, for a limited period of usually 20 years, to prevent others from making, using, selling their invention without their permission in countries for which the patent has been granted. An invention is patentable if it involves a new, inventive step compared to the current state of the art and not obvious to someone knowledgeable in the subject.3 Patents are granted by individual government organizations and are valid only in the countries or regions those organizations are responsible for.
The Patent Universe
Given the signal of economic value patents provide, there should be benefits to investing in companies that actively create them over those that do not.
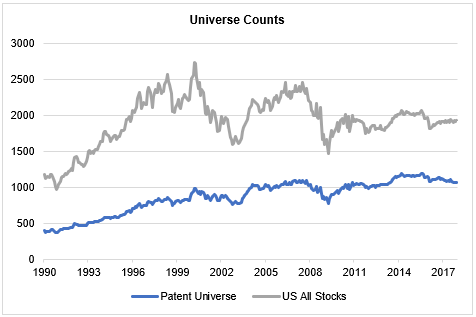
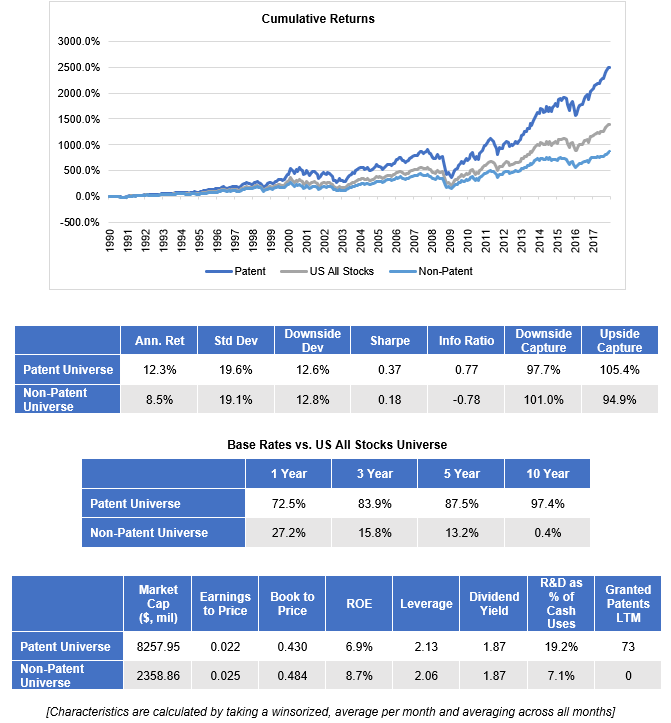
To structure this analysis, we start with all actively traded public companies within the US that are over $200 million in market cap (OSAM’s US All Stocks Universe). We then take the companies that have at least one granted patent within the last year to create a “Patent Universe.” Constituents for each universe are determined every month. Financials are excluded from this analysis given the lack of availability of patent data and the lack of historical relevance to the business models. The analysis of the patent universe starts in 1990 with roughly 400 stocks and ends in 2017 with 1100 stocks. The “non-patent universe” refers to any companies in US All Stocks without a grant in the last year. All relative returns in this paper are presented in excess of the US All Stocks universe ex-financials, which returned an annualized 10.2% over the period of analysis.
Overall, the patent universe has outperformed the US All Stocks universe by an annualized 2.2% over the analysis period and 3.8% over the non-patent universe, assuming a 1 year holding period and equal weighting. Patent companies have outperformed non-patent companies on almost all risk-adjusted return metrics and have provided consistent outperformance with a 72.5% 1-year base rate. In other words, of all the full 1-year periods between the start and end date of the analysis, the patent stock portfolio outperformed US all stocks 72.5% of the time. Similarly, the 3-year base rate of 83.9% signifies that the patent stock portfolio was able to outperform all stocks in 83.9% of all full 3-year periods within the analysis.
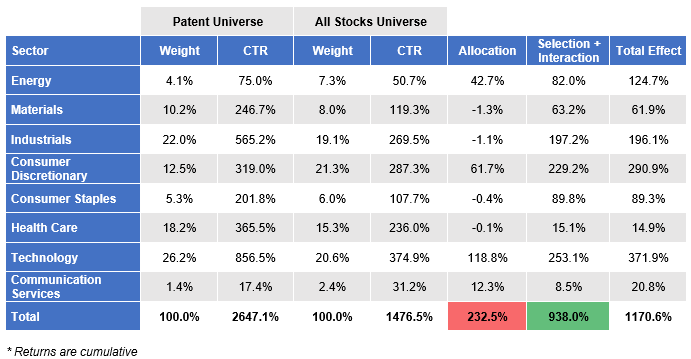
Some industries and sectors are more likely to have patents than others. The largest sector overweights in the Patent Universe are Technology, Health Care, and Industrials. These sectors also happened to be the top performance contributors to US All Stocks. Accounting for these allocation decisions by decomposing returns through a Brinson Sector attribution, roughly 80% (938% of 1170.6%) of the patent universe’s excess returns were driven by stronger selection within sectors, with only 20% driven by broader allocation (sector) effects.
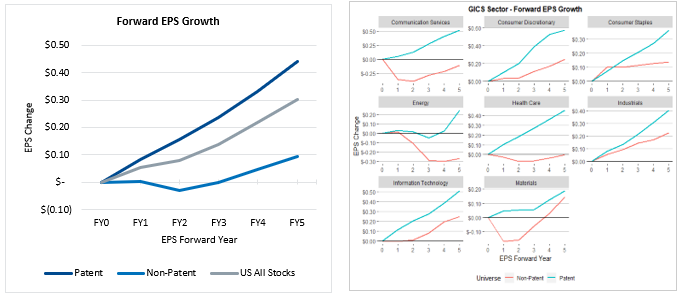
Patent companies were also able to achieve higher average earnings per share growth. The chart below shows the average forward 1 to 5 year earnings per share change for a portfolio comprised of all companies within each respective universe. The EPS growth outperformance remains when looking at individual sectors.
Granted Patent Factor
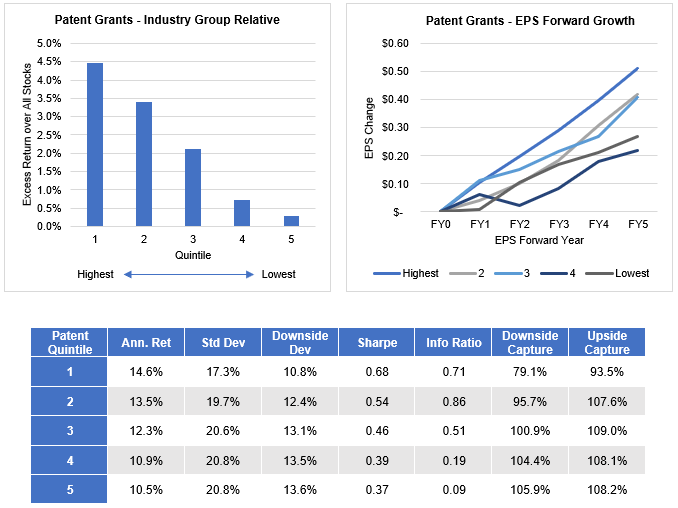
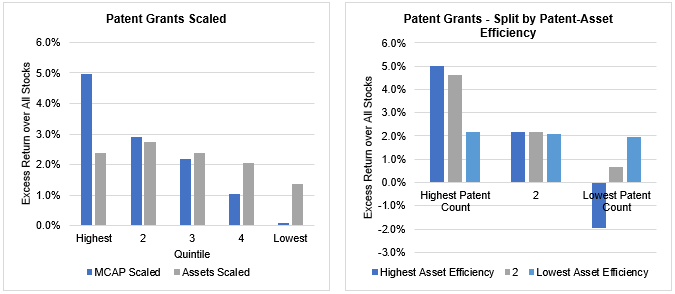
Just the existence of patent activity seems to be indicative of excess returns and earnings growth. Patent activity, however, varies greatly between industries and companies within those industries. Extending the analysis, we now consider the magnitude of that activity to gain more insight into the relationship with future stock performance. We rank the patent universe by grants in the last year on a GICS industry group relative basis. The universe is then split into quintile factor portfolios every month and each portfolio is backtested using a 1 year holding period. The results show that there is a clear positive relationship between grant counts and excess returns. The return spread between the top and bottom quintiles is relatively narrow at 4.1%, but the patent universe itself outperformed giving the highest quintile an overall excess return of 4.5% against the all stocks universe. Base rates for the top 3 groups look to be particularly consistent. The 4th and 5th quintiles have outperformed US All Stocks in 100% and 99% of 5-year base rate periods from 1990 to 2017. They also exhibit downside protection benefits with low relative downside deviation and downside capture. While not as clear, there also appears to be a positive relationship with EPS growth.
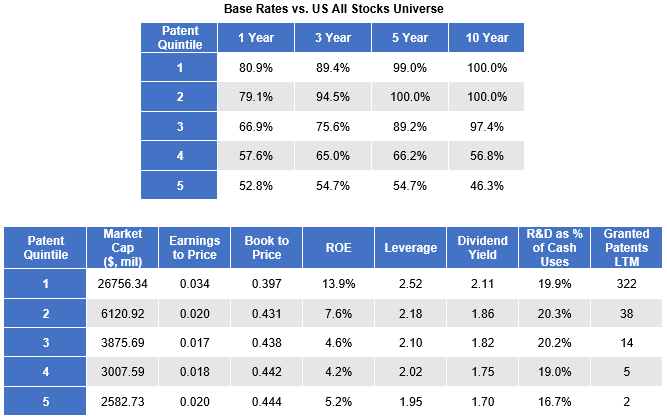
The summary characteristics highlight the correlation between grant counts and market cap. Patents take resources to acquire and resources to defend. The more patents granted over the last year, the more resources likely went into curating that portfolio of patents. Also, there are significant legal fees involved to protect and enforce patents through potential litigation. Larger companies have more resources at hand for these purposes and therefore will be overrepresented in the higher quintile portfolios of the grant count measure.
While high market cap companies have outperformed over the analysis time period, that outperformance is small in comparison to the alpha generated from the patent metric. Splitting the universe into market cap thirds and testing the factor shows the factor’s effectiveness across market cap ranges. We split into thirds here to ensure enough coverage when dividing the universe into nine groups.
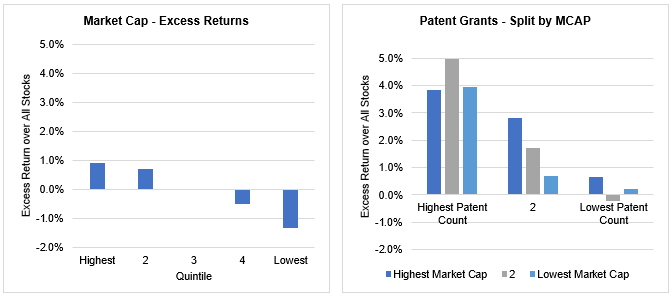
Scaling by market cap provided a 4.9% return spread between top and bottom groups, 0.8% wider than the unscaled factor. This eliminates any market cap bias but is akin to a value factor as the highest quintile can be considered the “cheapest” patent portfolio and the low quintile can be considered the most “expensive.” When scaled by assets, however, the return spreads are significantly muted. This brings to light another, more nuanced aspect of patents. Patent efficiency metrics (such patents per dollar of assets) work effectively for high patent firms but do not work for low patent firms; due to the higher relevance of innovation and intellectual property protection to the core business. These metrics, however, deserve another full-length paper to discuss and are out of scope for the purposes of this paper.
Patent Leaders
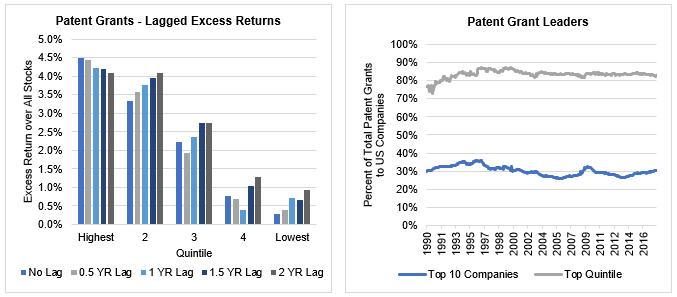
The alpha produced by the granted patent factor remains remarkably consistent even when lags are applied. A forced lag of 2 years on the data only decreases the overall spread between high and low groups by 1.1%. The stability of this signal can be attributed to the low year over year turnover between factor quintiles, especially in the top group. Between 1990 and 2017, 85% of the stocks within the top quintile portfolio remained in the top quintile the following year. This lack of turnover is to be expected. The resources and expertise required to develop, acquire and maintain patents do not disappear overnight. Companies will continue to leverage those resources to innovate and apply for patents in the future. Those same companies are also very efficient at producing grants; skewing the overall distribution of granted patents within the universe. 30% of total grants have been issued to the top 10 grant producers and 80% of grants have been issued to the top quintile. As a result, the top grant producers at any given time are difficult to overtake and are likely to remain at the top.
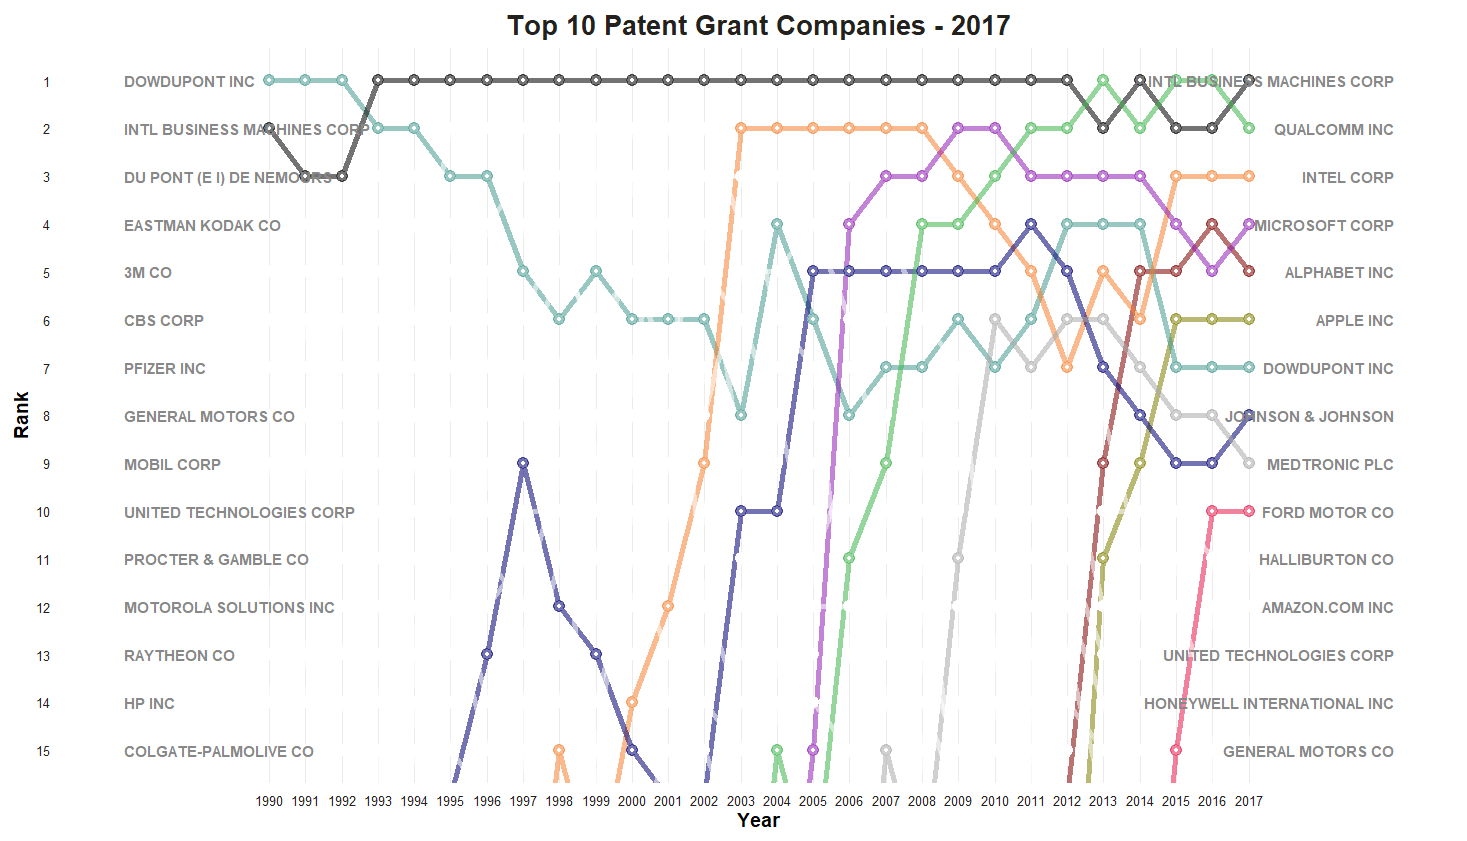
This staying power can be seen by looking at the top companies throughout the time period. The graphic below highlights the change in rankings of the 10 highest annual granted patent companies in 1990. Of those top companies, two remain in the top 10 in 2017 and half remain within the top 20 (6 if you count the merger of Dow Chemical Company and DuPont). IBM stands out in particular, as it has been the top patent producer in the US for 22 of the 28 years.
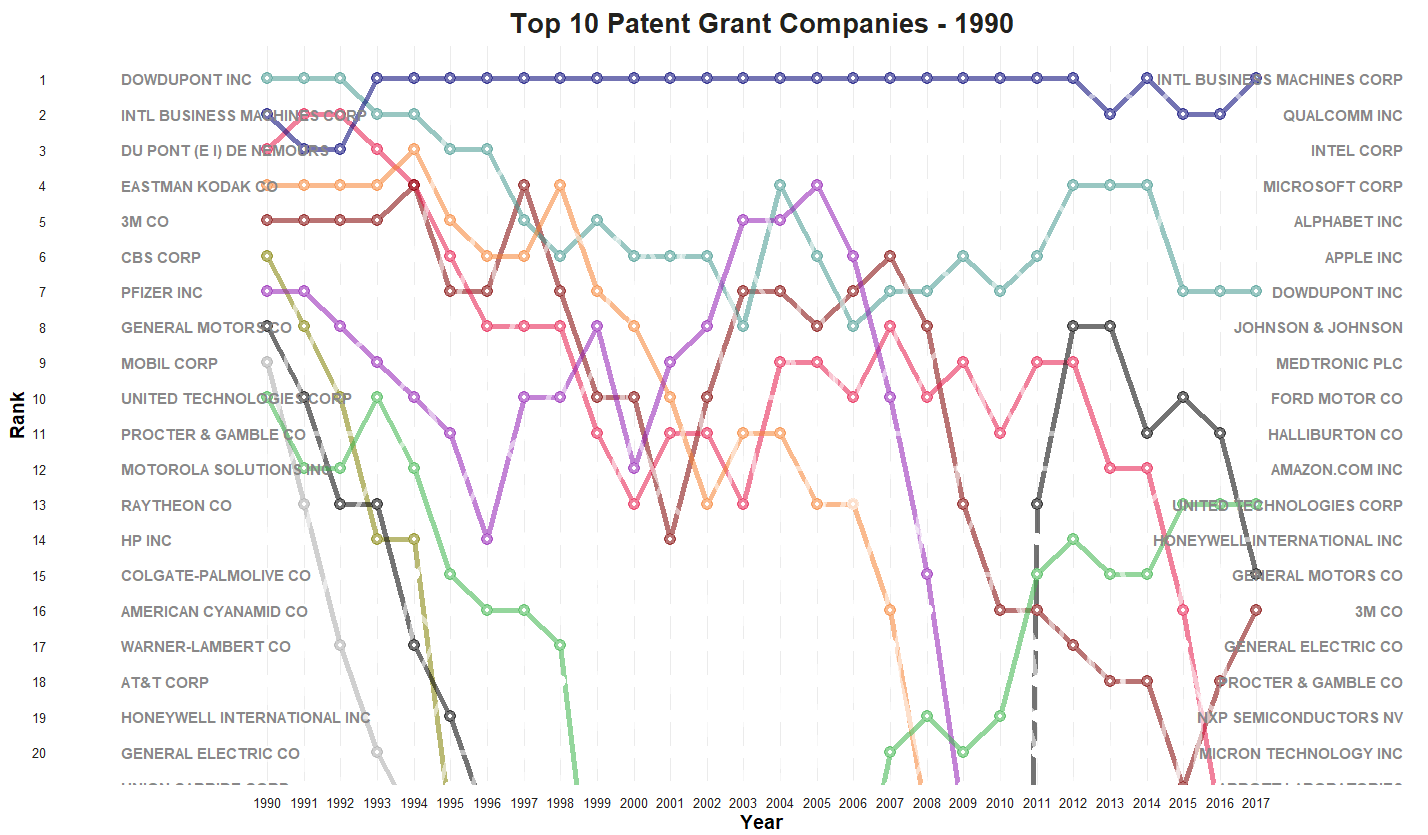
While the composition of names may be sticky year to year, generational technological changes and themes can be tracked by long term trends in patent leadership. For example, 1990 saw the top 10 patent producers span 6 sectors. Consumer Discretionary was the most represented sector with 3 names and IBM was the sole Technology company. Fast forward to 2017, all of the top 6 patent producers were Technology stocks. More specifically, they were all leaders in either the Smartphone, Cloud Computing, and/or Internet Services industries, which have experienced explosive adoption and growth over the past decade. These companies have spent enormous resources to protect their intellectual property through patenting activity and to solidify their position as industry leaders.
This spend is for good reason, especially as their innovative products and designs begin to gain mainstream adoption in the wider market. An illustrative example of this is the Apple-Samsung lawsuit which began in 2011 and concluded in 2018. Apple launched the iPhone in 2007 and received several design and utility patents to accompany the launch. Soon afterwards, the iPhone established itself as a dominant player in the US market. In 2011, the company alleged that Samsung’s smartphone and tablet products copied many of Apple’s patented features and filed a lawsuit against Samsung for patent infringement. After seven long years of litigation, Apple was awarded $539 million for damages in a US Federal District Court4. Even though this amount represented a small fraction of total revenue, it highlights how the practical protections afforded by patents can lead to economic outcomes outside of the underlying innovation itself.
R&D Capital
Research and Development (R&D) expense is a much more common innovation proxy due to its wide availability as a reported item on the income statement and its role as a raw resource for intellectual property and patents. Despite the potential long-term benefits and output from R&D expenditures, US GAAP requires R&D to be written off immediately as an operating expense in the period incurred. This creates a timing mismatch between the expenditures and the value they create as it reduces net income for the current period without regard to future benefits. It has been argued by many that capitalizing R&D is more appropriate for financial analysis and valuation purposes.5 6 To account for the potential multi-period benefits from R&D expenditures, we capitalize R&D reported by the company over the trailing 5 years assuming straight line depreciation.
On a standalone basis, R&D Capital is a less robust innovation metric than granted patents. Research and Development costs contribute to the creation of the intellectual property that patents provide protection for. R&D activity is conducted earlier on in the innovation lifecycle and further removed from economic value realization than patents. R&D expense is also highly discretionary without strict guidelines from the FASB as to what is included or excluded. This greater uncertainty with respect to output and the potential noise introduced by arbitrary reporting decisions is reflected in a comparison of Patent and R&D companies.
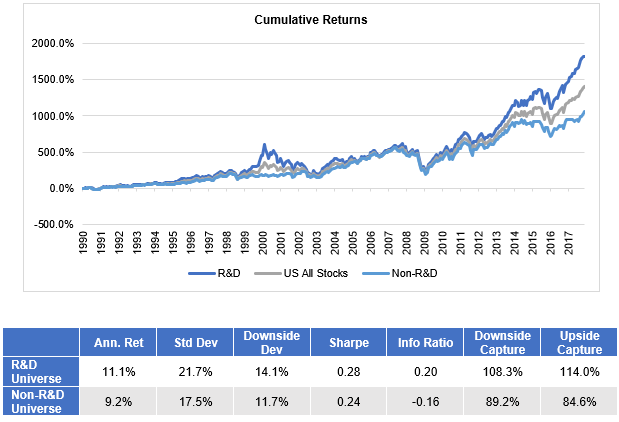
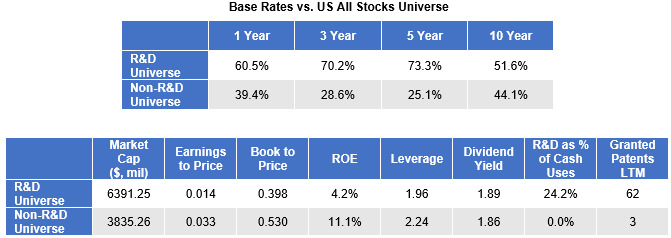
Following a similar analysis as granted patents, we construct a “R&D Universe” by including any company with a non-zero value for R&D capital within US All Stocks. This universe has comparable availability to the patent universe with about 400 stocks in 1990 and 1100 in 2017. Over the time period, the R&D universe had an annualized excess return of +1.0% over the all stocks universe and underperformed the patent universe by -1.2% with higher volatility. The outperformance against all stocks was almost entirely captured within the last 8 years of the analysis. From 1990 through 2009, there would have been almost no advantage to investing in companies that reported R&D vs. ones that did not.
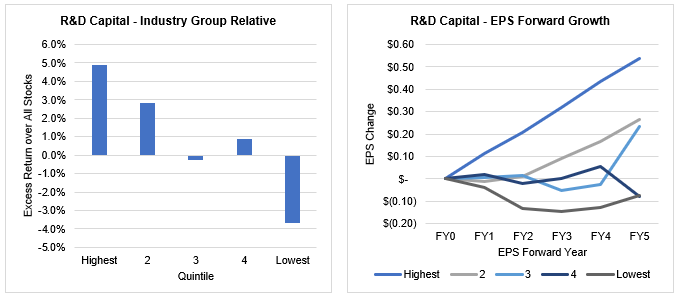
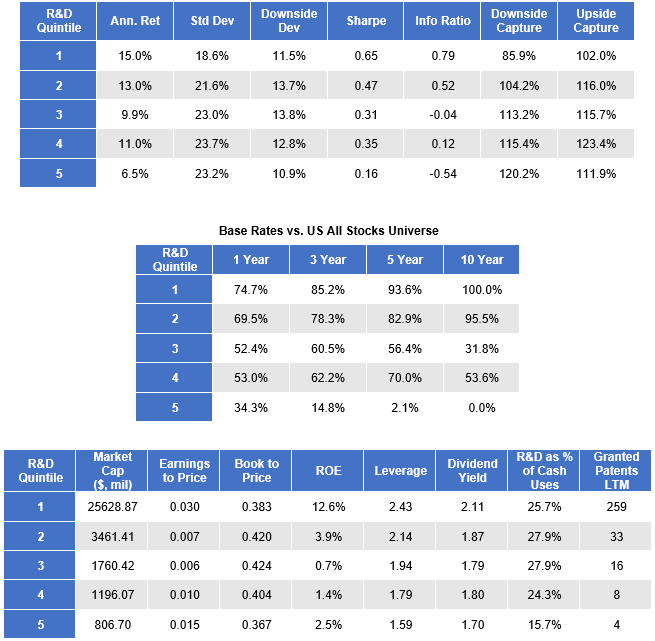
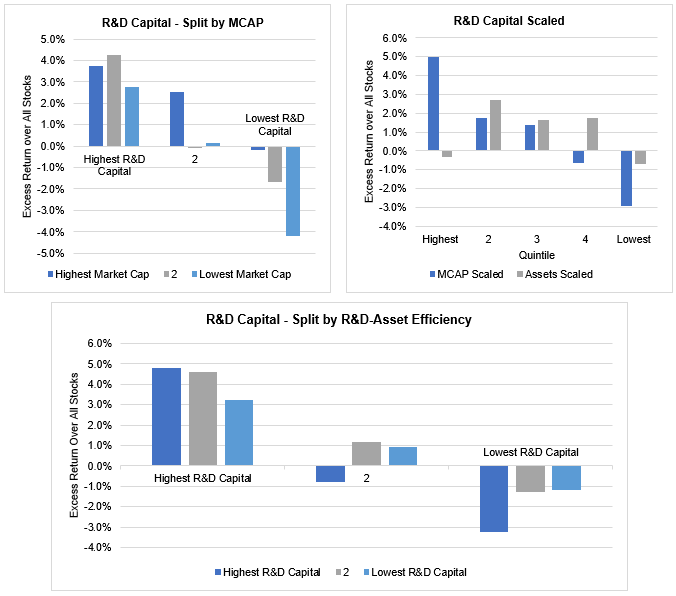
For R&D capital factor analysis, we once again rank stocks on a GICS industry group relative basis. The factor did provide a much wider return spread than granted patents at 8.5%, but with higher standard deviation of returns within the quintile portfolios which lowered overall risk adjusted returns. Base rates indicated consistent outperformance for the highest R&D spenders and consistent underperformance for the lowest. A higher dispersion of outcomes is seen within the future earnings growth trajectories when compared with grants. The highest R&D Capital portfolio signaled strong future EPS growth just as the top grant quintile did, but the other quintile portfolios skewed lower.
Again, there is obvious market cap bias within the R&D capital factor. The factor, however, similarly works across multiple market cap groups. The market cap scaled factor indicates a similar excess return profile as the unscaled factor, albeit with higher volatility and lower risk adjusted returns for each group. The asset scaled metric shows poor effectiveness as a standalone factor with the highest quintile underperforming the US all stocks portfolio. Similar to granted patents, the factor does show limited effectiveness for high R&D intensity firms and a negative relationship with low R&D intensity firms; highlighting how efficiency metrics may work differently based on the importance of innovation to the core business.
Patents and R&D Universe Overlap
Despite the close relationship of patents and R&D in the innovation process, roughly 20% of stocks within each universe do not overlap. We can further identify an innovation focused universe by looking at the overlap between Grants and R&D Capital and filtering out less innovation driven companies.
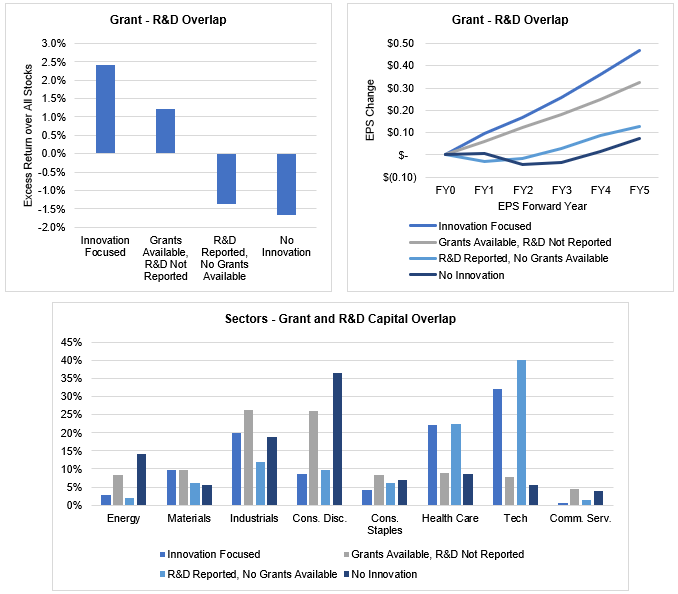
Innovation Focused - Grants and R&D Reported (Avg. 35.4% of All Stocks Universe)
The innovation focused group represents companies that are reporting spending on R&D and producing patents to protect their intellectual capital. These stocks have achieved the highest returns out of all groups and exhibit the highest average future earnings growth. Technology, Health Care, and Industrials are heavily represented comprising 74% of the group vs. 55% of the All Stocks Universe ex-financials and 66% of the Patent Universe. Selection effects from a Brinson Attribution remain the primary driver of returns by far throughout the period.
Grants Available, R&D not reported (Avg. 16.6% of All Stocks Universe)
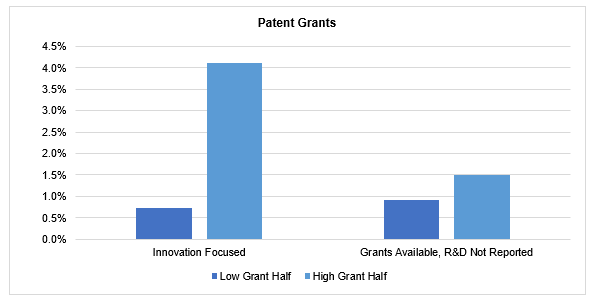
Management has discretion over whether to report R&D as a standalone item or grouped in with other operating expenses. If they choose not to report, either management has decided that R&D is not significant enough to break out as its own line item or there was an oversight in the reporting process. Having granted patents overall is still a net positive, but it is more valuable for innovation focused firms that choose to distinguish between R&D expenses and other operating expenses. This is seen in the decreased spread between high grant and low grant companies within the Innovation focused group and the companies with Grants but no R&D. Most of these companies are in the Consumer Discretionary and Industrials sectors and have significantly higher percentage of capital expenditures vs R&D companies.
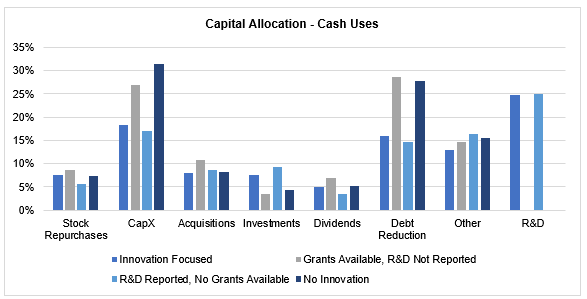
R&D Reported, No Grants (Avg. 9.7% of All Stocks Universe)
This group is heavily overweight Technology and Health Care sectors; both sectors that are traditionally R&D and patent centric. They differentiate R&D from operating expenses but have limited patentable Intellectual property or do not feel the need to patent their R&D output. Looking at their capital allocation decisions (derived from the cash flow statement and adjusted for R&D expenses), their average historical capital allocation decisions look nearly identical to those in the high innovation group. All else being held equal, those companies who are producing intellectual property worth patenting are likely more efficient at translating R&D to economic value than those that are not. This explains the significant future EPS growth underperformance and the 3.5% annualized relative outperformance of companies with recent patent activity over those without.
Low Innovation (Avg. 38.3% of US All Stocks Universe)
This final group had no granted patents within the last year and had no reported R&D expenses over the trailing 5 years. They underperformed all other groups in returns and EPS growth and were heavily overweight the Consumer Discretionary sector.
Innovation Composite
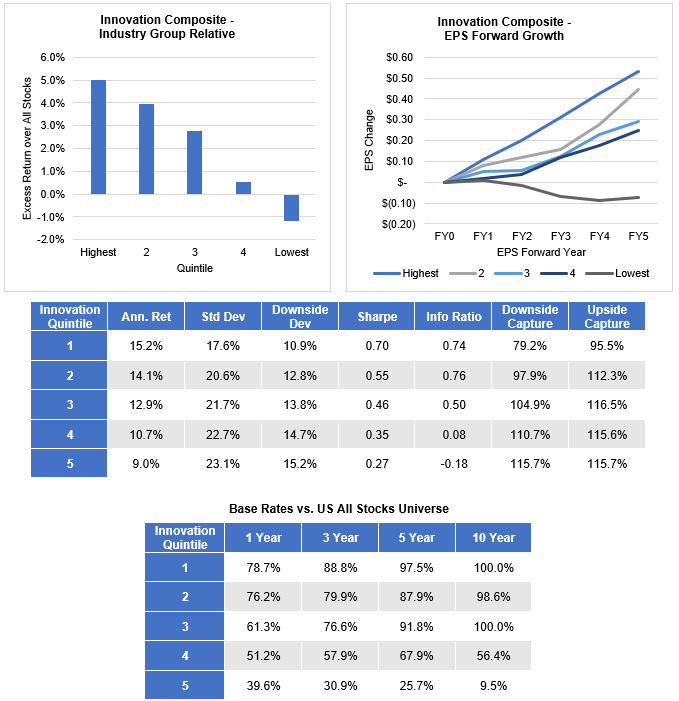
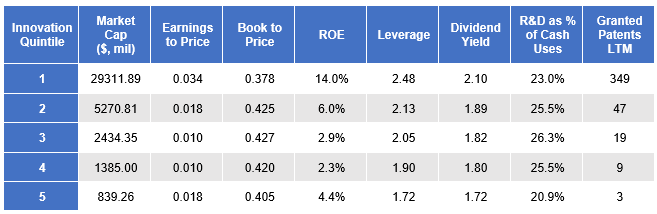
Isolating innovation focused companies can help us to further differentiate outperformers vs. underperformers. To rank innovation, we create a composite of the Granted patents and R&D Capital factors. The composite cross-sectionally ranks each of the factors across the universe from 0 to 100, averages the ranks, and re-ranks the averaged number to calculate the final composite.
Despite high correlation, compositing granted patents and R&D capital adds value through improved absolute and risk adjusted returns. Similar to the granted patent metrics, the innovation composite offers significant base rate performance against the US All Stocks universe and significant downside protection for the top ranked companies. There is also clearer separation between quintiles for future EPS growth.
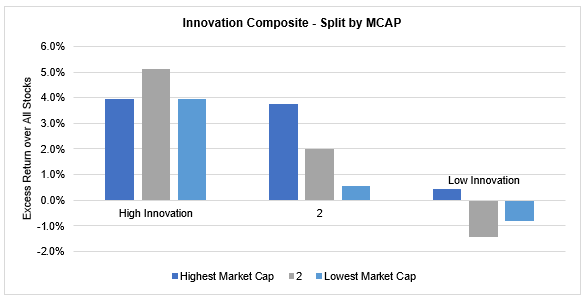
Once again, the composite works very well across market cap groups.
Value and Glamour within Innovation
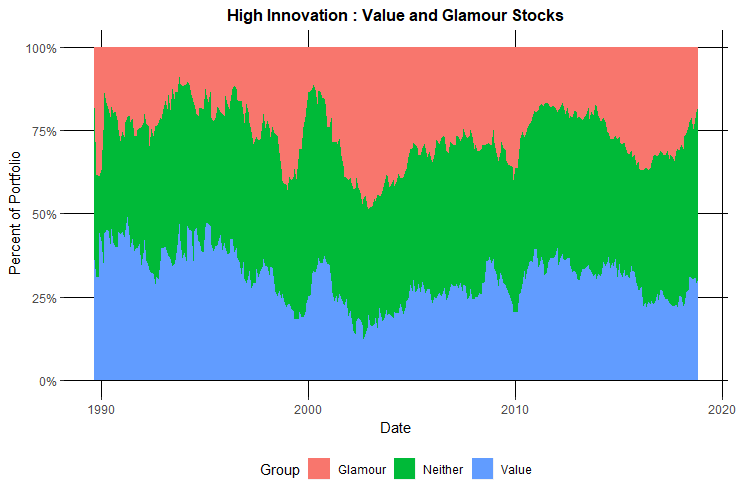
Given that innovation is a leading indicator for earnings growth, we would not expect a high percentage of the top quintile companies to be priced cheaply by the market. With the past decade considered one of the longest periods of growth outperforming value, we want to ensure that the innovation factor’s outperformance cannot be explained by the latest growth regime. To test, we look at the underlying distribution of value and glamour stocks within the top innovation quintile. The value group contains the cheapest third of the US all stocks universe and the glamour group consists of the most expensive third. Relative value is determined by OSAM’s Value composite, which is comprised of Earnings to Price, EBITDA to EV, FCF to EV, and Sales to Price value factors. Looking at the distributions through time, there are no biases that stand out. While the distributions do change over time, high innovation companies were never significantly overweight growth or value. Without a bias, we can safely assume that the factor’s performance is not a result of the latest growth trend.
Mispriced Innovation and Value Traps
Outside of the past decade, value as a factor has delivered significant excess returns over the past century and as a result has become one of the most widely used factors in quantitative investment management. Livermore, Meredith and O’Shaughnessy explain why the value factor has worked7:
“Certain [Value] stocks in the market are experiencing weakness in their fundamentals. The weakness could be driven, for example, by downturns in the profit cycles of the underlying companies or deeper problems in their underlying businesses. The market is detecting the weakness and reacting to it by pricing the stocks very cheaply relative to current earnings, which are not expected to be sustained. The Value factor is buying into the stocks at very cheap prices and holding them for a one-year period. During that period, the fundamentals end up coming in weak, as expected. But the market, which is looking farther out into the future, becomes less pessimistic about the stocks and re-rates the stocks higher, lifting their prices and valuations.”
“Factors from Scratch: A look back, and forward, at how, when, and why factors work”
Livermore, Meredith and O’Shaughnessy, May 2018
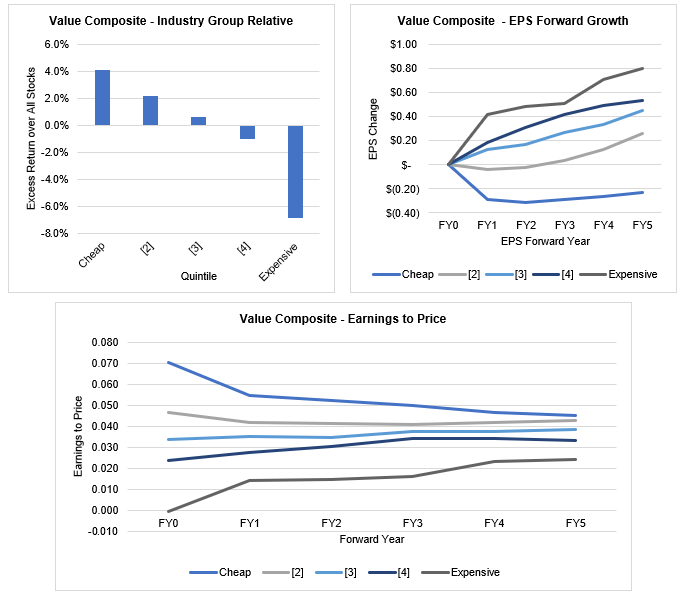
Future EPS Growth and excess returns of the value quintiles demonstrate the mispricing phenomenon. The cheapest quintile of value outperforms all other quintiles despite exhibiting the lower ranking future EPS growth by far. It follows that a re-rating was the primary driver of returns during the holding period, as shown by the quintile portfolio re-ratings based on earnings to price.
Sometimes market pessimism is justified, however. Low trailing multiples correctly price or overprice the fundamental prospects for a company. These stocks, often referred to as “value traps,” do not experience a recovery in earnings and continue to look cheap on a trailing basis. For many quantitative value managers, the difference between outperforming and underperforming hinges on their ability to filter out these performance grenades. Financial quality metrics are often applied to mitigate the risk of inclusion. Given innovation’s positive relationship to earnings growth, the innovation composite provides an effective method of avoiding value traps and selecting cheap, mispriced companies that are likely to show earnings resilience.
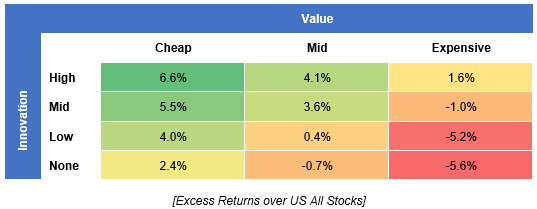
Comparing the intersections between the innovation and value composites using a bivariate analysis highlights this synergetic relationship. We divide each of the composites into thirds to ensure there is enough coverage within the reduced innovation universe. Cheap, high innovation stocks have vastly outperformed expensive, low innovation stocks.
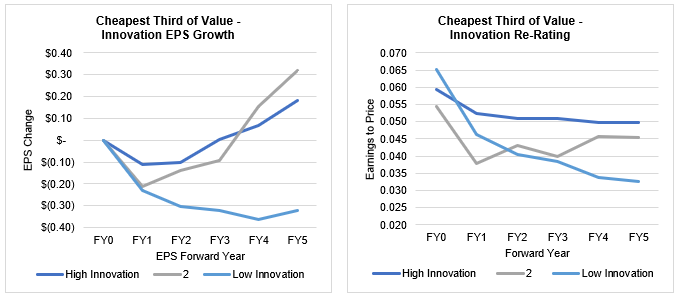
Focusing on the cheapest third of stocks, companies with higher innovation scores still suffered from an initial decline in earnings but that decline was muted in comparison to low innovation stocks. The decline was also followed by earnings expansion over the next few years in the highest two innovation groups. Along with the muted earnings decline, the cheap, high innovation stocks also showed positive re-pricing by the market. Market pessimism, earnings resilience and positive repricing effects all contribute to this group’s outperformance.
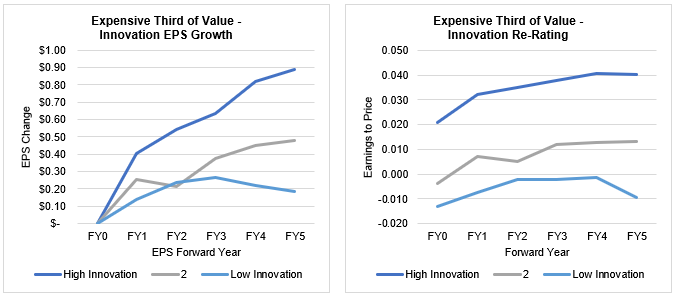
On the flip side of value, expensive companies have over-optimistic expectations about future growth and hence a downward future re-rating. The innovation factor can again be used to differentiate between high and low EPS growth potential. The expensive, high innovation group is more likely to meet growth expectations set by the market and the expensive, low innovation group consists of stocks that are likely to miss them. Each of the expensive portfolios experienced multiple contraction over the upcoming years. High innovation groups grew into their high multiples, whereas the low innovation group failed to do so.
Conclusion
The template presented here has only scratched the surface of the rich information contained in patent data that our research partner, Quant IP, continues to explore. Despite that fact, this analysis has shown that quantitative measures of innovation have the potential to identify mispriced growth opportunities in the market; supporting the notion that innovation is tied to future economic value. These measures of intangible value creation are becoming more relevant to identifying leaders of industry. Firms that maintain their strategic moats by developing and safeguarding intellectual property will continue to build a competitive edge. That edge will drive economic outcomes for both the business and investors. As the landscape of global competition evolves, the speed of innovation and volume of patent activity will increase. Monitoring and applying innovation factors can give investors insight into leading indicators of potential fundamental growth and stock performance not captured by the traditional financial metrics used today.
Appendix
Patent Measures
Since patent applications for the same invention in different jurisdictions/countries are independent, simply counting all applications or documents is not necessarily a good measure for the company's innovative output. Instead Quant IP uses metrics that represent the collection of all documents - applications, granted patents, translations, etc. - that share the same underlying invention. This collection is called a “patent family.” The unique invention count within patent families is a good measure for the raw output of a company's innovation process. Due to international patent laws, patent applications can take up to 18 months to be published after the application date; creating a natural delay in the invention count metric.
While invention count can act as an early indicator for future products, a more robust raw measure is the number of granted patents. This measure captures two additional pieces of valuable information within the patent process. First, it acts as a quality assurance measure since both the company and the patent examiner believe the invention to be novel and therefore patentable. Second, the number of jurisdictions a patent is granted in communicates how a company attempted to position an invention. Highly innovative patents will be applied in multiple countries, whereas, defensive patents may only be applied in one or two core markets. The remainder of the paper focuses on the granted patent measure.
Difficulty in the Data
Despite public availability, the difficulty of organizing and maintaining patent data across multiple governing bodies remains a significant barrier to use. International patent databases were built for patent applicants and examiners to assess the novelty of the innovation by searching through patent catalogs. They were not designed as an analytical tool for company by company research. One of the most challenging issues is the lack standardized company identifiers attached to patent applications. Applicant and assignee names are included within the patent document, but those names could be full names, abbreviated acronyms, or subsidiaries of a parent company. Quant IP has solved the document-to-company mapping challenge by creating proprietary algorithms to standardize names of companies, map subsidiaries based on M&A data, and conduct robust data quality checks.
Footnotes
1 WIPO IP Statistics Data Center, https://www3.wipo.int/ipstats/index.htm?tab=patent
2 Please see the appendix for a description of the data and the difficulties with collection.
3 European Patent Office, https://www.epo.org/service-support/glossary
4 Nicas, Jack. (2018, June 27). “Apple and Samsung End Smartphone Patent Wars.” New York Times, https://www.nytimes.com/2018/06/27/technology/apple-samsung-smartphone-patent.html
5 Damodaran, Aswath. “Research and Development Expenses: Implications for Profitability Measurement and Valuation" (1999). NYU Working Paper No. FIN-99-024
6 Fairchild, Travis. “Negative Equity, Veiled Value, and the Erosion of Price-to-Book” (2018). https://www.osam.com/Commentary/negative-equity-veiled-value-and-the-erosion-of-price-to-book
7 Livermore, Jesse; Meredith, Chris; O’Shaughnessy, Patrick. “Factors from Scratch: A look back, and forward, at how, when, and why factors work” (2018). https://osam.com/Commentary/factors-from-scratch


