O’Shaughnessy Quarterly Investor Letter Q4 2018
By Patrick O’Shaughnessy
January 2019
Dear Investor,
In this letter, I address the most common questions that we field at OSAM by discussing:
I. 2018 performance
II. Whether the market looks attractive as of January 2019
III. Factor performance during 2018 (which started fine and ended very badly)
IV. Our vision for the long-term future of OSAM.
Before addressing these topics, I am very excited to announce that Jim O’Shaughnessy will share the CIO title for the first time since he started in this business in 1987. We are promoting our long-time Director of Research Chris Meredith, CFA to the position of co-CIO at OSAM. Chris has been the primary architect of our research platform over the past 10 years, building a set of data and analytical tools which are, in our opinion, on par with the best in the industry. In recent years, he has also crafted and executed an aggressive research agenda, making it clear to us that he should be a longtime investment leader at our firm working on behalf of our clients. Jim will continue to oversee major research initiatives and control any changes to our investing process and Chris will structure and run the day-to-day investing and research activities at the firm. The O’Shaughnessy name may be on the door, but it is because of Chris and so many others like him at OSAM that we are able to do what we do.
Now back to our agenda. Here is the executive summary:
- Stocks were down in 2018 because of severe multiple contraction. The stock market is much cheaper today than it was three months ago.
- Even after the decline in prices, broad measures of market valuation and trend indicate that we should temper our expectations for equity returns over the next 10+ years. While these measures may urge some caution, we still believe most investors should not attempt to time the market based on value or trend, or for any other reason.
- The safest place in the stock market in 2018 was in very large- and mega-cap stocks. Without exposure to the largest stocks, it was difficult to outperform indexes this year—in value or in growth.
- OSAM is aggressively expanding its platform capabilities. We have a unique way of thinking about how to extend our competitive advantage, which we detail towards the end of this letter.
2018 Performance
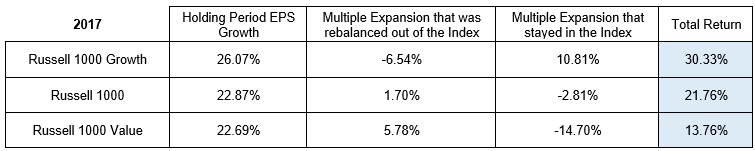
Before assessing stocks through a few different quantitative lenses, it’s helpful to review what happened in 2018 so that we can then look forward from January 2019. Using our framework from Factors From Scratch, we break down performance into fundamental growth and multiple expansion/contraction (both that which remained in the index and that which was “rebalanced” out via changes in index constituents).
Looking back to 2017, we see a goldilocks period for growth stocks—one of strong EPS growth and multiple expansion.
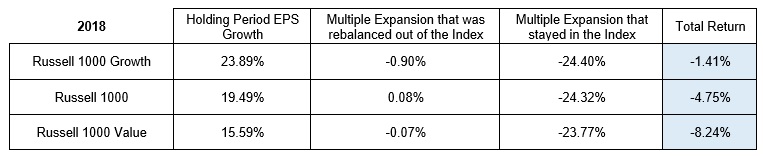
Continuing into 2018, we see continued EPS growth—thanks, in part, to corporate tax cuts—but a huge downward re-rating (multiple contraction) across all stocks. On the back of stronger EPS growth, growth stocks again outperformed value, this year by +6.8%.
This begs the question, is the re-rating done, or just getting started? And with the one-time EPS bump from the tax cut in the past, will future EPS growth continue to impress, or are we headed for a recession?
Rather than guess at the future, or build a prediction based on idiosyncratic features of today’s market and economy, we prefer to track simple measures of current valuations and trends.
“Are Stocks a Good Buy?”
Intense price action and volatility make investors want to time the market. It shows up in the form of the questions “are stocks a good buy now,” or “should I get out?”
Of course, investors aren’t asking if they should get out of equities forever. They are asking if they should get out for now, sit out the drawdown, and come back in later—an almost impossible exercise. Our answer is “if you had a plan in place, stick to it; if you don’t, build one, and then stick to it.”
Market timing is difficult because even signals which do appear to have some relationship with long-term future returns have very noisy historical relationships with short-term returns. We can see this effect through the lens of Value and Momentum (trend), two factors that we view as important in understanding the way markets behave.
Value
- Working with our Research Partner “Jesse Livermore+,” we explored the current levels of four specific measures relative to history. We picked these four because they are straightforward, have long histories, and are fairly distinct from one another.
- The trailing-twelve-month (ttm) P/E ratio is probably the most popular and the most widely-used valuation measure among market participants. We measured it based on S&P's published operating earnings series.
- The CAPE, famously developed by Robert Shiller, is also well-known and widely-used. We calculated it using a total return methodology, and we again used operating earnings in the denominator.
- PRE, which stands for "Price to Retained Earnings", is a measure proposed by Jesse that will be the subject of a future paper. It compares the market's price to the sum total of its retained earnings over its history, adjusting all numbers for inflation. It's like the standard price-to-book ratio, but it avoids the turnover and measurement problems associated with aggregating the book values of an evolving index of companies over time. It has a higher correlation with future returns than the CAPE, in part because it offers a cleaner, more complete quantification of the market's value.
- Finally, the average investor equity allocation is a metric that was developed by Jesse several years ago. It compares the total supply of corporate equity in the economy to the total supply of all financial assets, including cash and bonds (explained here). Simply put, higher allocations to equities have historically been associated with weaker future equity returns, and vice versa.
The table below shows those measures as of January 2019i:
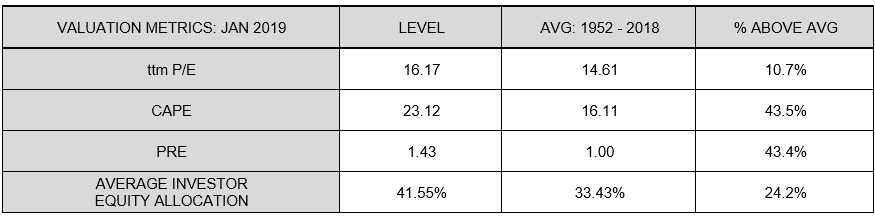
As the table confirms, most measures other than the simple ttm P/E ratio show the market as being expensive relative to its history. But the critical question is whether (and to what degree) these valuation measures matter to investors making capital allocation decisions today in January 2019. Again, investors are usually interested in avoiding short term drawdowns and timing the market. Rarely are they making true asset allocation changes meant to be held over the very long term (10+ years). This is an important distinction, because the above valuation measures are useless over the short term.
Below we chart the relationship (measured by coefficients of determination (R2) between each pure valuation measure and forward returns ranging from 1 year to 30 years. You can see that there has been a somewhat strong relationship between valuation and forward 10-20 year returns. But that there's also been very little relationship between current valuations and forward 1-3 year returns.
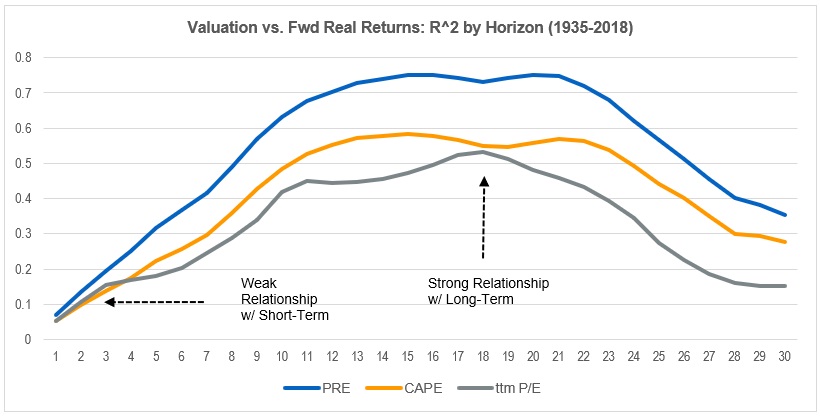
The most cited valuation metric (the current P/E ratio) has had the lowest statistical relationship with future returns. With an R2 of less than 0.1 for forward one-year returns, you can and should confidently ignore anyone using that metric (or any valuation metric) to inform their predictions about stock market returns over the next year.
We’ve enjoyed excellent returns in the U.S. equity market since the market bottom in 2009. Current valuations suggest (but certainly do not ensure) that the next ten years are unlikely to be as rewarding. But that possibility must be weighed against the reality that returns in other asset classes--in particular, bonds and cash--are also expected to be very low relative to history.
It should also be noted that within the market, valuation dispersion (spreads) have widened significantly in the past quarter. The below chart shows the historical spread between expensive and cheap stocks on a variety of valuation measures. Expensive stocks are more expensive relative to cheap stocks than they have been in years.
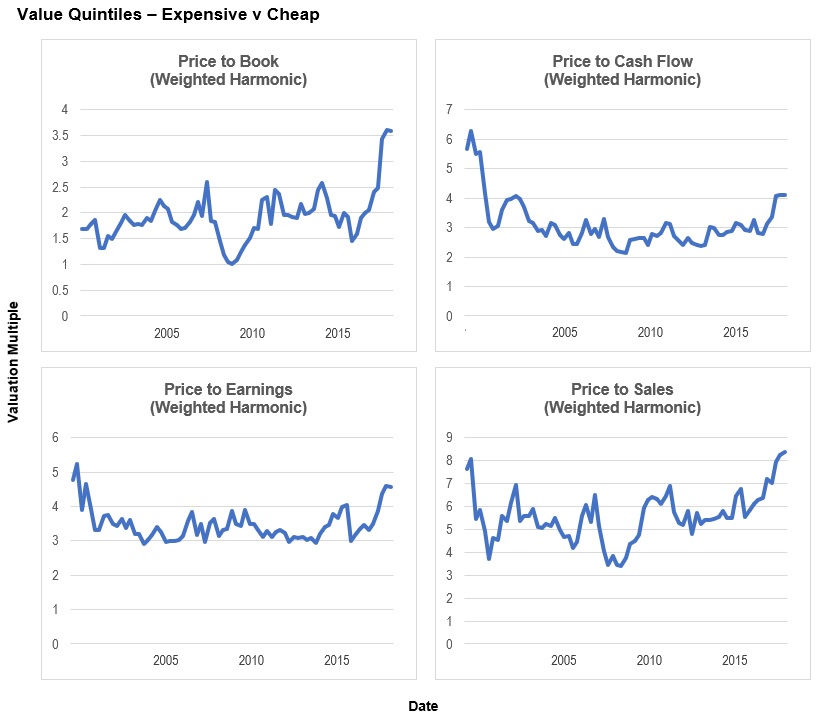
These spreads can widen further (which would be bad for value stocks), but may also represent an opportunity to allocate to cheaper securities within the U.S. equity market, thereby (hopefully) improving prospective returns.
To sum up: the market is much cheaper than it was three months ago, and value spreads have widened, meaning more stocks are quite statistically cheap. But the overall market remains expensive relative to history, and none of this valuation data is useful for short-term timing.
Trend
Trend strategies have historically offered downside protection for equity investors. By selling the market when it is underperforming T-bills over various trailing periods, and buying back into it when it is outperforming, investors would have avoided big chunks of the largest historical bear markets. Because they mute volatility, several trend strategies would have delivered a higher Sharpe ratio than the overall market. The below table shows the basic results for four trend strategies versus the S&P 500 (SPX). The strategy has two simple rules. When the trailing return (12-, 9-, 6-, or 3- month) of the S&P 500 is worse than the return of T-bills, the strategy sells the S&P and moves to T-bills. When the trailing return crosses back above that of T-bills, the strategy sells T-bills and buys back into the S&P 500. As you can see, several of the strategies have delivered higher Sharpe ratios and provided downside protection relative to the S&P 500 itself.

But the “payment” for this plunge protection comes in the form of many false starts in between large bear markets, where the trend system forces you to sell and then rebuy at a higher price, causing you to miss out on market returns while sitting in cash. These false starts are, effectively, insurance premiums. Trend strategies also carry with them significant tracking error relative to the market, which can make them very difficult to stick with.
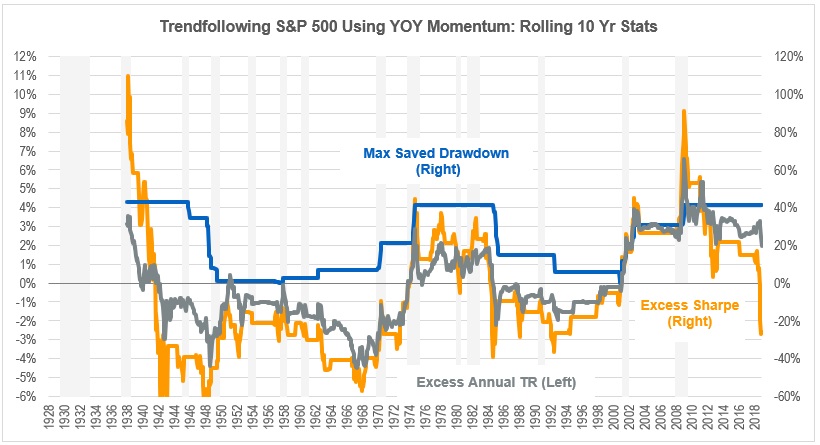
The chart below shows the results of a simple 12-month momentum timing strategy relative to a buy and hold investment in the S&P 500 on a rolling ten-year basis. You’ll notice that the “saved drawdowns” (shown in yellow) can be large—but there have only been a few of them (during the Great Depression, the 1970’s, the TMT crash in 2000, and the global financial crisis in 2008). Outside of those periods, the system imposed a large drag on simple buy and hold returns.
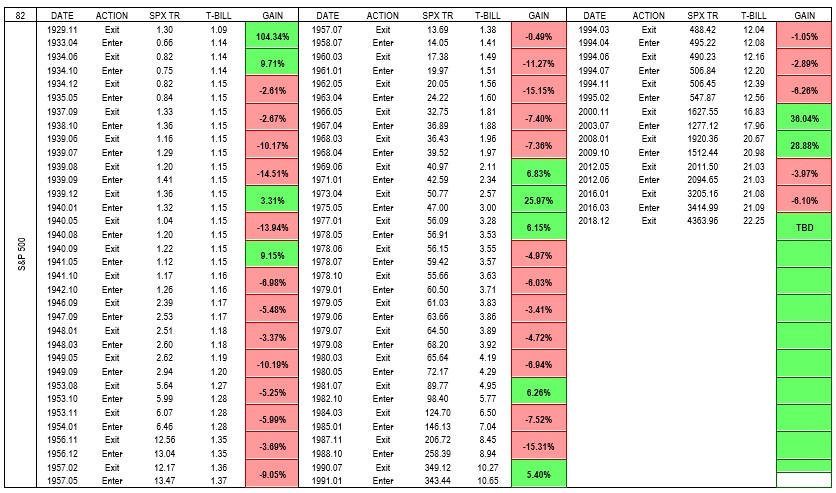
We can see this drag in the table below, which shows every trade in the timing strategy's history back to the 1920s. Most of the trades (those shown in red) lead to losses relative to the S&P 500. But in exchange for those losses, investors were protected from the market's biggest drawdowns. After the drawdowns were over, the strategy was able to get back into the market at lower prices, earning large relative gains (shown in green).
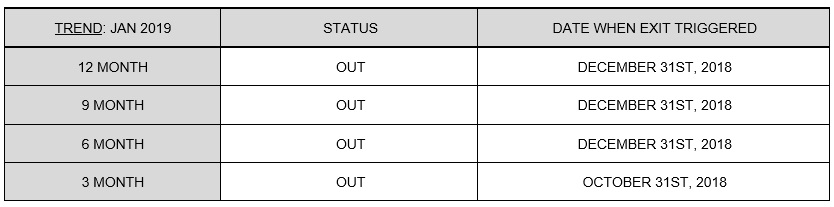
Today, we sit below the major trend lines on all four versions of the momentum timing strategy shown above. The 6, 9, and 12-month strategies exited at the end of December, while the 3-month strategy exited at the end of October:
Like the valuation measures, current trend indicators are urging caution. But again, the question is how are these indicators useful to investors? If trend systems are to offer greater risk-adjusted returns in the future, it will likely only be over the very long term. That means buying into it as a strategy for some portion of your investments and sticking with that strategy in the decades to come—no small task.
To reiterate, investors with a pre-existing plan or asset allocation can safely ignore these data. Value and trend signals are not meant to be dusted off only when things feel turbulent and scary. They can be a part of a long-term plan, but should be so consistently in good times and in bad.
We are tempering our own expectations for equity returns in the next decade, and focusing on how we can add value on top of market returns. That brings us to factor returns during 2018.
2018 Factor Performance
In general, our factors and strategies did well in the first three quarters of the year, but performed very poorly during the fourth quarter.
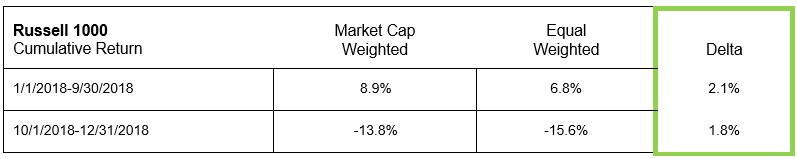
The only consistent factor was size: bigger companies (especially mega-cap companies with a market cap >$100 Billion) outperformed small ones in both regimes. One way to think of size’s impact is to calculate the spread in performance between stocks on a cap-weighted versus equal-weighted basis. We do this below for the Russell 1000. In both regimes, larger stocks outperformed by about 2%.
This is actually quite confusing because it would lead one to believe that a similar group of stocks led the market in both risk on and risk off regimes. But diving into the performance of the Russell Value and Growth indices, we see that clearly was not the case.
For the first three quarters of the year, investors sought large growth-oriented firms in the risk-on environment. The Russell Growth index trounced its value counterpart by a whopping 11.8% during the first three quarters. But even within the growth index, cap-weighted beat equal weighted by 6% (whereas in the Russell 1000 Value, cap- and equal-weighted delivered similar performance).
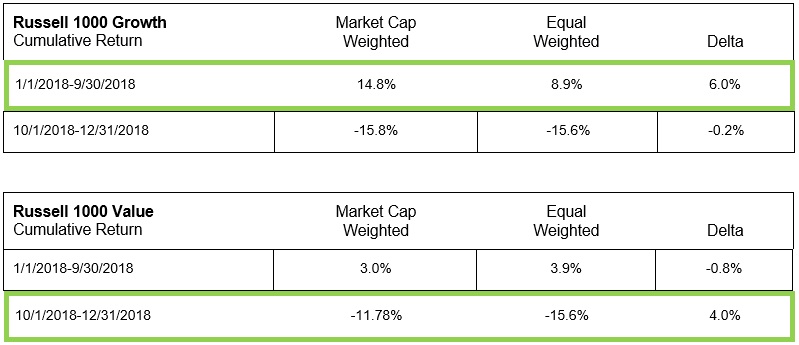
This trend inverted in the fourth quarter, when value lead growth, but now cap-weighting within value dominated equal-weighting. Notice that for the fourth quarter, the returns for the equal-weighted versions of the Russell 1000 Value and the Russell 1000 Growth were the same: -15.6%.
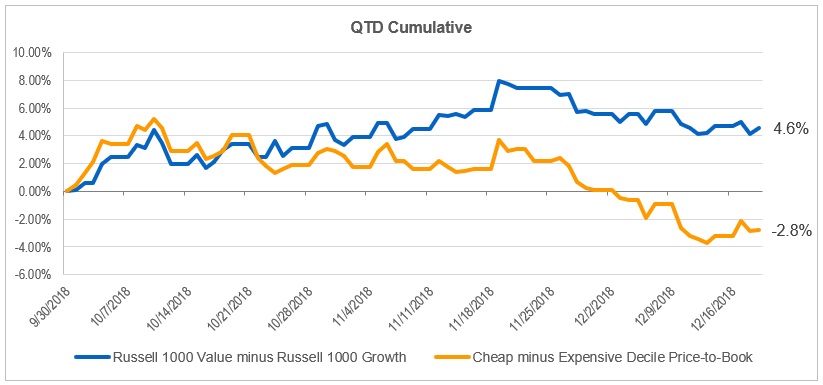
Below is the spread in the fourth quarter between the Russell Value and Growth indexes and cheap vs expensive Price-to-Book. Value did beat growth by 4.6%, so it appears value has come back into favor. But, the second line on this chart is the spread between cheap and expensive stocks by Price-to-Book—the primary factor used in Russell’s index formation. It has inverted. This suggests that value’s emergence (from a relative perspective) has been driven by a preference for large defensive stocks, not the traditional value factor.
This posed a serious challenge for value-oriented managers. Active managers get paid to deviate from market cap weightings. That was a decidedly challenging endeavor this year. Below are the cumulative excess returns for our preferred factors (and Price-to-Book) relative to the Russell 1000 Value Index for each regime (the cumulative excess returns reset to 0% at 9/30/2018).
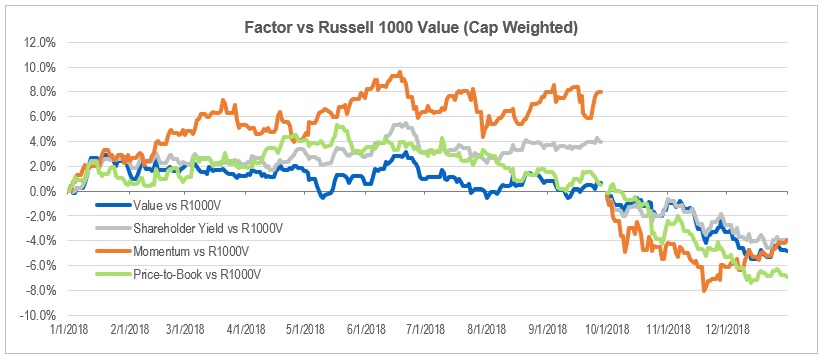
The odd thing about the fourth quarter is that what had worked previously ceased to work—unless the final portfolio was market cap-weighted.
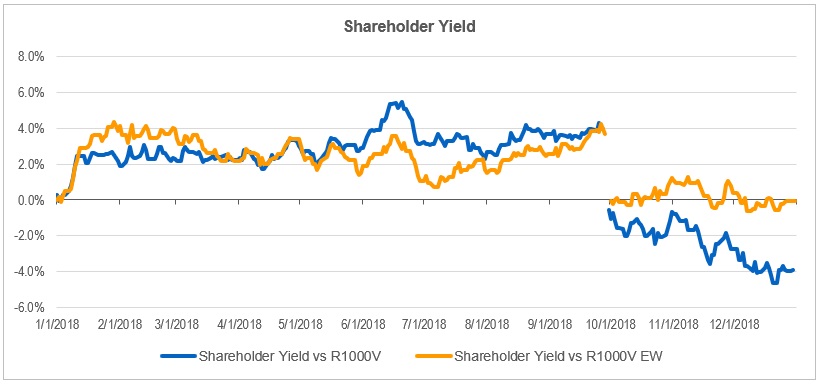
Shareholder Yield is one of the most effective selection factors we have found in the large cap space, domestically and abroad. It includes a stock’s dividend yield and share buybacks over the previous twelve months. Though aligned with value, it tends to provide a differentiated return profile and unique underlying holdings. For the first three quarters of the year, it outperformed the index by about 4.0%, much better than our value theme and price-to-book. In the fourth quarter it struggled in line with other factors. If, however, we consider its performance versus an equal-weighted Russell 1000 Value, the underperformance disappears.
Mega cap (>$100 billion market cap) value stocks outperformed the rest of the Russell 1000 Value index by 5.6%. While the benchmark had a 41% weight to mega cap names, the factor had less than a 20% weight to mega cap.
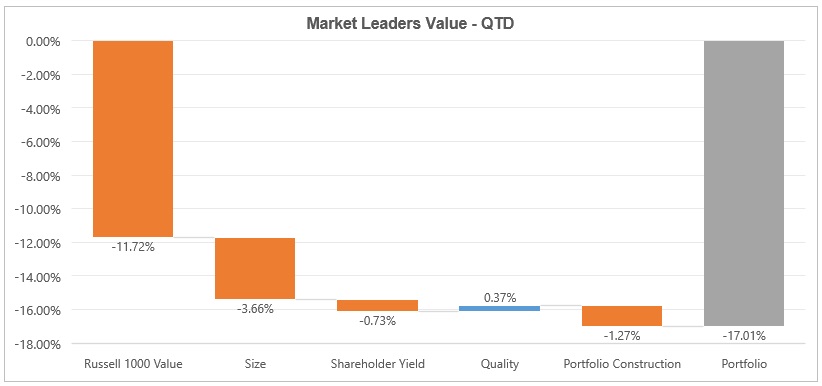
Using our Market Leaders Value strategy as an example, you can see that the elements of the portfolio which normally drive our performance—quality, factors, and portfolio construction—were overwhelmed by the negative impact of the size factor on our returns. Size ruled everything in 2018. We are continuing to explore exactly why, and will share anything interesting that we find.
Underperformance is always painful. We’ve studied the factors used in our models to their depths, and one of the most common findings is that timing factors—in an attempt to avoid periods of underperformance like this year’s fourth quarter—is either impossible or extremely difficult.
All of our factors show the same trend of improving win rates over longer holding periods. Given the long-term success of the factors, it’s helpful and sometimes even surprising to see how often they underperform in the shorter term. Take Shareholder Yield, for example. The below table shows the percent of all historical periods that the factor was underperforming a simple cap-weighted market (top row) and the percent of all periods that the factor was severely underperforming (defined as -5% or worse, annualized).
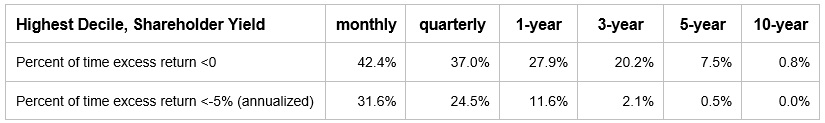
One in every four quarters is painful, and there are plenty of 3- and 5-year periods where the factor has lagged. But the overwhelming evidence over the longer periods is toward the factor’s outperformance. These numbers look very similar for other factors like Value and Momentum.
That the factors usually do well over longer periods doesn’t alleviate the fact that they often do poorly in the shorter term and can be hard to predict. So, we can’t sit around and stay satisfied with current models. We are always trying to improve our factors, portfolio construction, and screening methodologies to improve the rates in the table above—and historically, we have. We’ve written recently about the importance of Alpha Within Factors, and that continues to be our research focus going into 2019.
Stepping back from a single year of performance, I’d like to close this year’s letter with a longer horizon in mind. The most common question I fielded this year was about OSAM’s plans for the future. I’ve thought a lot about that question, and close with a short summary of where we are headed.
OSAM’s Long Term Plans
We are obsessed with markets, business, and investing, and with how investors deploy capital and earn returns. As we grow, this core curiosity will guide us. In every market—be it a single economic sector or entire asset class—we want to know which variables relate to future returns and which do not. This research exercise is focused on data and real-world evidence, not on theories, forecasts, or narratives. Often, a small number of factors dominate. Our history as a firm has been about finding those factors, refining them, and using them to build investable strategies.
In one sense, our vision for the future is simple: to use this same research process to expand the ways and places in which we can offer something unique and valuable to investors, be that in existing models, new or different equity verticals, or in other asset classes.
Soon, we will offer more customizable versions of our models, tailored to individual clients and to their needs and preferences. We will continue to extend our research into all areas of the equity markets.
After devoting significant research time to international data sets in recent years, we anticipate more international offerings soon. We will (patiently, and over time) be open to applying our quantitative mindset to non-equity and non-public asset classes. We will also continue to embrace technology and share our research (via papers, podcasts, and other media) to make this experience as enjoyable as possible for investors.
How We Will Do It
To make this happen, we must grow what OSAM can do (our productive capacity as a firm) and continue to improve what we choose to do with our resources (our actual output). We need to be the best at gathering data, using that data to find the most important factors, and then turning those findings into investable strategies.
I’ve written before about OSAM’s concept of “learn, build, share, repeat” and about my belief in “growth without goals.” These are business and personal versions of the same philosophy: growth or progress which is structured and habitual, but adaptable and not pre-determined through the setting of rigid long-term goals.
I can’t tell you what OSAM will look like in five years, but I do know we will be better in at least 9 ways every year.
3x3
Within the firm, we have three intertwined platforms: research & portfolio management, investor education, and investor relationships. Each of these three platforms has three component parts: people, technology, and data. Every year, we want our raw ability to produce to grow. Every year, we are going to put improvement check marks in the nine boxes on this grid. This structured but flexible repetition will produce a growing and unique set of capabilities.
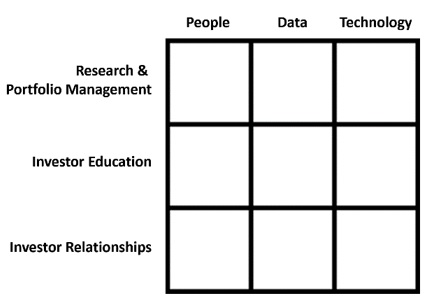
For those interested in the nitty gritty details of 2018 in our 3x3 matrix, we list examples from 2018 at the end of this letter.
Expanding Our Relationship with Investors
We want OSAM to be the hub that you turn to for more and more of your needs, both to learn and to invest. We want to be the steward of a larger and larger percentage of our clients’ portfolios and to represent a default and long-term choice for investors. This is only possible with deep trust, which is why we work so hard to share our research and spend time with our current and prospective investors.
There are a number of ways you can join us. You can invest with us. You can sign up here to follow our work. You can subscribe/listen to my podcast, which is my way of exploring new asset classes and investment strategies. You can work with us.
Asset management is filled with many brilliant, high quality, competitive people. We know that to deliver, we need to be relentless—and we will be. All of us at OSAM look forward to spending 2019 learning and investing with you.
Cheers,
Patrick O’Shaughnessy
Platform Improvement Highlights, 2018
Data1
In 2018 we added these data sets:
- Firm ownership—who owns each stock through history. An extremely messy exercise.
- Impact investing data (often called ESG or SRI)—we believe that standalone ESG products may not ever take off (because they tend to be one-size-fits all, or narrowly focused), but that the ability to express specific, granular views in a portfolio with little to no “cost” (in the form of lost return) may be powerful. The data is quite deep, but messy and full of biases.
- Better bank + REIT specific data globally
- Patent data—we are working in partnership with two new Research Partners to understand the impact that patents have on forward outcomes.
- Management Discussion and Analysis, 8-Ks—we created custom factors using text analysis.
- We began an opt-in email list to share the best investing research we come across on a monthly basis. For the ~5,000 people to opt into that list, we gather feedback on their interests (e.g. public equities, venture capital, etc.) so we can focus on the right topics.
Technology
In 2018, we built:
- Our portfolio X-Ray tool—which runs analytics on blended portfolios—became an integral part of conversations that we have with investors. Using data on all other mutual funds, indexes, ETFs, and separate account strategies, we can provide a streamlined report on how we perform in an allocation (good or bad) when paired with other options. We ran more than 1,500 unique reports based on external requests using this piece of technology, which we think of as our version of Blackrock’s Aladdin.
- Real Cost Testing--We rebuilt our entire back testing engine from scratch so that we could layer in costs in the most precise way possible. This impacts our rebalance frequency and portfolio construction for different factors. We can now model after tax and after trading friction results in a way that is as accurate as we think is possible. We rebuilt the current tax code in our system, meaning taxes are tracked to the cent. We recalibrated our trading costs estimates (market impact, commissions) which are now reflective our traders’ actual skill level rather than simple third-party cost estimates (we tend to handily beat estimates).
- Data Science tools—we’ve significantly expanded our ability to implement cutting-edge analytical tools (e.g. “machine learning”) on our research platform.
- Revamped research and portfolio management platform—an upgrade which allows for far faster and easier integration of new data sets (again mostly to save the time of our team to work on more value-added projects). The structure and cleanliness of the data sets is of increasing importance to us as we use more sophisticated tools for finding and understanding patterns in the data.
- We built a new website.
- Communication and tracking systems—this may seem trivial, but the integration of Slack and Asana for internally messaging and tracking of projects has been a huge upgrade, firmwide.
People
People are always the most important. They are the soul in the machine, without whom we just have a worthless hunk of metal, code, and data. It is not just who we have on our team, and how we promote their growth, but also who we surround ourselves with. I think this is a massively underutilized (and extremely cost effective) area of focus in the asset management industry. We’ve learned from experience that the return on collaboration and openness is very high.
In 2018:
- We created the OSAM Research Partners program and have 5 active members, including “Jesse Livermore+” and Kevin Zatloukal.
- We added Danny Nitiutomo and Greg Stepaniouk as full-time members of the research team, added Jeff Gebauer to our technology team, and added Andy Iles to our client team.
- We have private discussion groups with top experts in areas like machine learning (from fields other than our own, so we can all share challenges and learn together).
- We’ve made very select investments in and/or with two other asset managers: Deep Basin Capital (an energy-focused hedge fund with deep quantitative processes) and Adventur.es (a lower market private equity fund re-writing how things are done in that world). Every time we meet with these firms, we are reminded of the quality and intelligence that we ourselves must strive for.
Footnotes
i The numbers were generated from Robert Shiller's spreadsheet and from the Federal Reserve Economic Data (FRED) website. To avoid distortions associated with accounting changes implemented in the early 2000s, we substituted S&P's published operating earnings series in place of GAAP earnings from 1988 onward.
1 Raw information, data, is the base layer of our process. We want good, long, clean data sets to learn from. Financial statement and pricing data are commonplace in the quant world. We spent years cleaning the U.S. and International data sets, and they remain a primary information set. We also like data sets that are hard to cobble together and clean and data sets we can build ourselves.
General Legal Disclosures & Hypothetical and/or Backtested Results Disclaimer
The material contained herein is intended as a general market commentary. Opinions expressed herein are solely those of O’Shaughnessy Asset Management, LLC and may differ from those of your broker or investment firm.
Please remember that past performance may not be indicative of future results. Different types of investments involve varying degrees of risk, and there can be no assurance that the future performance of any specific investment, investment strategy, or product (including the investments and/or investment strategies recommended or undertaken by O’Shaughnessy Asset Management, LLC), or any non-investment related content, made reference to directly or indirectly in this piece will be profitable, equal any corresponding indicated historical performance level(s), be suitable for your portfolio or individual situation, or prove successful. Due to various factors, including changing market conditions and/or applicable laws, the content may no longer be reflective of current opinions or positions. Moreover, you should not assume that any discussion or information contained in this piece serves as the receipt of, or as a substitute for, personalized investment advice from O’Shaughnessy Asset Management, LLC. Any individual account performance information reflects the reinvestment of dividends (to the extent applicable), and is net of applicable transaction fees, O’Shaughnessy Asset Management, LLC’s investment management fee (if debited directly from the account), and any other related account expenses. Account information has been compiled solely by O’Shaughnessy Asset Management, LLC, has not been independently verified, and does not reflect the impact of taxes on non-qualified accounts. In preparing this report, O’Shaughnessy Asset Management, LLC has relied upon information provided by the account custodian. Please defer to formal tax documents received from the account custodian for cost basis and tax reporting purposes. Please remember to contact O’Shaughnessy Asset Management, LLC, in writing, if there are any changes in your personal/financial situation or investment objectives for the purpose of reviewing/evaluating/revising our previous recommendations and/or services, or if you want to impose, add, or modify any reasonable restrictions to our investment advisory services. Please Note: Unless you advise, in writing, to the contrary, we will assume that there are no restrictions on our services, other than to manage the account in accordance with your designated investment objective. Please Also Note: Please compare this statement with account statements received from the account custodian. The account custodian does not verify the accuracy of the advisory fee calculation. Please advise us if you have not been receiving monthly statements from the account custodian. Historical performance results for investment indices and/or categories have been provided for general comparison purposes only, and generally do not reflect the deduction of transaction and/or custodial charges, the deduction of an investment management fee, nor the impact of taxes, the incurrence of which would have the effect of decreasing historical performance results. It should not be assumed that your account holdings correspond directly to any comparative indices. To the extent that a reader has any questions regarding the applicability of any specific issue discussed above to his/her individual situation, he/she is encouraged to consult with the professional advisor of his/her choosing. O’Shaughnessy Asset Management, LLC is neither a law firm nor a certified public accounting firm and no portion of the newsletter content should be construed as legal or accounting advice. A copy of the O’Shaughnessy Asset Management, LLC’s current written disclosure statement discussing our advisory services and fees is available upon request.
Hypothetical performance results shown on the preceding pages are backtested and do not represent the performance of any account managed by OSAM, but were achieved by means of the retroactive application of each of the previously referenced models, certain aspects of which may have been designed with the benefit of hindsight.
The hypothetical backtested performance does not represent the results of actual trading using client assets nor decision-making during the period and does not and is not intended to indicate the past performance or future performance of any account or investment strategy managed by OSAM. If actual accounts had been managed throughout the period, ongoing research might have resulted in changes to the strategy which might have altered returns. The performance of any account or investment strategy managed by OSAM will differ from the hypothetical backtested performance results for each factor shown herein for a number of reasons, including without limitation the following:
▪ Although OSAM may consider from time to time one or more of the factors noted herein in managing any account, it may not consider all or any of such factors. OSAM may (and will) from time to time consider factors in addition to those noted herein in managing any account.
▪ OSAM may rebalance an account more frequently or less frequently than annually and at times other than presented herein.
▪ OSAM may from time to time manage an account by using non-quantitative, subjective investment management methodologies in conjunction with the application of factors.
▪ The hypothetical backtested performance results assume full investment, whereas an account managed by OSAM may have a positive cash position upon rebalance. Had the hypothetical backtested performance results included a positive cash position, the results would have been different and generally would have been lower.
▪ The hypothetical backtested performance results for each factor do not reflect any transaction costs of buying and selling securities, investment management fees (including without limitation management fees and performance fees), custody and other costs, or taxes – all of which would be incurred by an investor in any account managed by OSAM. If such costs and fees were reflected, the hypothetical backtested performance results would be lower.
▪ The hypothetical performance does not reflect the reinvestment of dividends and distributions therefrom, interest, capital gains and withholding taxes.
▪ Accounts managed by OSAM are subject to additions and redemptions of assets under management, which may positively or negatively affect performance depending generally upon the timing of such events in relation to the market’s direction.
▪ Simulated returns may be dependent on the market and economic conditions that existed during the period. Future market or economic conditions can adversely affect the returns.
Composite Performance Summary
For the full composite performance summaries, please follow this link: http://www.osam.com


