Technology & Data Analysis: The Evolution of Risk Management (Pt. 2)
By Jamie Catherwood
December 2021
There are no guarantees in investing, but data and technology are effective remedies for reducing uncertainty. In fact, risk management could simply be described as the process for lessening the magnitude of uncertainty.
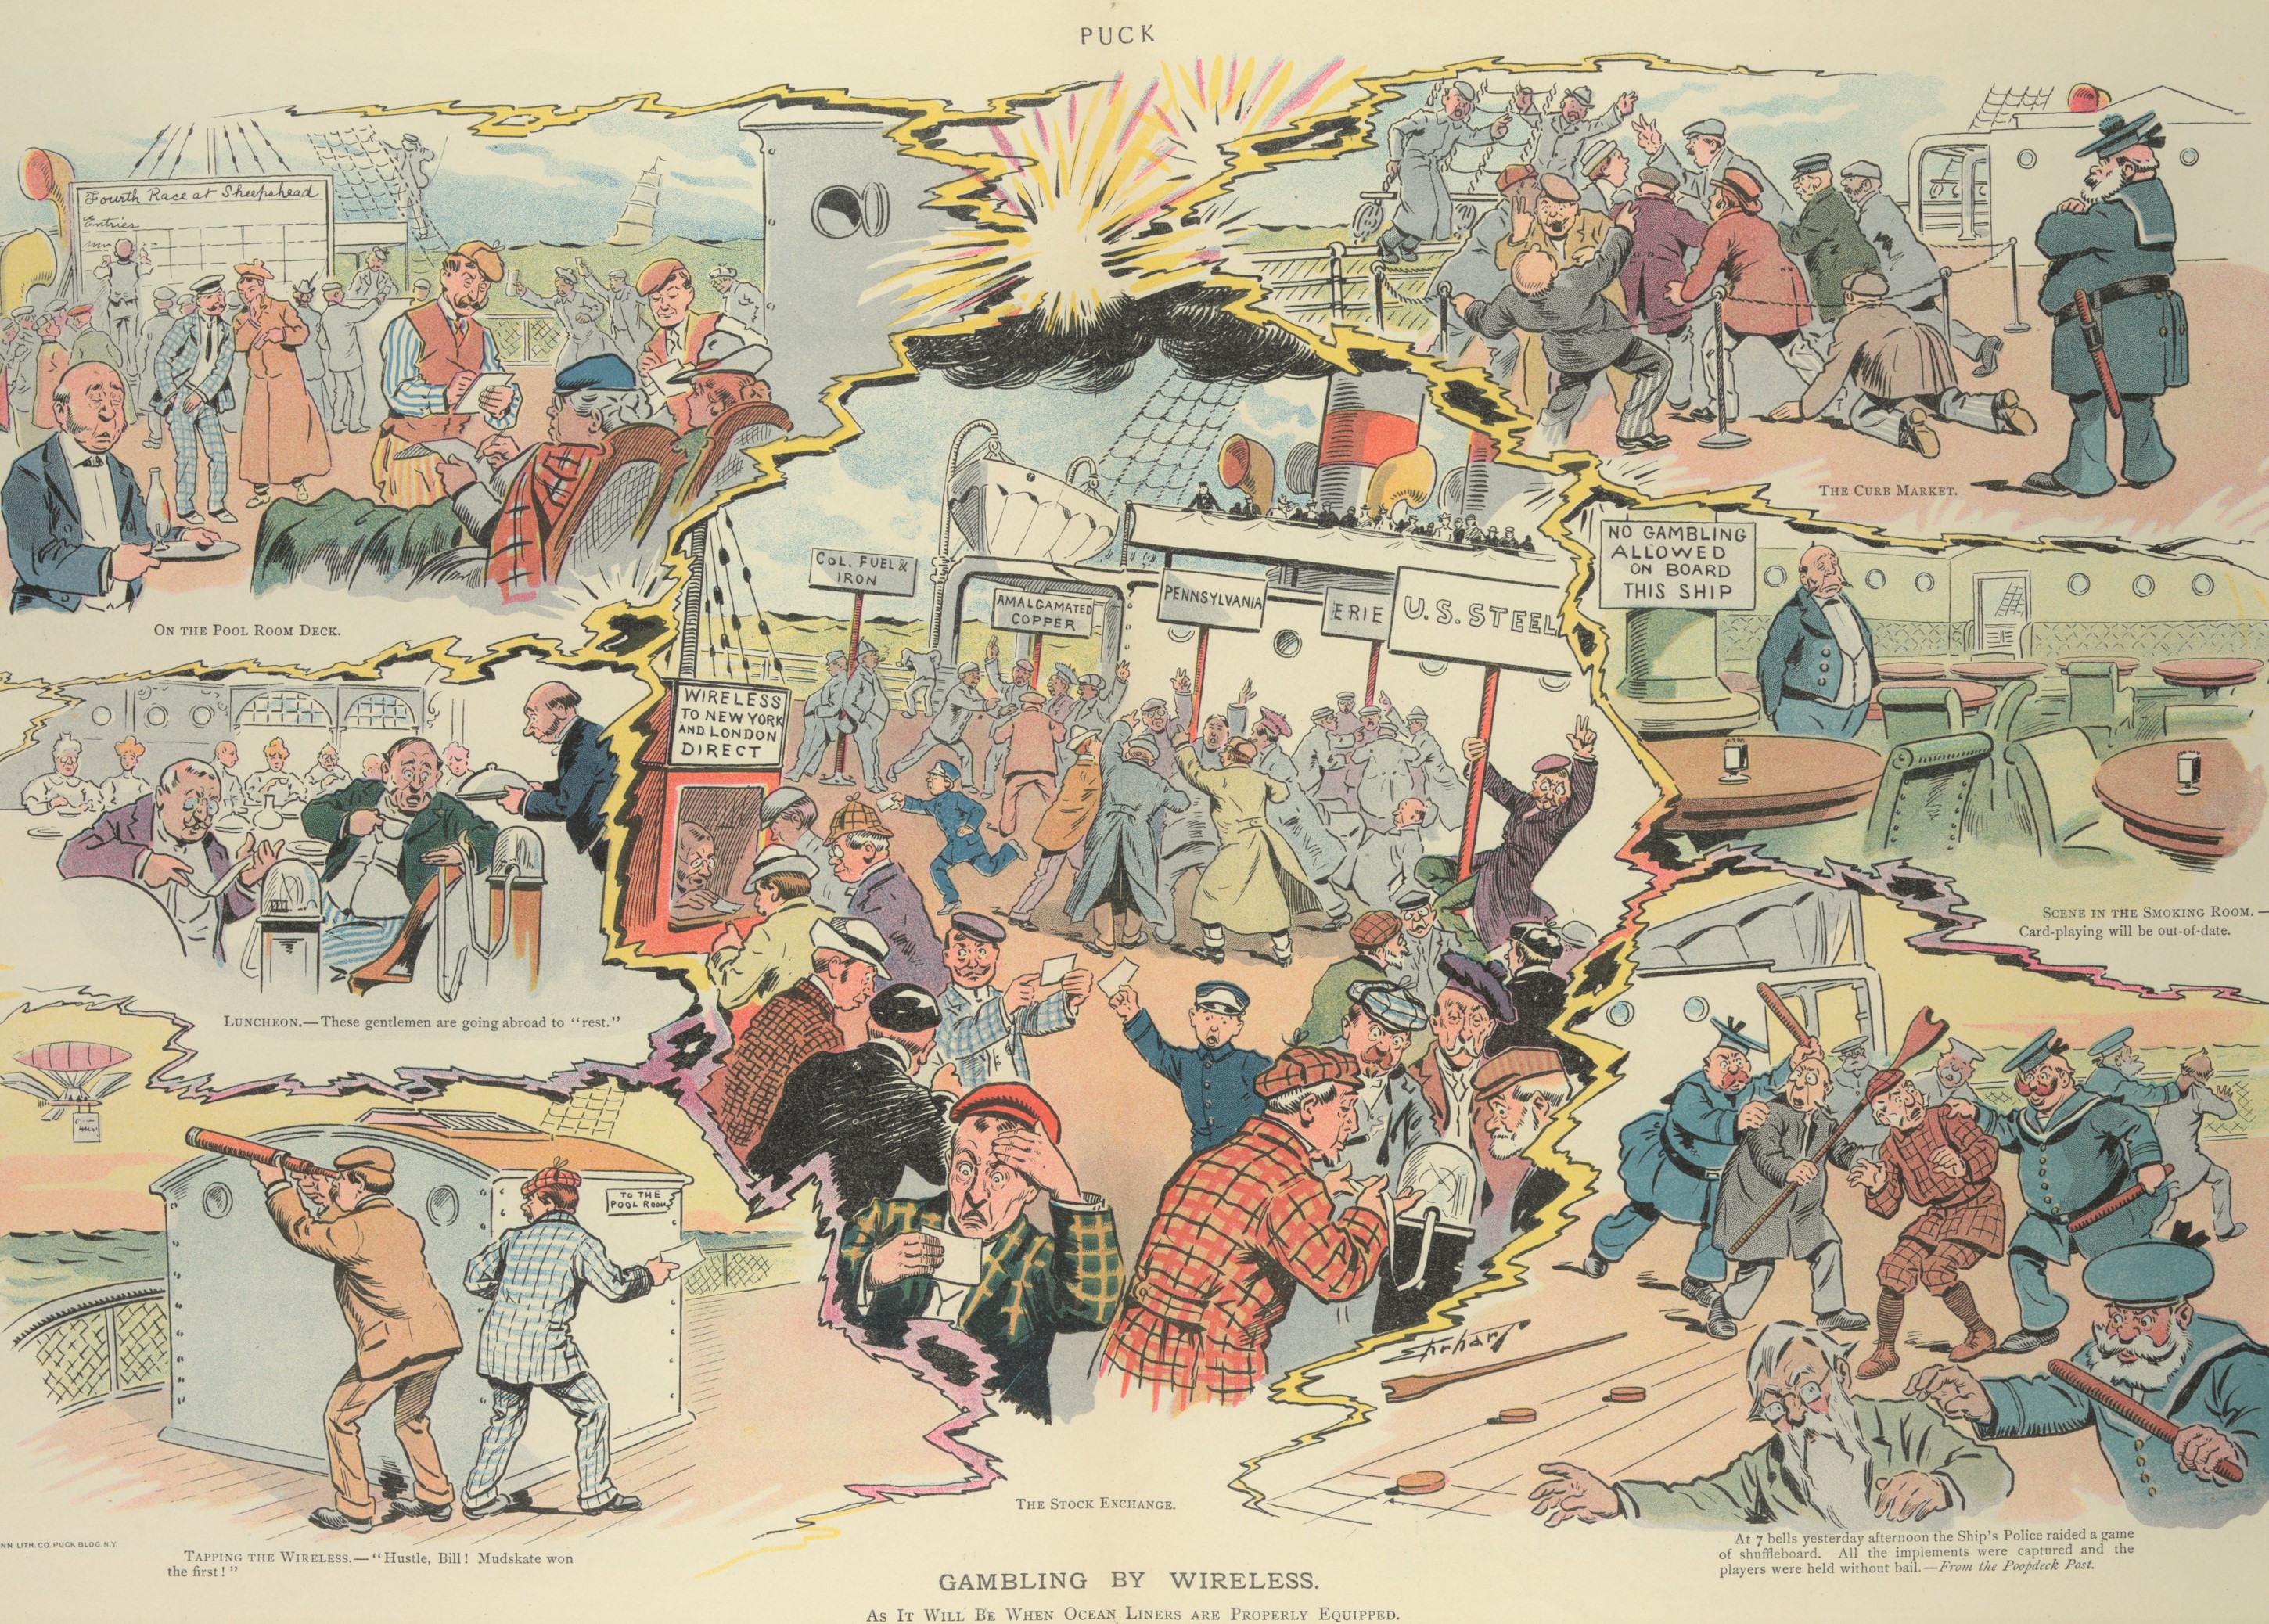
Imagine investing without access to company data. How many low-quality companies and outright frauds might one invest in? Investors in the 19th century operated in this paradigm before widespread adoption of the telegraph in the 1840s. An excerpt from 1874 illustrates the ubiquity of fraud before telegraphs:
“Before the invention of the telegraph, a house of straw could paint up its name, make a show with a few thousand pounds, and enter into very large commitments for good or for bad, as it might turn out.”1
Fairy Tale Investments
The tale of Gregor MacGregor and his mythical island of Poyais offers an extreme example. In the 1820s, as British investors “reached for yield” by buying risky, high-yielding Latin American debt, MacGregor floated bonds for the “country” of Poyais on London’s Stock Exchange.
MacGregor described Poyais as a country boasting opera houses, bountiful mines, fertile soil, and parliamentary buildings. Yet, the “country” of “Poyais” was entirely fictitious. The real island was an uninhabited jungle with no people or infrastructure to speak of, let alone an opera house.
Before telegraphs connected the globe and facilitated rapid communication, how would the average British investor know “Poyais” was fake, but “Peru” was real? This lack of information allowed MacGregor’s scheme to persist, eventually becoming a £3.6 billion fraud (by modern values) before it unraveled.2 Albeit an extreme example, Poyais underscores why information and data are critical for managing risk.
Managing Credit Risk: A History
While it was too late to stop MacGregor’s Poyais scam, the credit ratings industry was transformed by technology and data in the mid-19th century.
If one is in the business of lending, avoiding borrowers with a history of default is rule number one. However, this became increasingly difficult during the 19th century. In the early decades, American business was conducted locally, where merchants and businessmen knew each other well. Consequently, if a merchant wished to purchase from a businessman on credit, the businessman would rely on the merchant’s local reputation to judge his creditworthiness. Benjamin Franklin described this localized approach to judging credit risk:
“The sound of your hammer at five in the morning, or eight at night, heard by a creditor, makes him easy six months longer; but if he sees you at a billiard-table, or hears your voice at a tavern, when you should be at work, he sends for his money the next day; demands it, before he can receive it, in a lump.”
Railroads changed everything. As thousands of miles of track connected distant areas of America, business transactions evolved from the local to national level. Merchants began transacting with customers they had not met from towns they had never visited. Removing geographical burdens unlocked new business opportunities but also presented new problems: without local reputations and personal interactions to rely upon, how could merchants judge which customers were creditworthy?
The Mercantile Agency

Founded in 1841, Lewis Tappan’s Mercantile Agency solved this problem. An 1843 advertisement stated:
“This agency was established... for the purpose of procuring by resident and special agents, information respecting the standing, responsibility and character of country merchants.... whether persons applying for credit are worthy of the same and to what extent.”3
Like modern credit rating agencies, the Mercantile Agency gathered data on companies, assessed their creditworthiness and sold this information as a product. The company understood that data would become invaluable to investors and businessmen for managing risk. An example of Mercantile’s credit rating system is shown below:
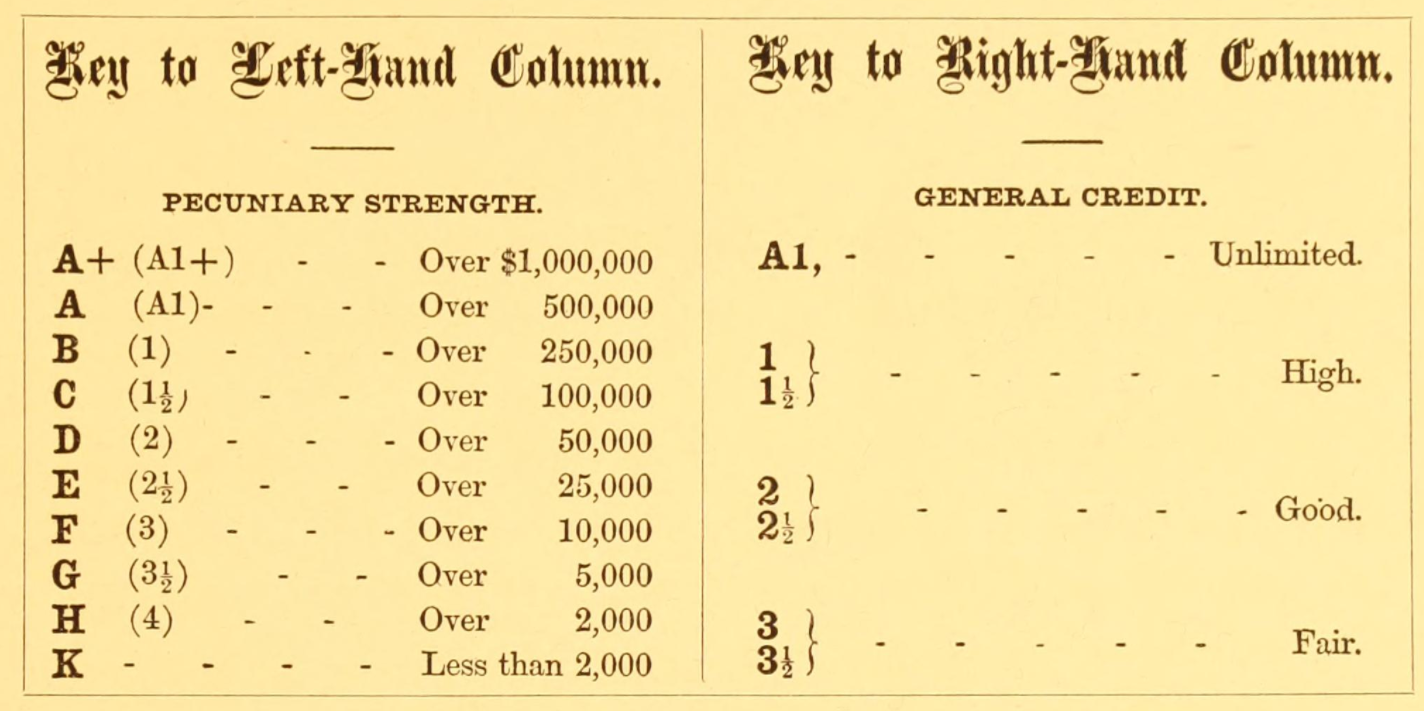
The Mercantile Agency accomplished this by organizing a network of local “agents” that compiled credit reports on companies in their territory. Agents submitted their reports to Mercantile’s New York headquarters, where they were codified and hand-copied into the master database (ledger books) before being redistributed to other Mercantile branches.4
Thus, a New York businessman could leverage Mercantile’s extensive database to determine the creditworthiness and counterparty risk of a merchant in Ohio.
However, hand-copying agents’ reports into New York’s ledger books was time consuming. This problem only worsened as Mercantile branches opened nationwide. New branches hand-copied New York’s master ledger upon opening, but keeping each branch synced with New York on an ongoing basis was an operational nightmare.
“Every time the Mercantile Agency opened a new branch, employees hand-copied a new set of ledgers for that branch corresponding to the existing master set. This presented a huge database replication problem: As new reports came in, how were the branch-office ledgers to be kept in sync with the master set in New York?
... updates were slow to reach the branch offices (and never did reach some of them). The increasing volume of reports meant that hand-copying swallowed up increasing amounts of time and money.”
Technology, Economies of Scale & Network Effects
The Mercantile Agency had copious data but lacked the technology for efficiently analyzing and disseminating it. This was problematic because it diminished the value of Mercantile’s database as information became outdated. Managing risk with outdated information is a fool’s errand. In 1874, however, a groundbreaking piece of technology solved everything: the mechanical typewriter.
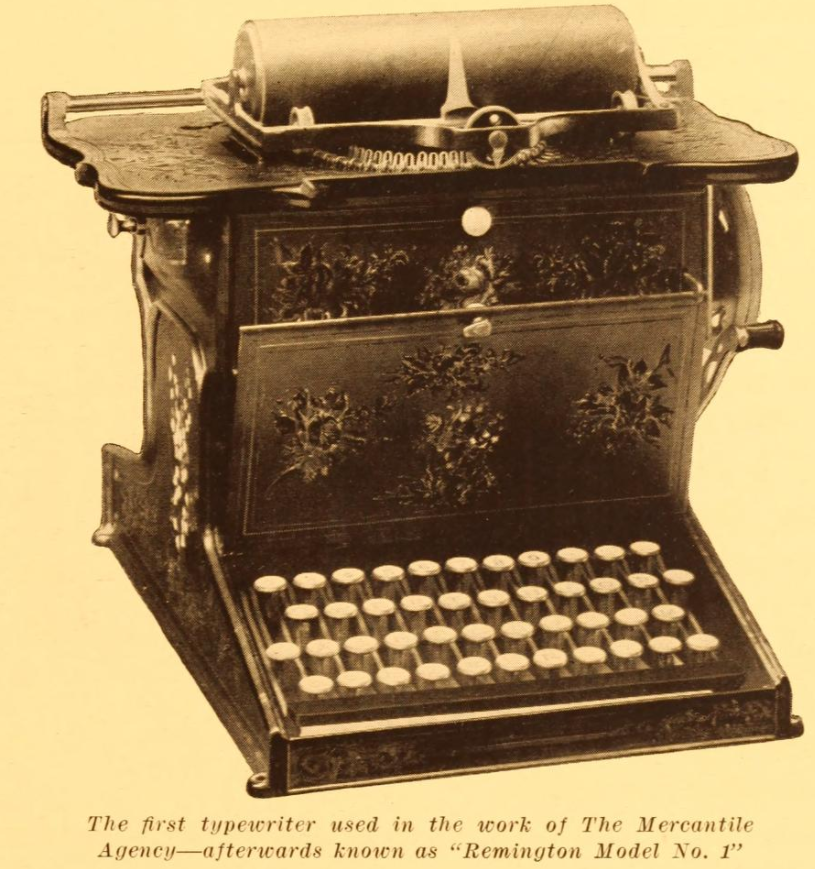
The thought of typewriters being innovative now seems ludicrous, but these ‘writing machines’ were once transformative. Using carbon-copy paper, the Mercantile Agency could type agents’ reports while simultaneously producing multiple copies.
Instead of one report being hand-copied ten times into ten different ledger books, one report could be typed once while producing multiple copies for different branches. Less work, greater and faster output due to synergies in data and technology.
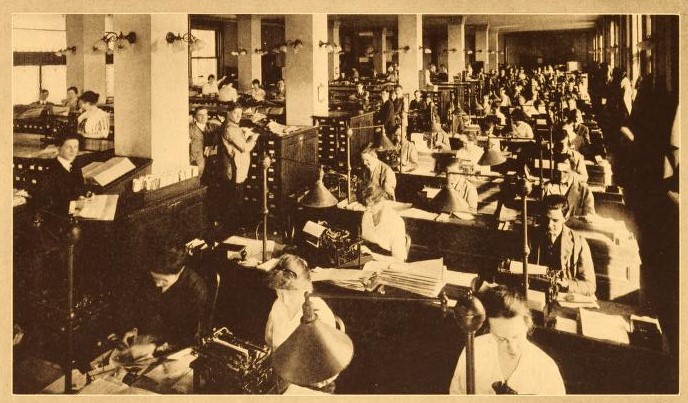
“[Mercantile Agency] ordered a trial immediately, and distributed typewriters to all branch offices in 1875. Its use in conjunction with carbon paper meant that the Agency could easily generate and distribute multiple copies of reports.
Carbon-paper duplicates were made using thin tissue paper; an originating office distributed these "tissue" updates simultaneously... they were pasted onto manila sheets organized by firm and filed by name and location. These typewritten reports soon became the core of the database, and their production required the agency, even more, to apply ‘the principles of mass production’."
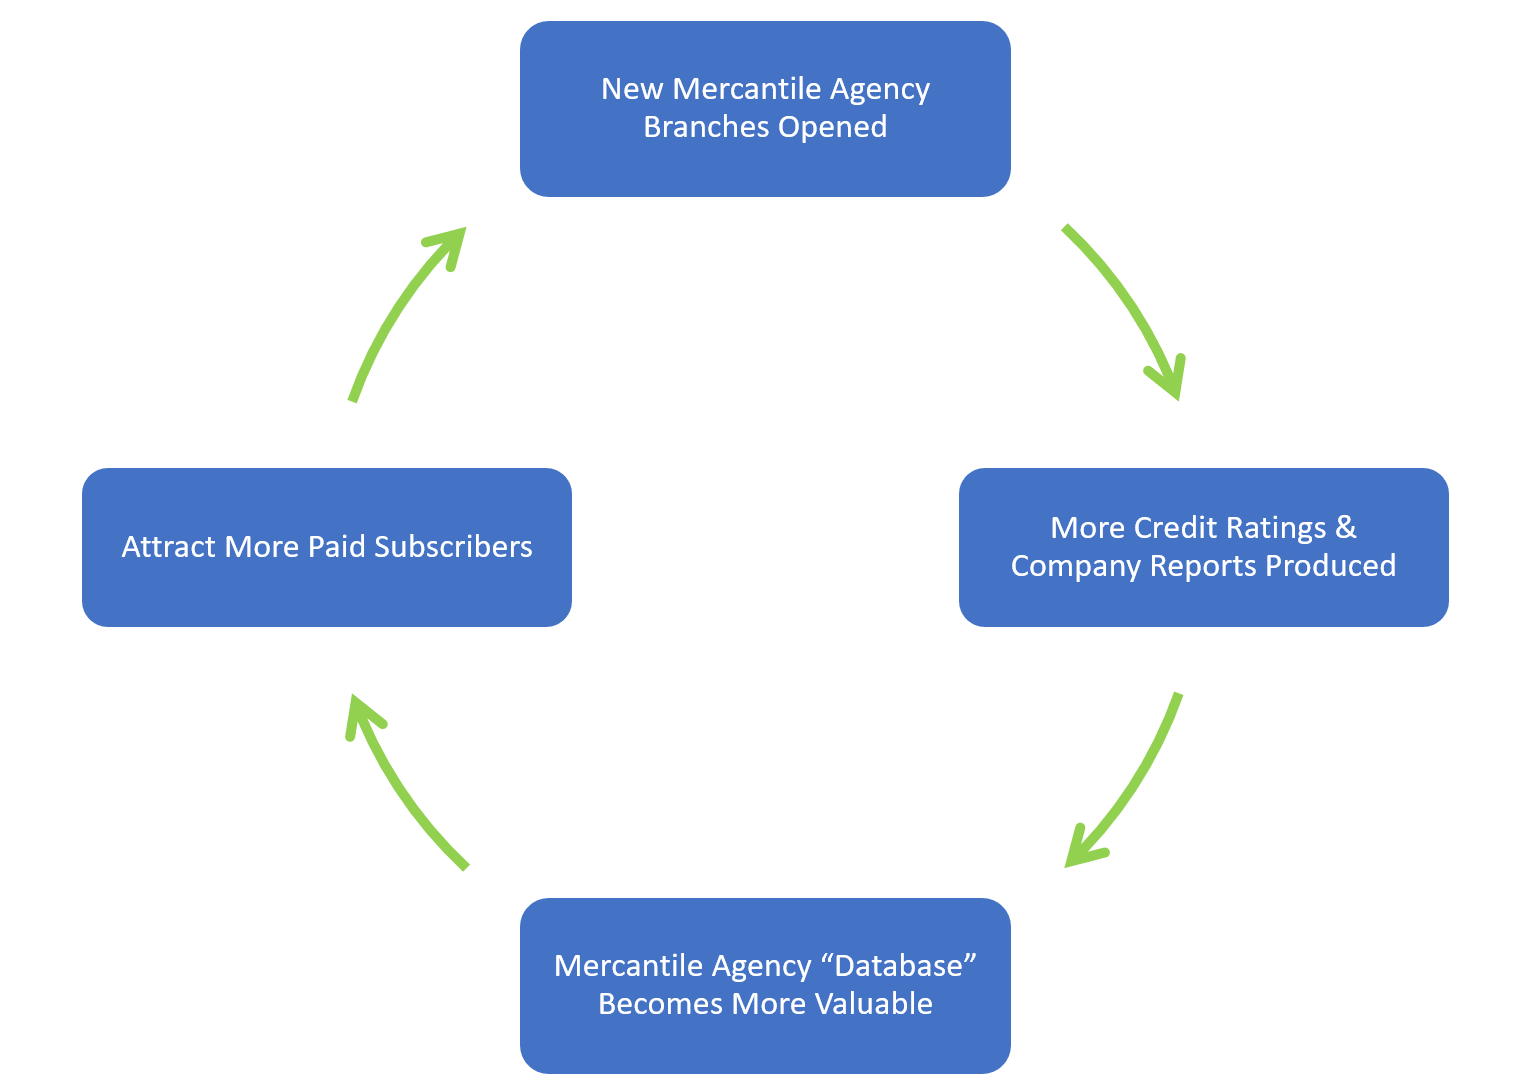
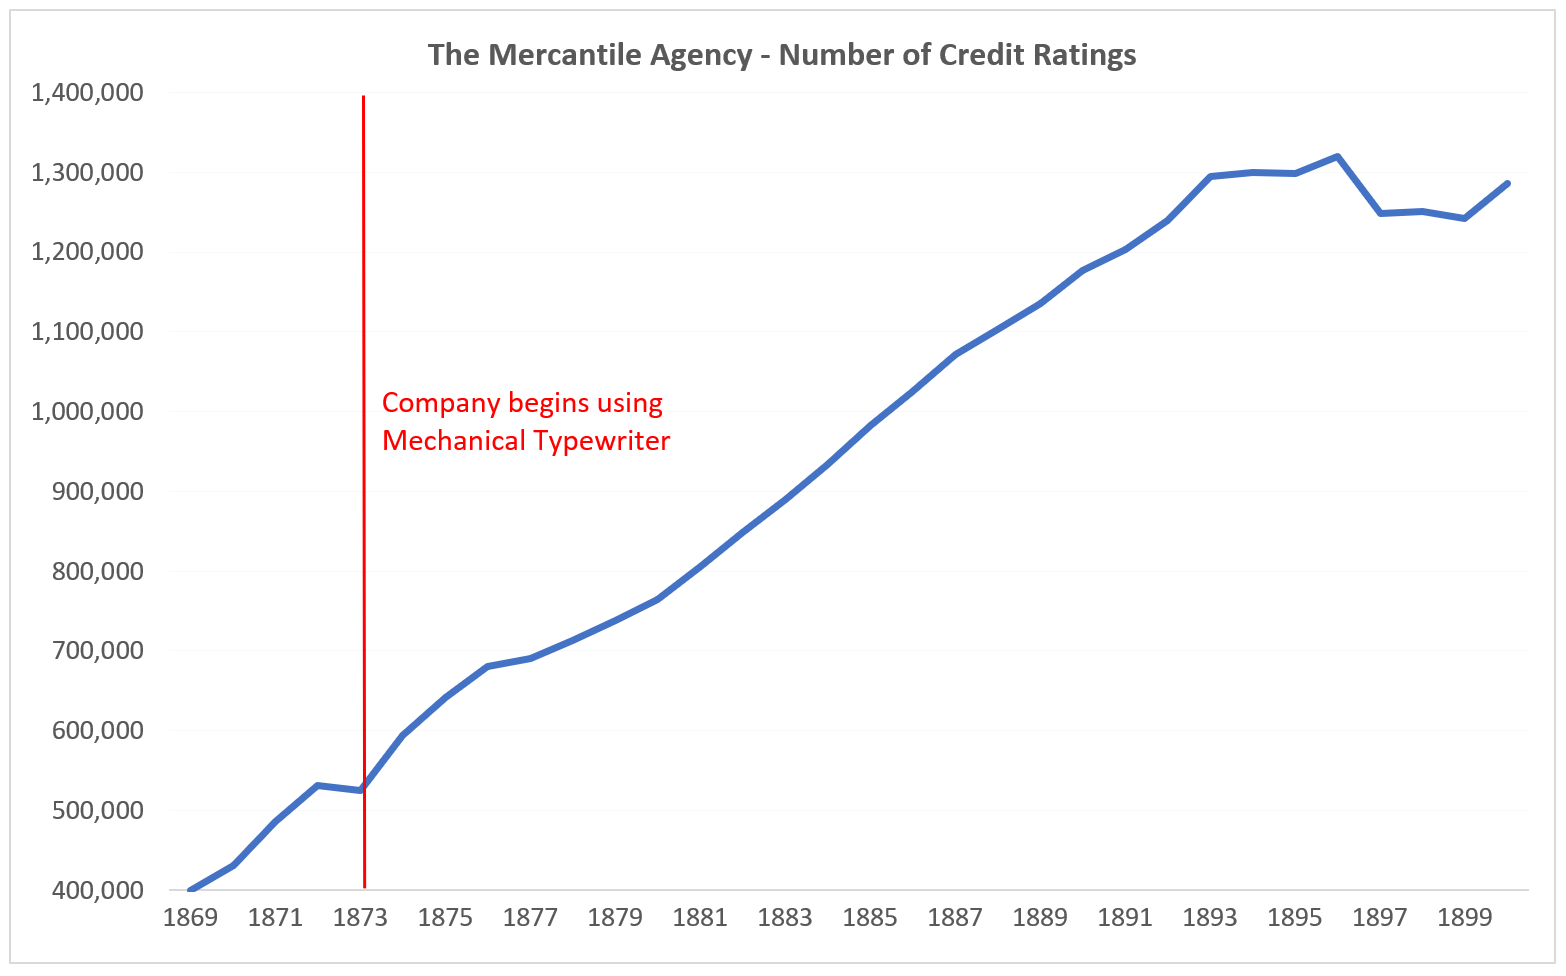
The immediate impact typewriters had on Mercantile’s business is shown below. Across the entire period (1869–1900), the largest year-over-year increase occurred when Mercantile started utilizing typewriters. In modern parlance, the company was benefitting from network effects. Since the typewriter could quickly add new reports to the master database and produce reports to various branches simultaneously, the company attracted more paying clients, which required more branches, which created more data.
The typewriter was pivotal for managing credit risk in the 19th century as it enabled Mercantile to produce more reports, disseminate them faster, and keep reports at all its branches in sync. However, the typewriter simply made existing processes faster and more efficient. Today, software makes existing processes more efficient but also creates entirely new capabilities.
A key distinction between this historical example and innovations today is that the typewriter was static hardware. A typewriter would always be a typewriter. On the other hand, software is dynamic. Software is a platform for innovative growth that’s relatively capital light.
For these reasons, software is an increasingly important asset for managing risk, and firms building this asset themselves are well-positioned for the future.
Modern Applications
Unlike our 19th century predecessors, investors today are not hampered by a lack of technology or data resources. In fact, we are overwhelmed by data. Yet, there are similarities in how technology and data are leveraged for managing risk in each period.
The Mercantile Agency system was still a system reliant upon humans producing one type of information. Technology (typewriters) could make things more efficient, but there were still production constraints because of the input source: humans. A person can only type so many keys a minute.
As shown below, the key difference between the 19th century and today is the amount of processing power being generated from multiple sources. Software and technology tools today have eliminated the human constraints on output and efficiencies. The processing power is almost incomparable.
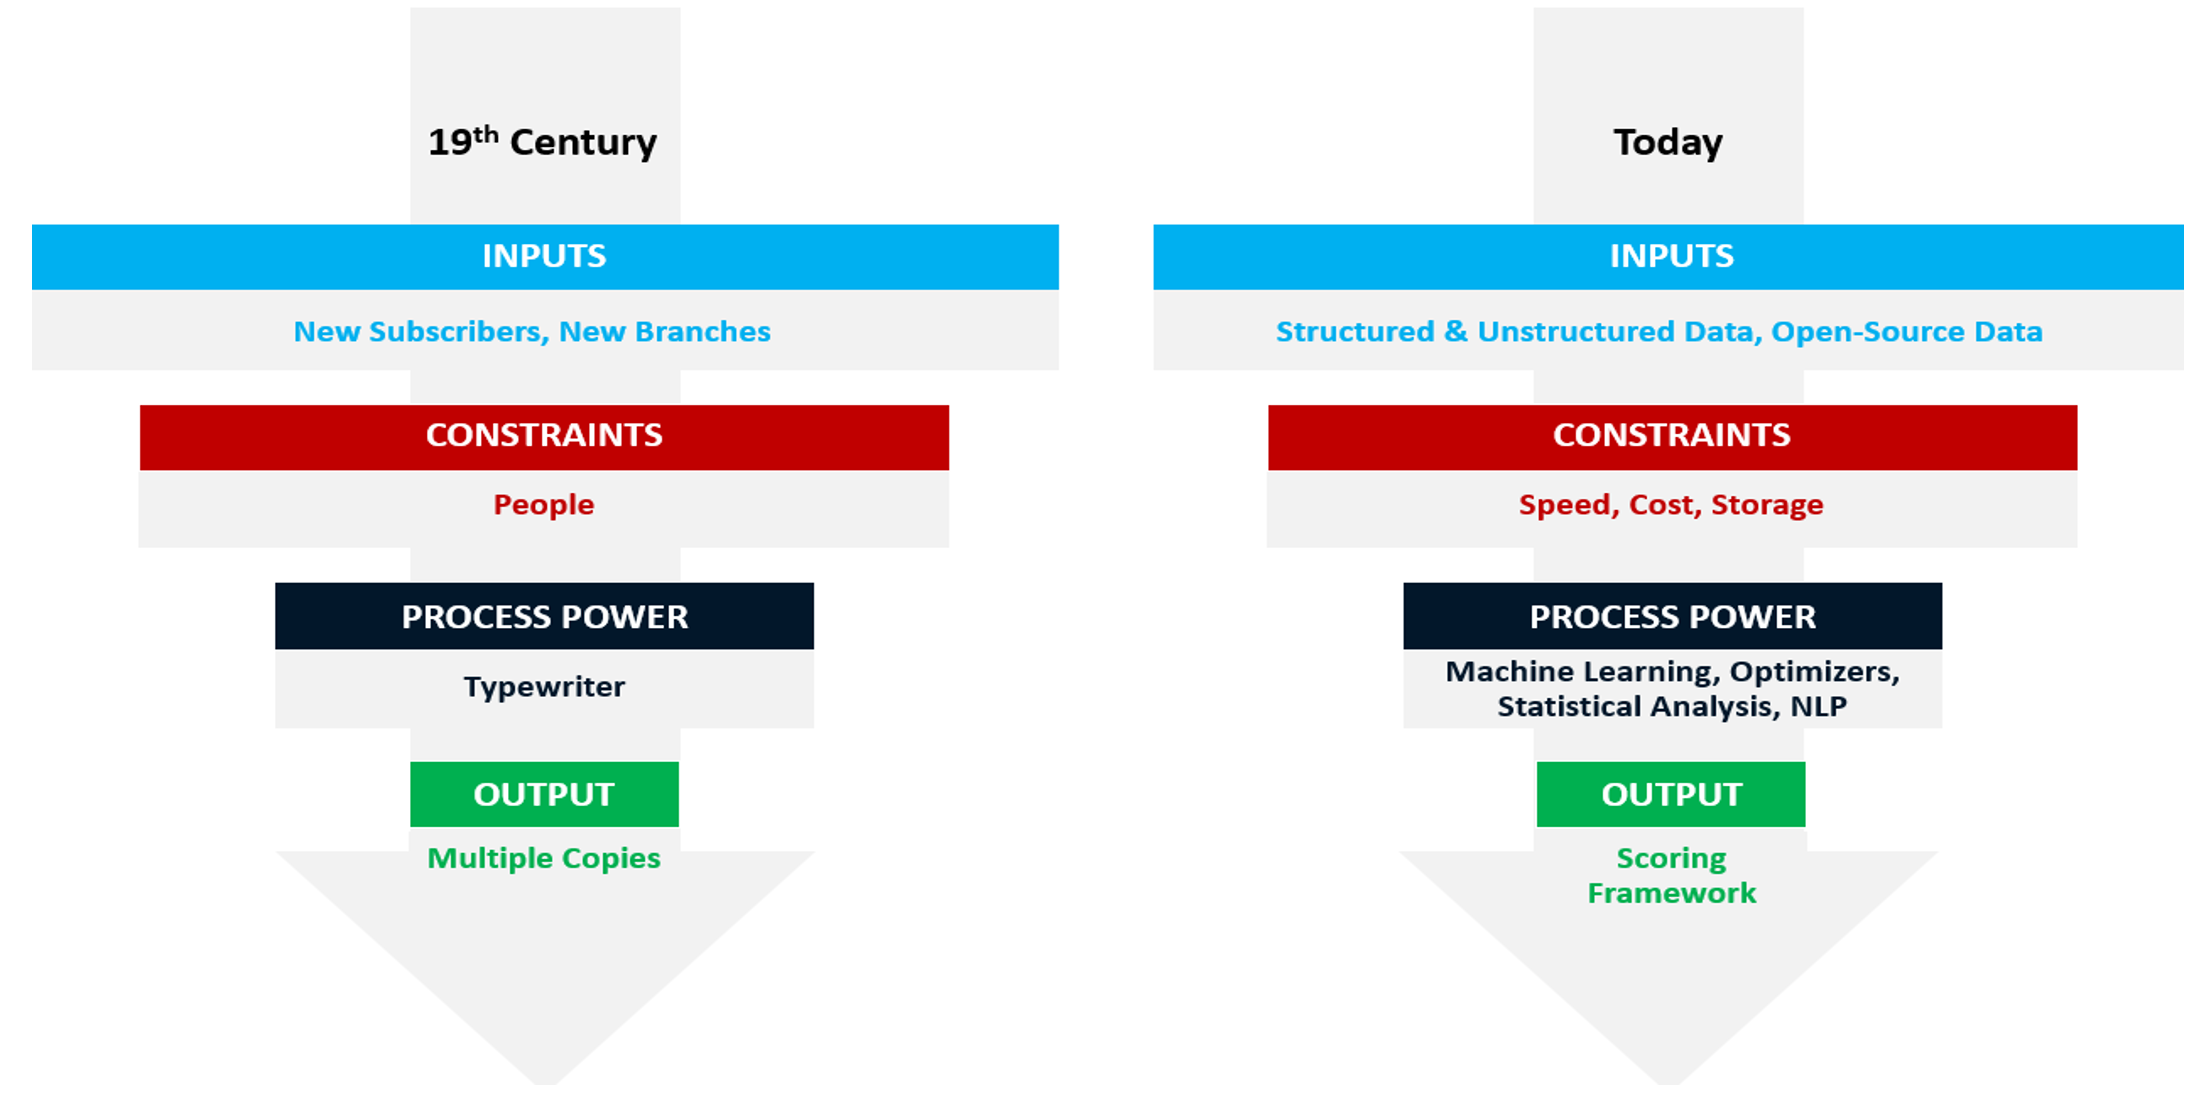
The typewriter was a single technology that revolutionized credit reporting and risk management in the 19th century by improving efficiencies, today there are dozens of innovations changing how investors manage risk (Machine Learning, Natural Language Processing, Artificial Intelligence, etc.). For example, we leverage a stock’s factor profile to screen out companies scoring in the lowest decile of our Quality themes like Earnings Growth, Financial Strength and Earnings Quality.
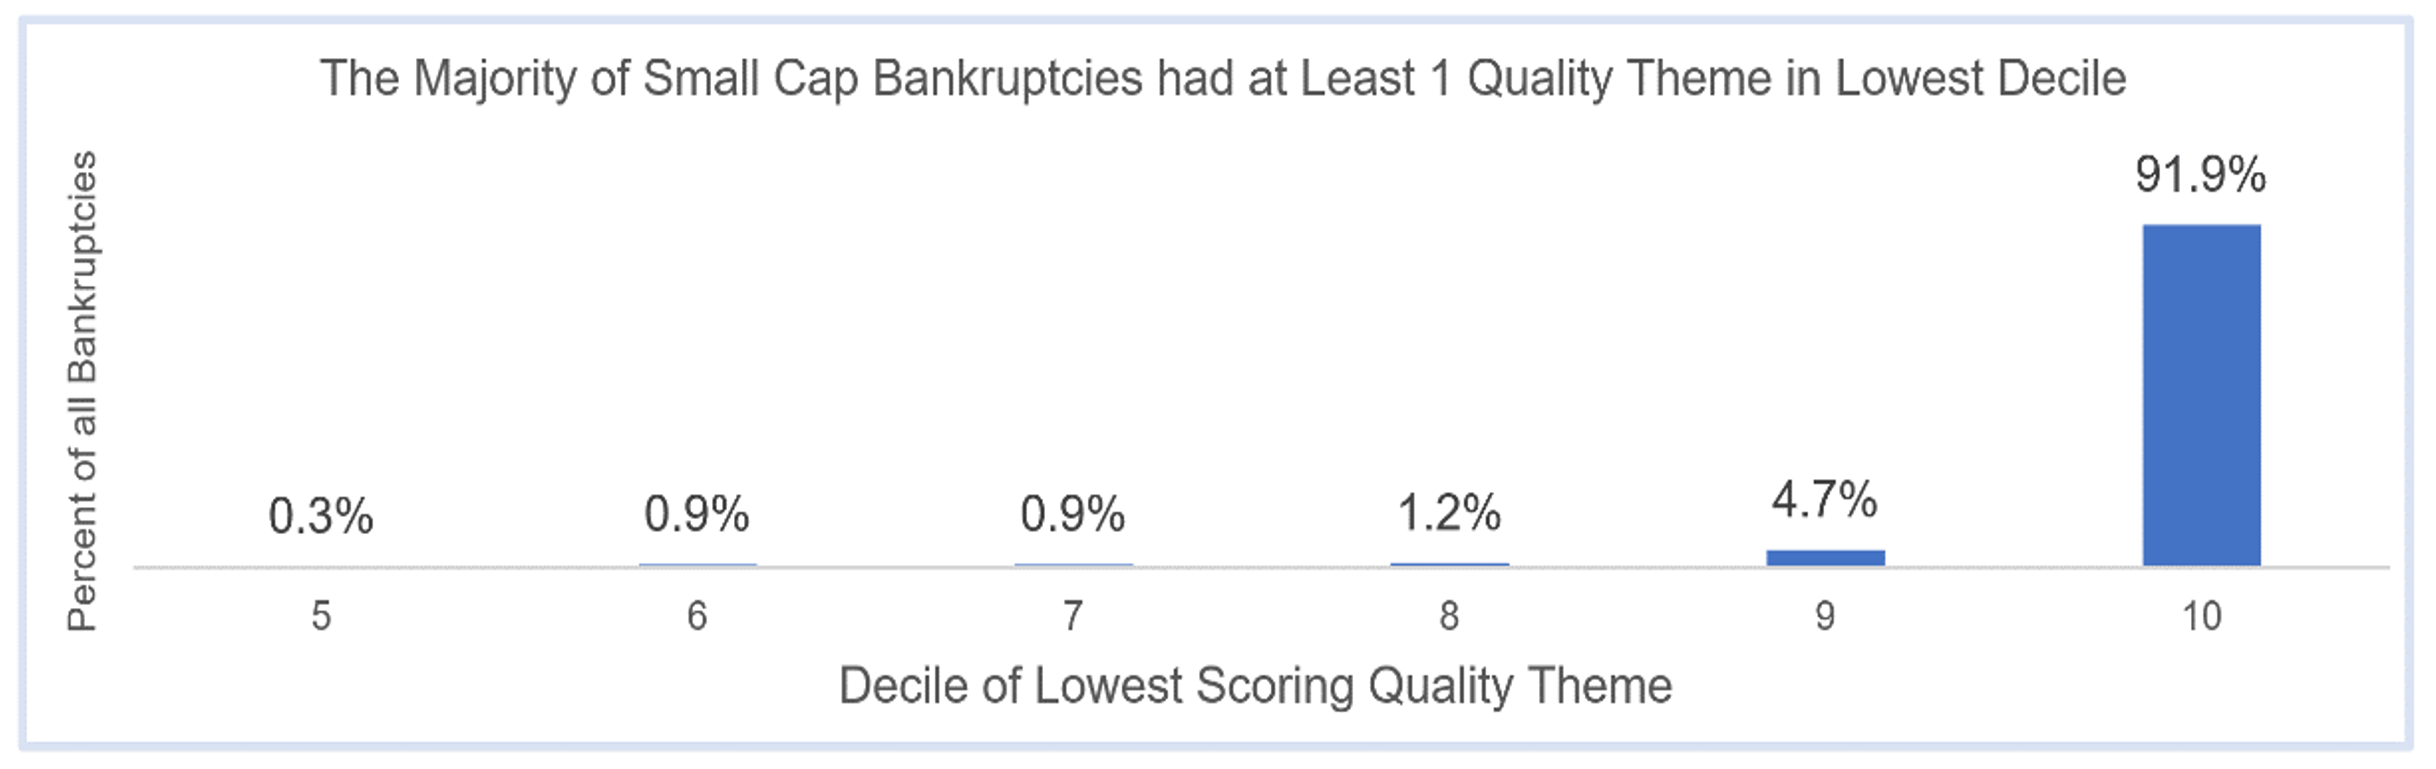
To demonstrate the efficacy of this factor research, our systematic use of Quality as an exclusionary factor has been critical in avoiding worst-case scenarios like bankruptcy. The chart below shows that 92% of bankruptcies in the US Small Cap universe were identified ex-ante by falling into one of the lowest deciles of our quality themes—stocks that we specifically exclude in our process.
The following sections highlight how O’Shaughnessy Asset Management has leveraged software and technology to explore new frontiers in risk management.
Technology, Data, & Concentrated Stock Risk
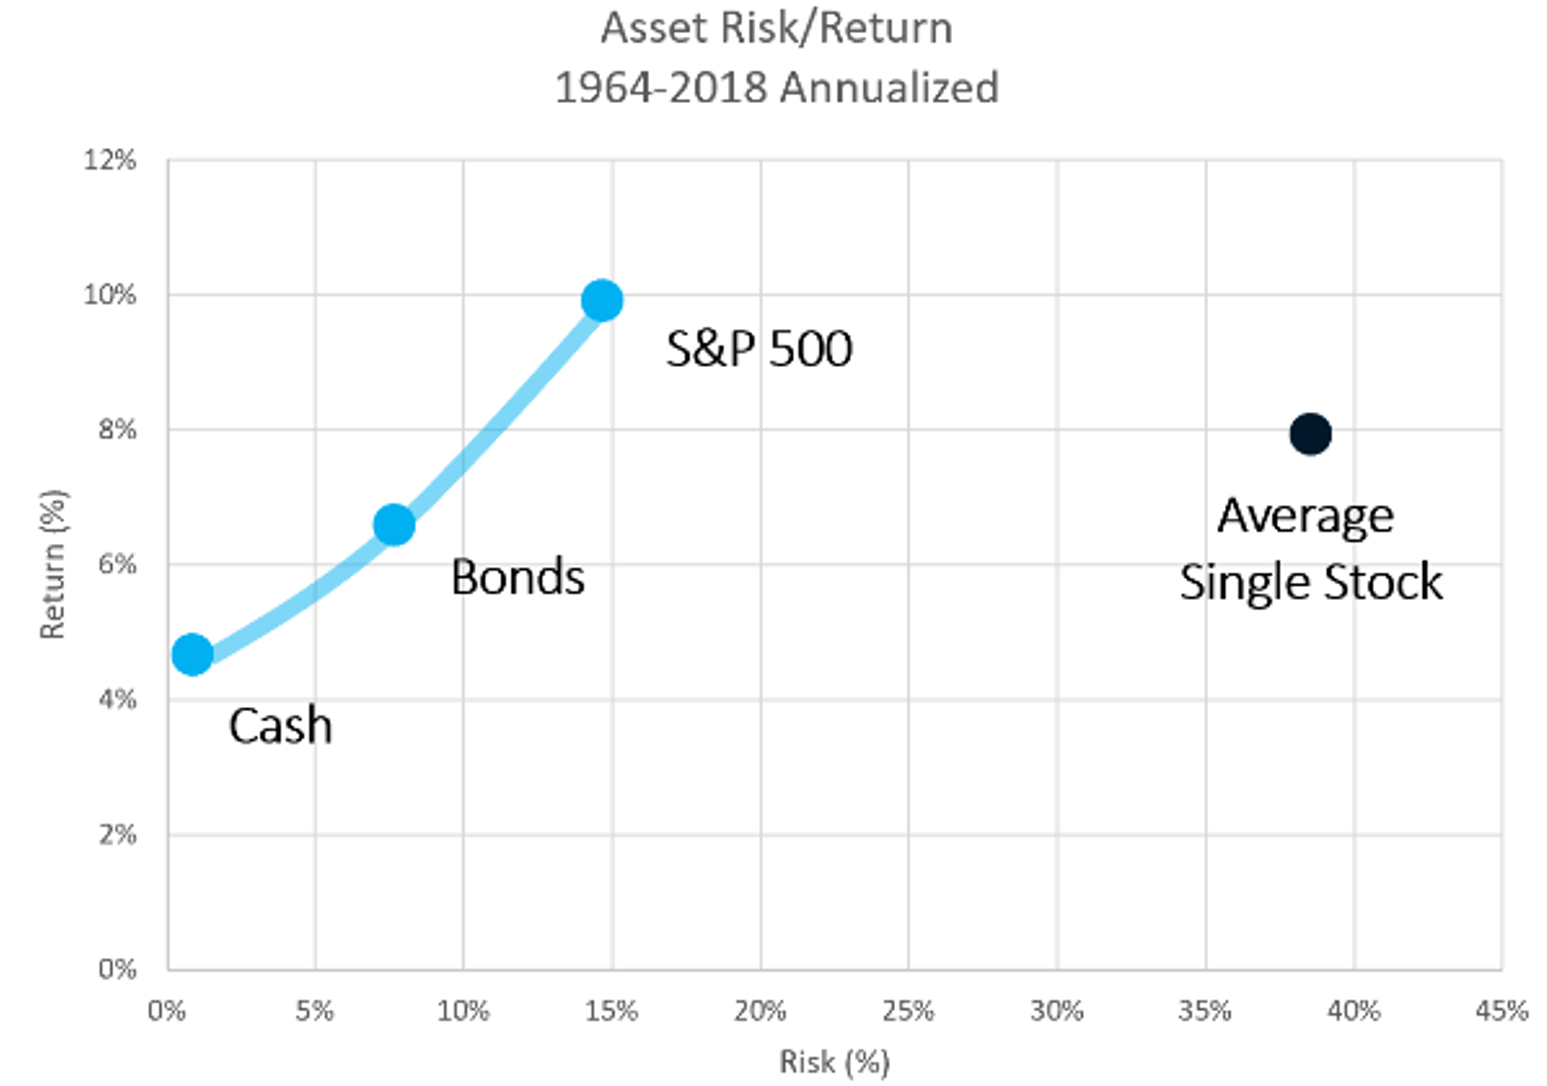
Managing clients’ concentrated stock positions is a challenging issue for financial advisors, and often occurs when early employees of start-ups or corporate executives have significant wealth tied up in low-cost basis stock or options. While there are worse problems to have, the fact remains that most individual stocks underperform the market and having a large portion of your wealth tied to one company is risky.
Concentrated Stock Risk
The following example represents a real-life Canvas portfolio. An advisor’s client started using Canvas with a 45% weight to Accenture. The client’s advisor was eager to transition to a more diversified portfolio, but the position was owned at $0 cost basis. Through active tax management (% of position sold each day labeled on the curve) the position was reduced to 14% in 8 months with zero net capital gains. This led the advisor to liquidate the position in August to fully achieve the target diversified model at a fraction of the cost and risk exposure.
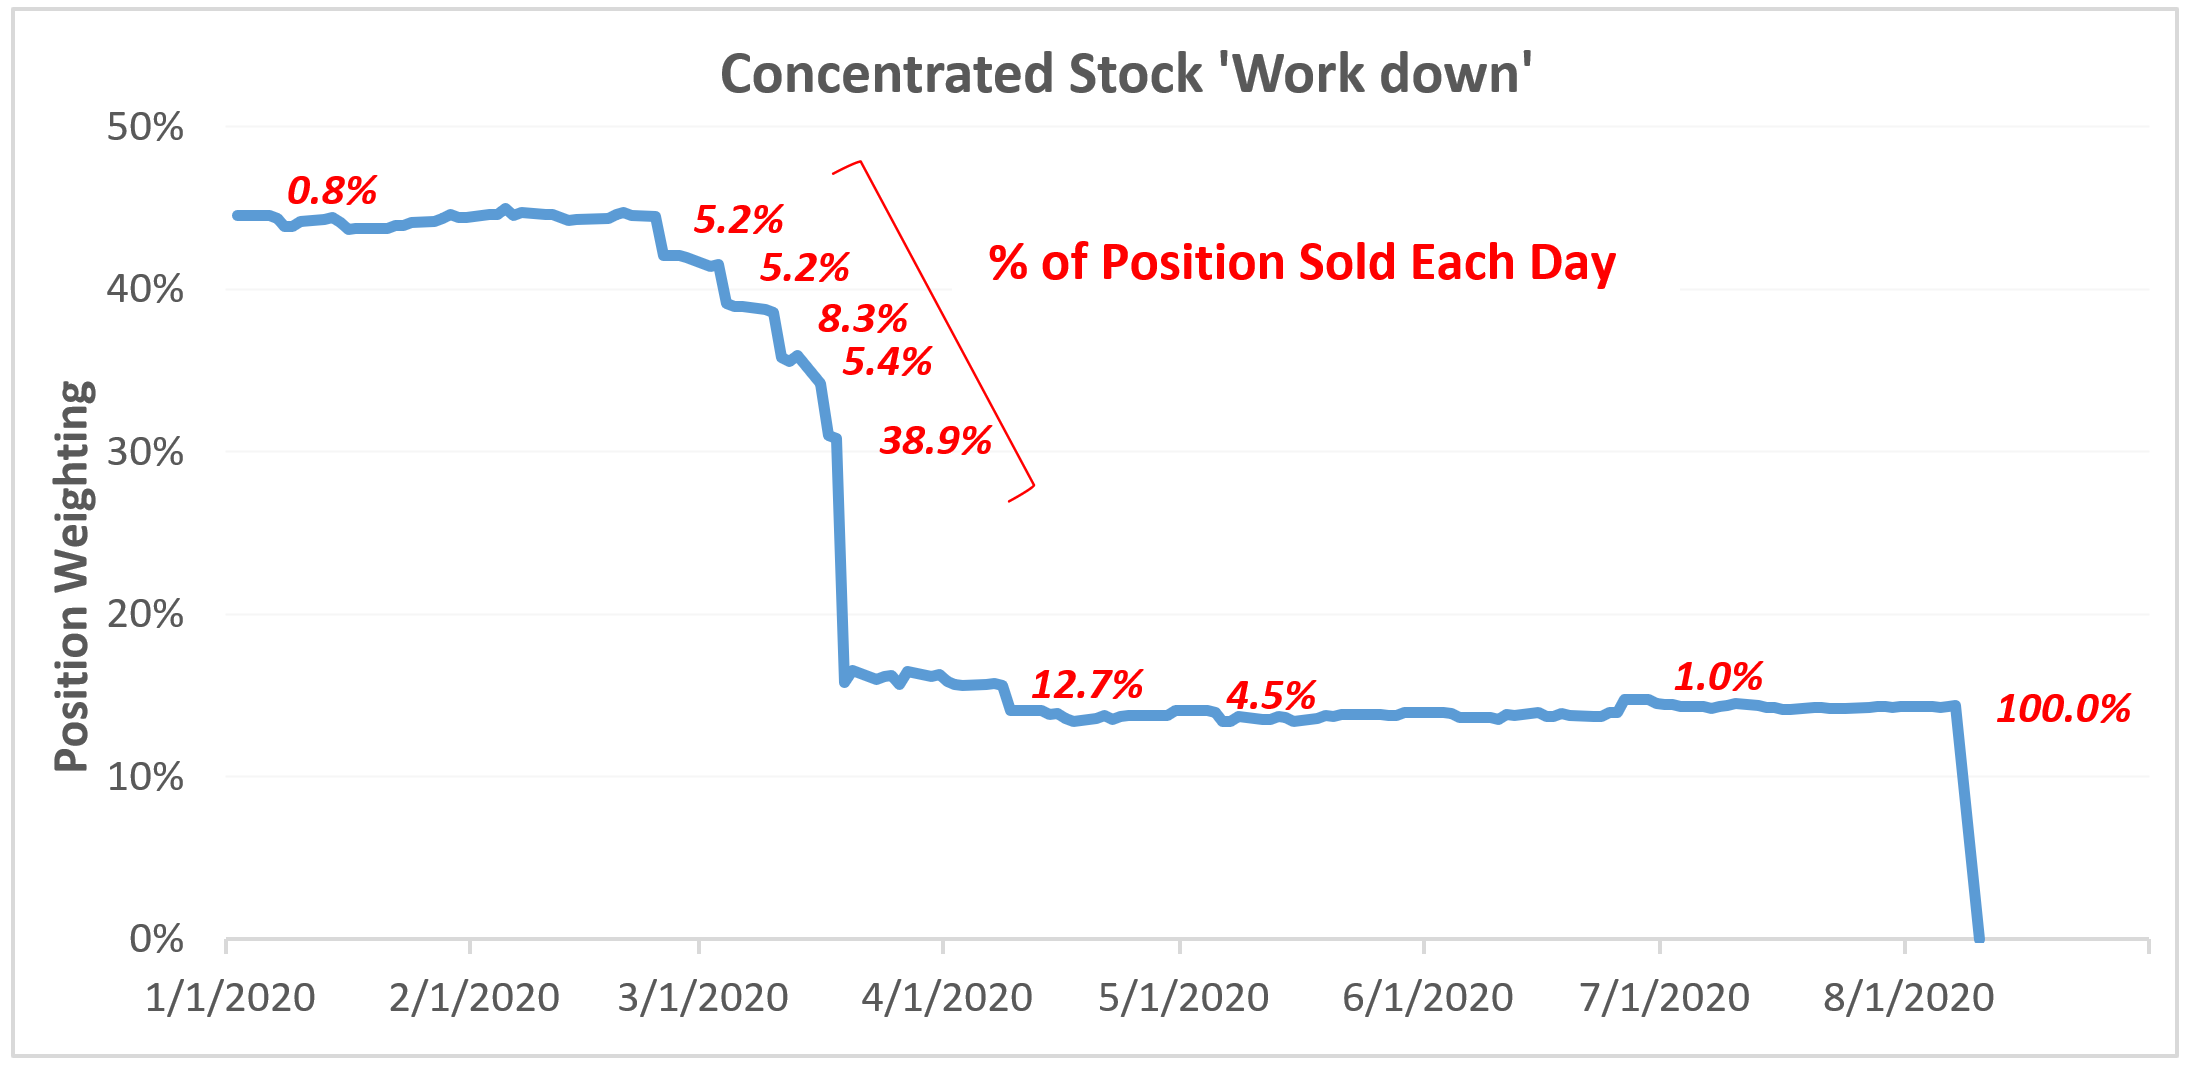
Of course, it is important to note that this occurred within the context of COVID-19, when markets cratered in the first half of 2021. However, the Canvas tax management system enabled us to be more tactical than many other systems, allowing us to be more efficient as markets fell.
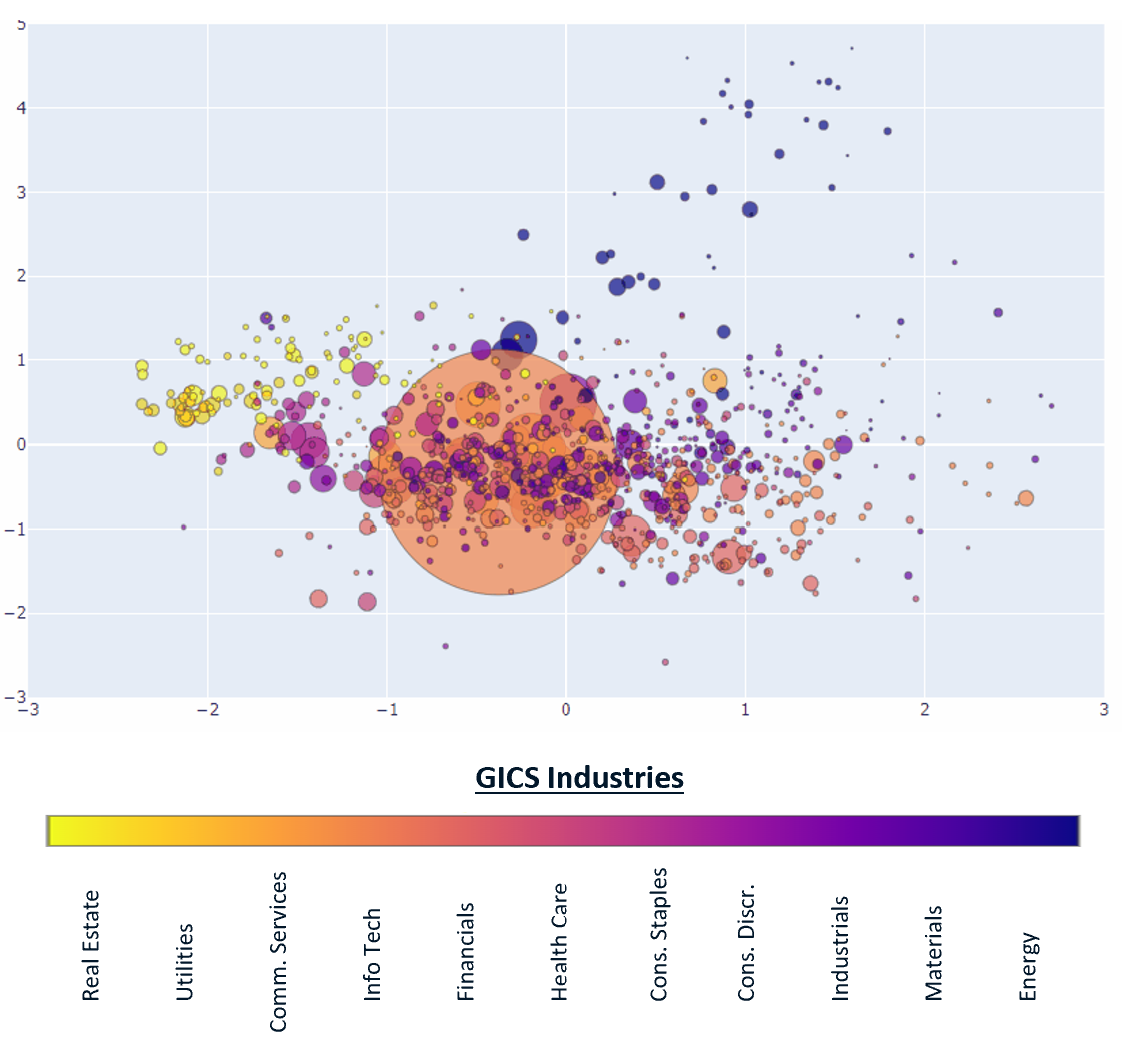
How was this possible? We utilized proprietary risk modeling to assess the drivers of risk for Accenture and broader investment universe. These 'drivers' include common themes like industry, geography, macroeconomic drivers (interest rates, inflation, oil, etc.), as well as factors like value, momentum, yield, and quality. The optimizer uses this risk assessment to understand a stock’s underlying exposures.
The chart below distills dozens of risk factors into a 2D visual of how Accenture’s risk profile compares to the broader market. The size of the circles corresponds to each stock’s risk contribution to the benchmark and the colors correspond to sectors. Proximity of circles signifies similar risk profiles, so overlapping circles represent overlapping risk exposures. By adjusting the top image for the portfolio’s weight to Accenture, the Accenture risk bubble gets significantly larger.

Representative Risk Exposure within Russell 1000 Index
Risk Exposure in Concentrated Portfolio
Nearest Neighbors
This proprietary risk modelling framework is crucial because it enables us to identify stocks with similar risk profiles (“Nearest Neighbors”) to the concentrated stock and build a passive “risk-aware” index that underweights or excludes these stocks. For example, if a client’s concentrated position is in Home Depot, it would be counterproductive to continue investing in Home Depot and/or Lowe’s.
Private Company Risk Mapping
Our exciting work on private company risk mapping demonstrates the powerful network effects that well-organized risk management frameworks can produce. By leveraging two other sophisticated quantitative tools, we were able to expand the “Nearest Neighbor” analysis capabilities to include private companies, as well as public. This is significant because it means that individuals with concentrated positions in private companies are now able to better manage their risk. Managing private market risk in concert with public market risk is key for overall portfolio management.
Conclusion
This paper leaves us with a few important takeaways.
First, advances in software and technology are producing innovative techniques for managing risk. While there are historical parallels, important differences make the modern era uniquely exciting. Technological innovations in the 19th century were largely task-specific, like “mechanical writing”, whereas the software innovations of today are dynamic and continually push new frontiers. A piece of software may initially serve one function, but unlock new capabilities as other tools are developed and new technology emerges. Put simply, software innovations beget software innovations.
Second, investors should ensure that they are benefitting from new software tools for managing risk. Hesitancy and inertia always surround new innovations, but meritocracy eventually wins out. The Mercantile Agency made the first commercial purchase of typewriters in 1874 and business boomed. In fact, the Mercantile Agency still lives on today as Dun & Bradstreet (Ticker: DNB).
The third lesson is that data is more commoditized than ever. Thus, the ability to leverage software for analysis and create new tools for managing risk will differentiate advisors and asset managers.
FOOTNOTES
1 Arthur Crump, The Theory of Stock Exchange Speculation (1874)
2 The Economist, ‘The King of Con-Men’ (December 22, 2012)
3 Josh Lauer, From Rumor to Written Record: Credit Reporting and the Invention of Financial Identity in 19th Century America
4 Jonathan Weinberg, Know Everything That Can Be Known about Everybody: The Birth of the Credit Report
O’SHAUGHNESSY ASSET MANAGEMENT, L.L.C.
CANVAS® PLATFORM
IMPORTANT DISCLOSURES (revised as of 10-2021)
CANVAS® is an interactive web-based investment tool developed by O’Shaughnessy Asset Management, L.L.C. (“OSAM”) that permits an investment professional (generally a registered investment advisor or a sophisticated investor) to select a desired investment strategy for the professional’s client. At all times, the investment professional, and not OSAM, is responsible for determining the initial and ongoing suitability of any investment strategy for the investment professional’s underlying client. The professional’s client shall not rely on OSAM for any such initial or subsequent review or determination. Rather, to the contrary, at all times the professional shall remain exclusively responsible for same. See MORE ABOUT CANVAS below and Release and Hold Harmless at the end of this Important Disclosure Information.
Reliance on Investment Professional: OSAM has relied, and shall continue to rely, on the investment professional’s knowledge and experience to understand the inherent limitations of the performance presentation, including those pertaining to back-tested hypothetical performance. All performance presentations, including hypothetical performance, are the direct result of the investment professional’s request, independent of OSAM. Depending upon the investment professional’s direction and selection, hypothetical presentations can include both OSAM and non-OSAM Models and/or strategies. The below discussion as to the material limitations of back-tested hypotheticals apply to both OSAM and non-OSAM Models and/or strategies.
Intended Recipient: CANVAS content is intended for the investment professional only not to be shared with an underlying client unless in conjunction with a meeting between the investment professional and its client in a one-on-one setting. OSAM assumes that no hypothetical performance-related content will be provided directly to the professional’s client without the accompanying consultation and explanation of the professional. The content is intended to assist the professional in evaluating the appropriate investment strategy for the professional’s client.
OSAM Models. OSAM has devised various investment models (the “Models”) for CANVAS, the objectives of each are described herein. The investment professional is not obligated to consider or utilize any of the Models. As indicated above, at all times, the investment professional, and not OSAM, is responsible for determining the initial and ongoing suitability of any Model for the investment professional’s underlying client. Model performance reflects the reinvestment of dividends and other account earnings and are presented both net of the maximum OSAM’s investment management fee for the selected strategy and gross of an OSAM investment management fee. Please Note: As indicated at Item 5 of its written disclosure Brochure, OSAM’s CANVAS management fee ranges from 0.20% to 1.15%. The average percentage management fee for all CANVAS strategies is 0.36%. The percentage OSAM management fee shall depend upon the type of strategy and the corresponding amount of assets invested in the strategy; generally, the greater the amount of assets, the lower the percentage management fee. Please Also Note: The performance also do not reflect deduction of transaction and/or custodial fees (to the extent applicable), the incurrence of which would further decrease the performance. For example, if reviewing a strategy with a ten-year return of 10.0% each year, the effect of a 0.10% transaction/custodial fee would reduce the reflected cumulative returns from 10.0% to 9.9% on a 1 year basis, 33.1% to 32.7% on a 3 year basis, 61.1% to 60.3% on a 5 year basis and 159.4% to 156.8% on a 10 year basis respectively.. Please Further Note: Transaction/custodial fees will differ depending upon the account broker-dealer/custodian utilized. While some broker-dealers/custodians do not charge transaction fees for individual equity (including ETF) transactions, others do. Some custodians charge fixed fees for custody and execution services. Choice of custodian is determined by the investment professional and his/her/its client. Higher fees will adversely impact account performance.
OSAM does not maintain actual historical performance results for the Models. In order to help assist the investment professional in determining whether a Model is appropriate for the professional’s client, OSAM has provided back-tested hypothetical (i.e., not actual) performance for the Model. OSAM, with minor deviations that it does not consider to be material*, currently uses the Models (i.e., live models vs. the reflected back-tested versions thereof) to manage actual client portfolios (see Model Deviations below). The performance reflects the current Model holdings, which are subject to ongoing change.
Material Limitations: The Performance is subject to material limitations. Please see Hypothetical/Material Limitations below. During any specific point in time or time-period, the Models, as currently comprised, performed better or worse, with more or less volatility, than corresponding recognized comparative indices, benchmarks or blends thereof.
Past performance may not be indicative of future results. Therefore, it should not be assumed that future performance of any specific investment or investment strategy (including the Models), will be profitable, equal any historical index or blended index performance level(s), or prove successful. Historical index results do not reflect the deduction of transaction and custodial charges, or the deduction of an investment management fee, the incurrence of which would have the effect of decreasing indicated historical performance results. The Russell 3000 is a market capitalization-weighted index of 3000 widely held large, mid, and small cap stocks. Russell chooses the member companies for the Russell 3000 based on market size and liquidity. The MSCI All Country World Index is a market capitalization weighted index designed to provide a broad measure of equity-market performance throughout the world. The MSCI is maintained by Morgan Stanley Capital International and is comprised of stocks from 23 developed countries and 24 emerging markets. The Barclays Capital Aggregate Bond Index is a market capitalization-weighted index, meaning the securities in the index are weighted according to the market size of each bond type. Most U.S. traded investment grade bonds are represented. Municipal bonds and Treasury Inflation-Protected Securities are excluded, due to tax treatment issues. The index includes Treasury securities, Government agency bonds, Mortgage-backed bonds, corporate bonds, and a small amount of foreign bonds traded in U.S. The historical performance results for the Russell 3000, MSCI and Barclays are provided exclusively for comparison purposes only, to provide general comparative information to help assist in determining whether a Model or other type strategy (relative to the reflected indices) is appropriate for his/her investment objective and risk tolerance. Please Also Note: (1) Performance does not reflect the impact of client-incurred taxes; (2) Neither Model or the selected strategy holdings correspond directly to any such comparative index; and (3) comparative indices may be more or less volatile than the Model or selected strategy.
Hypothetical/Material Limitations-performance reflects hypothetical back-tested results that were achieved by means of the retroactive application of a back-tested portfolio and, as such, the corresponding results have inherent limitations, including: (a) the performance results do not reflect the results of actual trading using investor assets, but were achieved by means of the retroactive application of the Model or strategy (as currently comprised), aspects of which may have been designed with the benefit of hindsight; (b) back tested performance may not reflect the impact that any material market or economic factors might have had on OSAM’s (or the investment professional’s) investment decisions for the Model or the strategy; and, correspondingly; (c) had OSAM used the Model to manage actual client assets (or had the investment professional used the selected strategy to manage actual client assets) during the corresponding time periods, actual performance results could have been materially different for various reasons including variances in the investment management fee incurred, transaction dates, rebalancing dates (increases account turnover), market fluctuation, tax considerations (including tax-loss harvesting-increases account turnover), and the date on which a client engaged OSAM’s investment management services.
MORE ABOUT CANVAS®
CANVAS is an interactive web-based investment tool developed by O’Shaughnessy Asset Management, L.L.C. (“OSAM”) that permits an investment professional (generally a registered investment advisor or a sophisticated investor) to select a desired investment strategy (the “Strategy”) for the professional’s client. At all times, the investment professional, and not OSAM, is responsible maintaining the initial and ongoing relationship with the underlying client and rendering individualized investment advice to the client. In addition, the investment professional and not OSAM, is exclusively responsible for:
· determining the initial and ongoing suitability of the Strategy for the client;
· devising or determining the specific initial and ongoing desired Strategy;
· monitoring performance of the Strategy; and,
· modifying and/or terminating the management of the client’s account using the Strategy.
Hypothetical Limitations: To the extent that the investment professional seeks for CANVAS to provide hypothetical back-tested performance, material limitations apply-see above.
Model Deviations: As indicated above, OSAM, with minor deviations that it does not consider to be material*, currently use the Models to manage actual client portfolios (i.e., the live Models). The deviations include
· the use of proxies if and when an ETF used in the back-test was not available*. While the back-tested and live strategies both utilize the same investment themes, back-tested proxies can deviate from live models based on limitations of historical information;
· back-tested data presented utilizes a month-end rebalance while actual live model performance reflects intra-month rebalances;
· OSAM, as a discretionary manager, can update its live models as determined necessary. These changes will then be applied retroactively to back-tested models, the resulting performance of which would be different than that of the actual historical models-see Hypothetical/Material Limitations above; and,
· Financial statement information may be restated over time, which information was not reflected in the historical back-tested models. Companies will also have mergers and acquisitions or other corporate events that can retrospectively affect the names and corporate identities of organizations in the historical back-tests. Data providers providing pricing and return information may update historical data upon discovering deficiencies or omissions.
Strategy Sampling Impact: The implementation of OSAM strategies utilize a sampling of the underlying individual Strategy positions, and, as the result thereof, the underlying securities’ weighting could unintentionally deviate +/- the Strategy allocation target OSAM calculates the CANVAS fees based on the mix of strategies that are utilized at the establishment of the account. Therefore, the sampling approach can cause deviations between the CANVAS strategy allocation establishment (and its corresponding fee) and the implementation of that CANVAS strategy.
ESG Portfolios/Socially Responsible Investing Limitations. To the extent applicable to the strategy chosen by the investment professional, Socially Responsible Investing involves the incorporation of Environmental, Social and Governance considerations into the investment due diligence process (“ESG). There are potential limitations associated with allocating a portion of an investment portfolio in ESG securities (i.e., securities that have a mandate to avoid, when possible, investments in such products as alcohol, tobacco, firearms, oil drilling, gambling, etc.). The number of these securities may be limited when compared to those that do not maintain such a mandate. ESG securities could underperform broad market indices. Investors must accept these limitations, including potential for underperformance. Correspondingly, the number of ESG mutual funds and exchange-traded funds are few when compared to those that do not maintain such a mandate. As with any type of investment (including any investment and/or investment strategies recommended and/or undertaken by OSAM), there can be no assurance that investment in ESG securities or funds will be profitable, or prove successful.
Tax Management Function: When requested by the investment professional, OSAM will use best efforts to work within Onboarding Budgets, Annual Tax Budgets, and Tracking Error Budgets. However, market and/or specific stock price fluctuations can occur quickly and can correspondingly adversely affect our ability to manage to specified budgets. Additionally, changes to tax budgets, cash flows in and out of an account, mandatory corporate actions, and funding with securities can also impact preciseness. The investment professional must accept this risk. In addition:
· OSAM has not, and will not, verify the accuracy of any tax-related information provided;
· In the event that any such information provided is inaccurate or incomplete, the corresponding results will be inaccurate or incomplete;
· Tracking Error Budgets are relative to the Model, not the benchmark;
· OSAM is not a CPA and this is not tax advice;
· Tax laws and rates change;
· While we seek to follow the investment professional prescribed target models, ranges, timeframes, tax budgets, and seek not to create wash sales or exceed expected tax budgets, there can be no assurance that the CANVAS tool will be able to accurately do so; and,
· For specific personalized tax-related advice, consult with a CPA or other tax professional.
Fixed Income ETF Model-The models are constructed using passive fixed income ETFs. The models attempt to target varying levels of duration and credit exposure relative to the Barclays Aggregate Index. The expense ratios of the underlying ETF’s are born by the investor and are separate and apart from CANVAS related fees.
Miscellaneous Limitations/Issues:
· Results in the Transition Portal reflect expense ratios corresponding to the specific funds indicated/provided by the investment professional. Expense ratios are provided by an unaffiliated database. Results also reflect projected future yields corresponding to such current indicated funds. Such data may not be precise;
· The risk-free rate used in the calculation of Sortino, Sharpe, and Treynor ratios is 5%, consistently applied across time;
· OSAM did not begin to offer CANVAS until April 2019. Prior to 2007, OSAM did not manage client assets; and,
· A copy of OSAM’s written disclosure Brochure, Form CRS and Privacy Notice remains available on this CANVAS website or at www.osam.com.
Release and Hold Harmless
The professional, to the fullest extent permitted under applicable law, agrees to release, defend, indemnify and hold OSAM (including its officers, directors, members, owners, employees, agents, and affiliates) harmless from any and all adverse consequences, financial or otherwise, of any type or nature arising from or attributable to the professional’s access to, and use of, CANVAS, including, but not limited to, any claims for alleged or actual client losses or damages of any kind or nature whatsoever (including without limitation, the reimbursement of reasonable attorney’s fees, costs and expenses incurred by OSAM relating to investigating or defending any such claims and/or demands), except to the extent that actual losses are the direct result of an act or omission by OSAM that constitutes willful misfeasance, bad faith or gross negligence as adjudged by a court of final jurisdiction.
*except in the unlikely event that the performance of the proxy used in lieu of the actual ETF was materially different (positive or negative)
Lastly, please be advised, without limitation, OSAM shall not be liable for Losses resulting from or in any way arising out of (i) any action of the investor or its previous advisers or other agents, (ii) force majeure or other events beyond the control of OSAM, including without limitation any failure, default or delay in performance resulting from computer or other electronic or mechanical equipment failure, unauthorized access, strikes, failure of common carrier or utility systems, severe weather or breakdown in communications not reasonably within the control of OSAM, inaccuracy or incompleteness of any third-party data, or other causes commonly known as “acts of God,” or (iii) general market conditions. Under no circumstances shall OSAM be liable for consequential, special, incidental or indirect damages, punitive damages, or lost profits or reputational harm. Additionally, the responsibility solely rests on the “master user” of CANVAS at each independent firm, and NOT OSAM, to close out any associated users who may terminate at any time.


