The Factor Archives: Value
By Jamie Catherwood
February 2020
While they may not have been known by the same names, many modern investment factors have historical roots stretching back centuries. This series, The Factor Archives, provides historical context on the six factor themes underlying OSAM’s investment process. You can also find other posts from the Factor Archives series here.

THE FACTOR THESIS
We believe that price is one of the most predictive determinants of future alpha and try to identify companies trading at cheap prices relative to their sales, earnings, cash flows, and dividends.
While there are countless value strategies, we take a different approach by using a composite of value factors. Most investors tend to think of factors in singular terms. Price‐to‐earnings, for example, is a single factor for identifying undervalued stocks. Buying cheap companies on any individual value factor is better than a market-cap weighted index (which weights companies based solely off their size), but each have their strengths and weaknesses:
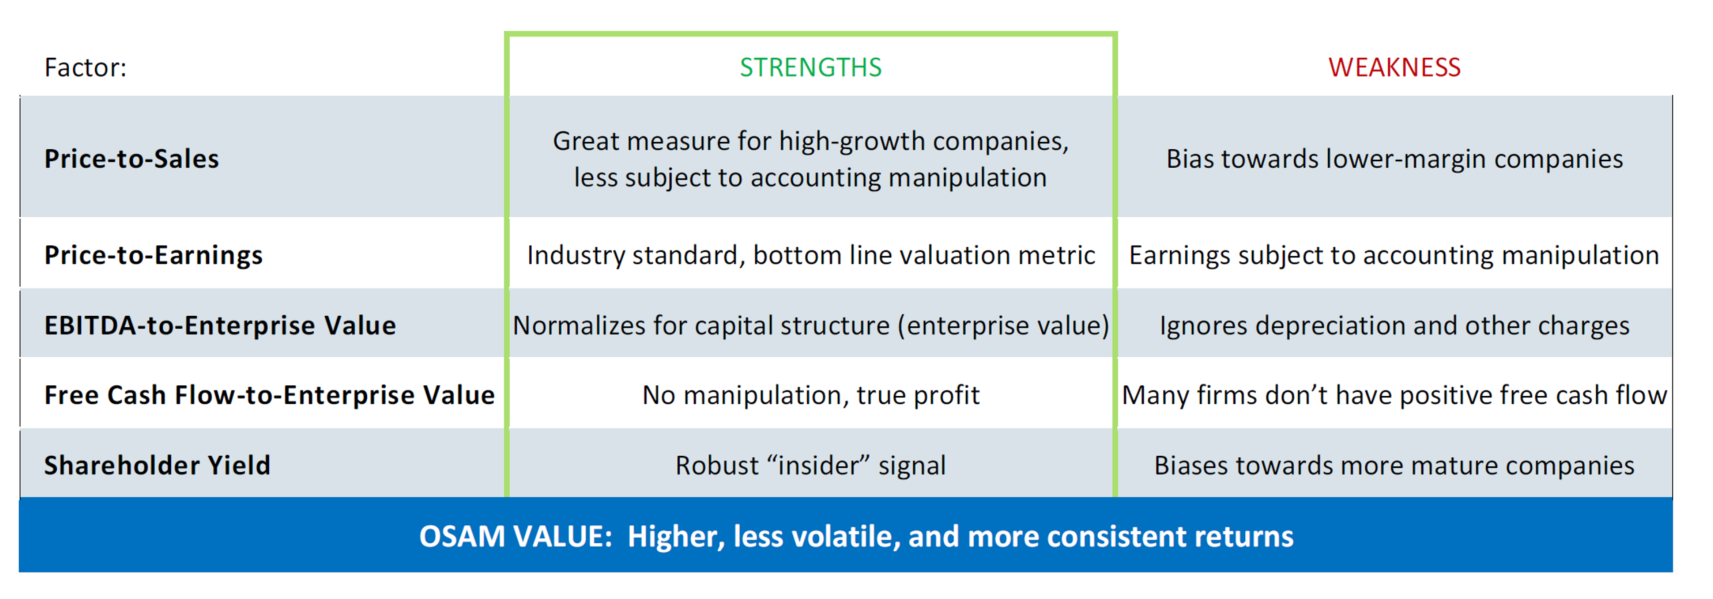
The table below demonstrates that using a composite of value factors offers better results than any one value factor in isolation.
THE EMPIRICAL EVIDENCE
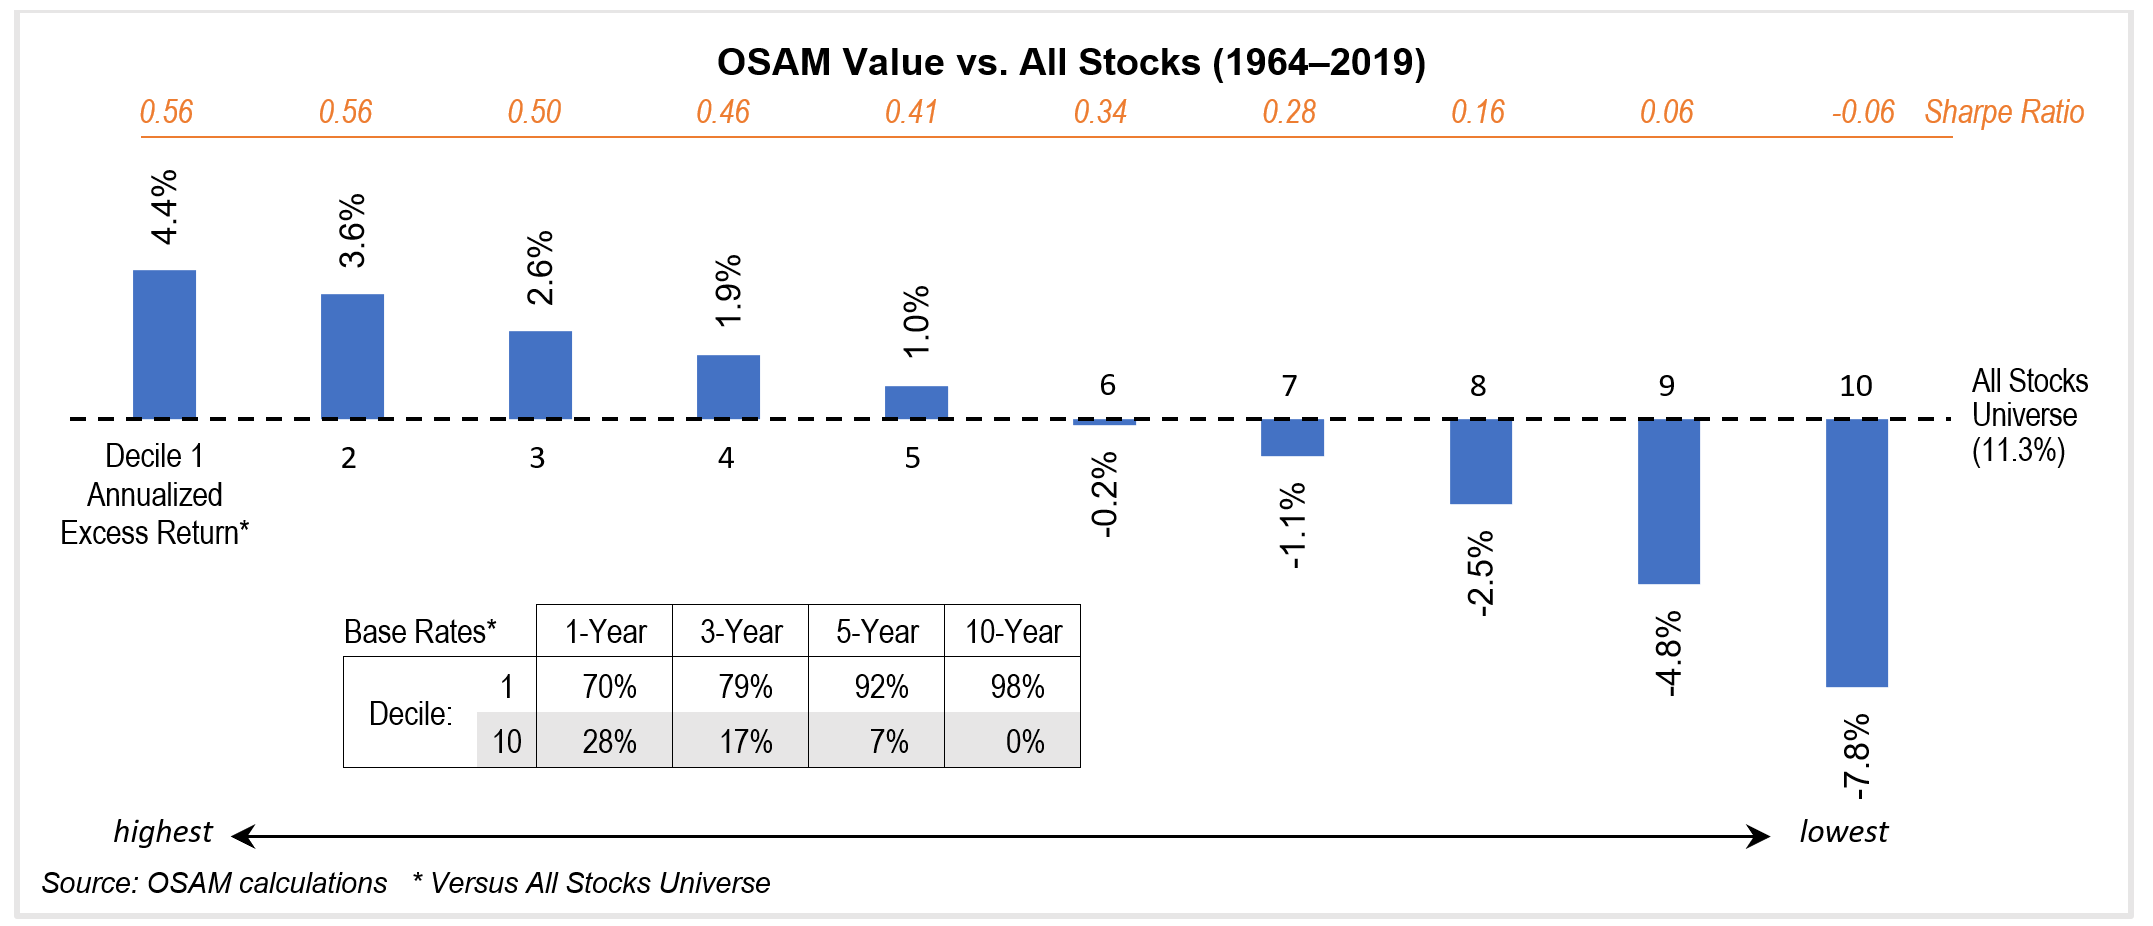
Our extensive research on Value is summarized in the chart below, which divides our All Stocks Universe into 10 groups based on valuation. Decile 1 represents the group of cheapest stocks; decile 10 shows the most expensive. The evidence is clear. Over the 55‐year study, the cheapest stocks had an excess return of 4.4% annualized, a higher Sharpe Ratio than the All Stocks Universe, and outperformed consistently (79% of the 672 rolling three-year periods).
HISTORICAL ORIGINS: THE MERCHANT PRINCIPLE
“All merchants or others who are accustomed to speculate in any commodity always take the price this commodity has been for many different years & putting them all together, see what the mean price is, or as they call it the average price – & whenever the commodity they mean to speculate in can be bought under their average price, they think they may safely engage, as they have reason to suppose it will rise in order to come up to its usual price… [to buy at high prices would be] absolute madness… you may reasonably expect as great a fall to bring it to the average as the careful speculator does a rise when he buys cheap.”
- Samuel Bosanquet (April 1773)1
Despite being applied to a different asset class (commodities), this 18th century investment principle embodies much of OSAM’s approach to value investing. The excerpt comes from a 1773 letter written by Samuel Bosanquet, a merchant. Writing to his sister that had asked for advice on ‘speculating’ in malt, he stressed that sensible merchants incorporated a Value discipline by only purchasing at below-average prices.2 Additionally, he warned against buying at expensive prices, calling it “absolute madness” to do so.
Importantly, Samuel also describes ‘mean reversion’, the source of Value’s alpha. For investors, the theory suggests that when prices are “below their average”, one could “safely engage” in speculation because an asset will likely “come up to its usual price”. This principle also holds true in the inverse scenario:
“You may reasonably expect as great a fall to bring it to the average as the careful speculator does a rise when he buys cheap.”3
A HISTORY LESSON: RAILROADS IN THE 19TH CENTURY
Chronic Booms and Busts
Financial markets in the 19th century can be summarized by a single word: railroads. The first ‘Railway Mania’ unfolded in England during the 1840s with fraudulent tycoons like George Hudson, later known as ‘The Railway King’. In 1830, there were only 98 miles of railway track in England, but by 1849, that figure had risen to 6,000 miles.4 Mania always leads to panic, though, and the market began crumbling in 1846 as the Irish Potato Famine and interest rate hikes decimated railroad operators. By 1850, the value of railway shares had been cut in half.5
The second railroad boom (but first in America) took shape after the Civil War, as 33,000 miles of railway track was laid across the nation between 1868 – 1873. Speculators poured their money into the burgeoning new industry, but its rapid expansion eventually proved fatal when the Panic of 1873 left many companies unable to service their debts.6 The 1873 crash was sparked by the failure of Jay Cook & Co., a merchant bank, and the ripple effects spread as banks suspended cash payments. The situation became so dire that the U.S. stock market was temporarily closed for the first time in history.7
“In the railroad industry, a number of other railroads were forced, in the face of a declining bond market and decreased interest in railroad bonds (particularly in Europe), to default on their debt. All told, nearly a quarter of railroad companies with outstanding bonds engaged in at least a partial default during this period.”8
Yet just a few years later, signs of investor amnesia emerged as aggressive railroad expansion and speculation broke out for a third time. In the 1880s, an astonishing 71,000 miles of railway track was built, and the financial industry kept in step by raising capital from the sea of speculators willing to part with their money. Then, as always, the railroad boom came to a brutal halt. The Panic of 1893 bankrupted many of the largest railroads, including Northern Pacific, Union Pacific, and the Atchison, Topeka & Santa Fe. Reports estimate that some 500 banks and 15,000 businesses were wiped out.9 In 1894, almost 25% of railroads were bankrupt.10
The Boy Who Cried Wolf
As the economist Jack Kenneth Galbraith put it:
“Nothing in the nineteenth century is more remarkable than the way men forgot the last railroad debacle and proceeded to lose money in the next.”11
After experiencing two railroad booms and busts in three decades, American investors were wary of railroad stocks. With a quarter of the industry bankrupt and leading operators in receivership, their skepticism was clearly warranted.
The great irony, though, was that just when American investors finally learned their lesson in avoiding railroad speculation, railroad stocks went on to post incredibly strong returns as a result of improving earnings and business fundamentals. However, the public’s aversion to railroad stocks was so vehement that even when demonstrable evidence of rising earnings was presented, it fell on deaf ears. Most investors would not dare risk their capital in railroad stocks after 1893. Thomas Gibson, a contemporary investor and author, wrote:
“These opportunities are seldom taken advantage of by the public because of the prejudice and odium inspired by bankruptcy. What the uninitiated fail to see is that bad management, bad financing or dishonest practices, or a combination of these evils, are responsible for receivership in almost all cases, and that a drastic reorganization removes the abuses without curtailing the territory or prejudicing the prospects of the rehabilitated road.”12
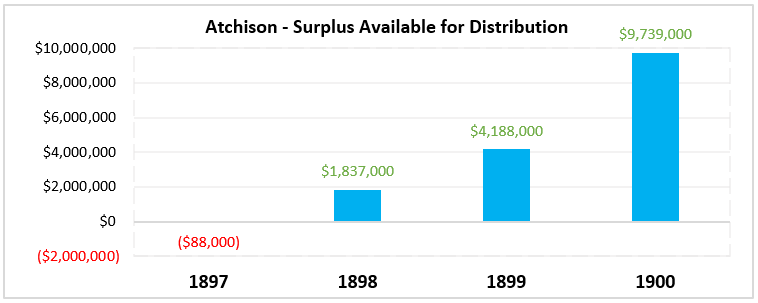
This prejudice meant investors missed a fantastic opportunity to purchase dramatically improving businesses with steadily rising earnings at cheap valuations. Gibson notes that “both the earnings and the securities of reorganized roads have advanced much more rapidly than those of the sound and solvent properties.”, which is displayed below:13

The fiercely negative view of reorganized railroads like the Atchison after 1893 is characterized by one journalist definitively stating that Atchison was “hopelessly bankrupt”.14 Another article argued:
“The ‘Railroad Gazette’ of New York takes a decidedly unfavorable view of the plan for the reorganization of the Atchison Railway. It objects that ‘the control of the railroad is left in the hands of the two classes of stockholders, the preferred slightly in the majority, but a preferred stock which is not likely ever to earn honestly more than 2% dividends, and a common stock which will never earn anything honestly’… in the opinion of our contemporary, an old-fashioned foreclosure, wiping out fictitious values, would have been the most merciful in the end.”15
The bias against railroad stocks became problematic as it clouded investors’ decision-making process since, in reality, Atchison’s reorganization was progressing very well. The company was significantly improving as management cut costs, made routes more efficient by transporting larger loads on fewer trains, and closed redundant lines.
“In the case of the Atchison there was an increase in the year's traffic receipts of $5,591,000, while the working expenditure was actually $85,000 less than for 1898-1899, the cost of maintaining the road and structures exhibiting a decline of as much as $1,318,000, owing, it is stated, to a considerable reduction in the train mileage, rendered possible by the better loading of cars and the lengthening of trains.”16
All this, of course, had a meaningful impact on the bottom line:17
There reached a point where investors could no longer ignore the obvious and had to recognize that their prejudice against railroad stocks may have been overly harsh. In 1898, as stock prices began to recover, one commentator stated:
“The upward movement is not at all surprising, for the shrinkage in market valuations from which the rally has taken place was in many cases utterly excessive.”18
Railroad stocks crept back into favor and went on a tear from 1898 to 1901. In fact, reorganized railroads were the strongest performers. Gibson wrote:
“As to stock prices, if we assume that about $10,000 was in 1898 devoted to the purchase of either of the two standard dividend-paying roads which were at that time considered the highest grade stocks on the list, as compared with an equal sum placed in the stocks of three reorganized roads, the stocks being disposed of in 1901, we get the following results…”19
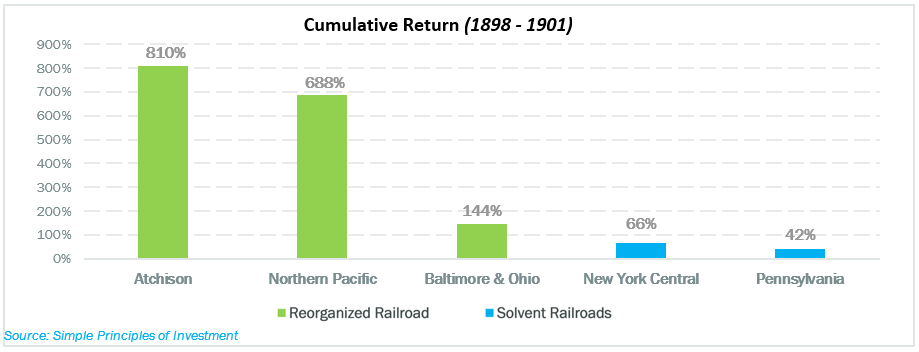
However, as the author points out:
“If any prophet had been bold enough to suggest in 1898 that Baltimore and Ohio, Atchison and Northern Pacific would in three short years be dividend payers selling around or above par he would have been popularly considered a fit subject for an inquirendo lunatic [lunatic assessment].”20
Some 30 years earlier, a different investor made an equally harsh description of value stocks, calling them “rubbish” and “unconsidered trifles”:21
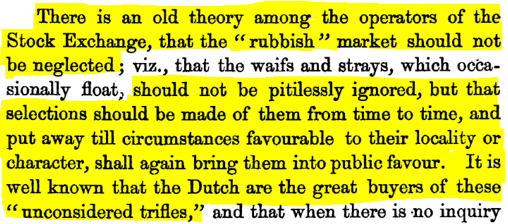
As the second excerpt notes, value stocks “should not be neglected”, as “circumstances favorable to their locality or character, shall again bring them into public favor.” Again, this is describing mean reversion.
While an investment strategy focused on finding “rubbish” stocks sounds like sheer lunacy, it is also the reason it works. Value investing is a profitable and time-tested strategy because these “rubbish” stocks often turn out to be good companies that were thrown away too quickly, or by mistake. As the market realizes its error and stock prices revert to their fair value, value investors reap the rewards.
The Lesson for Value Investors
In such challenging times for value investors and allocators, historical context is vital for good decision-making. Despite the deluge of articles claiming “value investing no longer works”, there is a reason that this approach has existed for centuries, with the first value fund opening in 1779.22 Within the roughly 250-year history of value investing, the current 13-year bout of underperformance is a blip. In fact, a previous OSAM paper discusses a similar period of sustained underperformance from 1926 to 1941, with Value stocks going on to significantly outperform.
However, when personally experiencing challenging market environments or events, it’s easy to believe “it’s actually different this time.” In the vast majority of cases, though, it’s not.
In the 19th century, value investors were deemed lunatics for buying railroad stocks after a series of railroad booms and busts. Especially those that were in receivership just a few years prior. What they noticed and that market had not yet figured out, however, was that the businesses behind these stocks were improving. These ‘lunatics’ were eventually proven right and had the returns to back it up. In 2020, value investors can also seem crazy, and after thirteen years of underperformance, this is understandable. However, value investing has weathered market forces for centuries. So yes, the market may be “different this time”, but purchasing stocks at discounted prices still makes sense to us.
A BRIEF HISTORY OF VALUATION
For centuries, value investors have understood the relationship between a stock’s valuation, and future returns. What has changed is how investors decide if a company is “cheap”. In Valuation of Equity Securities: History, Theory and Application, Geoffrey Poitras marks the significant transitions in equity valuation. A few key moments are outlined below:23
Before 1850: Fixed Income Methods
“The earliest issues of equity securities involved the use of valuation methods developed for fixed income securities to determine the ‘intrinsick’ value of the stock… The shortcoming with using fixed income methods to value common stock is that the dividend is not fixed over time.”
Mid-19th Century: Introduction of Discounted Cash Flows (DCF)
“Advanced valuation methodologies permitted the future cash flows associated with the asset being valued to vary over time… a U.K. mining engineer, William Armstrong (1811–1896), used discounted cash flow methods to value mining company issues and mining leases… Todhunter (1901) modelled the common stock price using a perpetuity with a constant growth rate, determining the pricing solution with an infinite number of dividend payments.”
Entering the 20th Century: Using Dividends
“The dividend yield was considered to be the most important measure of equity security value, especially for investment grade stocks… The convention was to measure the value of common stock relative to bonds: being the most junior of all securities with the greatest variability of cash flow common stock required the highest yield among the securities on offer from a given corporation… Dividends paid were the most visible and reliable source of information about firm performance.”
1924: Transition from Dividends to Earnings Based Models
“Smith (Common Stocks as Long-Term Investments) arguably marks the beginning of the transition from equity valuation based on dividend yields to equity valuation based on earnings… Smith changed the perception of the importance of earnings relative to dividends… superior presentation of accounting information by United States as compared to U.K. and European companies, e.g., in the reporting of consolidated versus unconsolidated earnings, also facilitated the use of valuations based on earnings as opposed to dividends.”
Since superior accounting information prompted this last transition from dividends to earnings, we know that earnings-based valuation metrics have remained popular, with Price-to-Earnings (P/E) being one of the most widely used.
THE PROBLEMS WITH PRICE TO BOOK
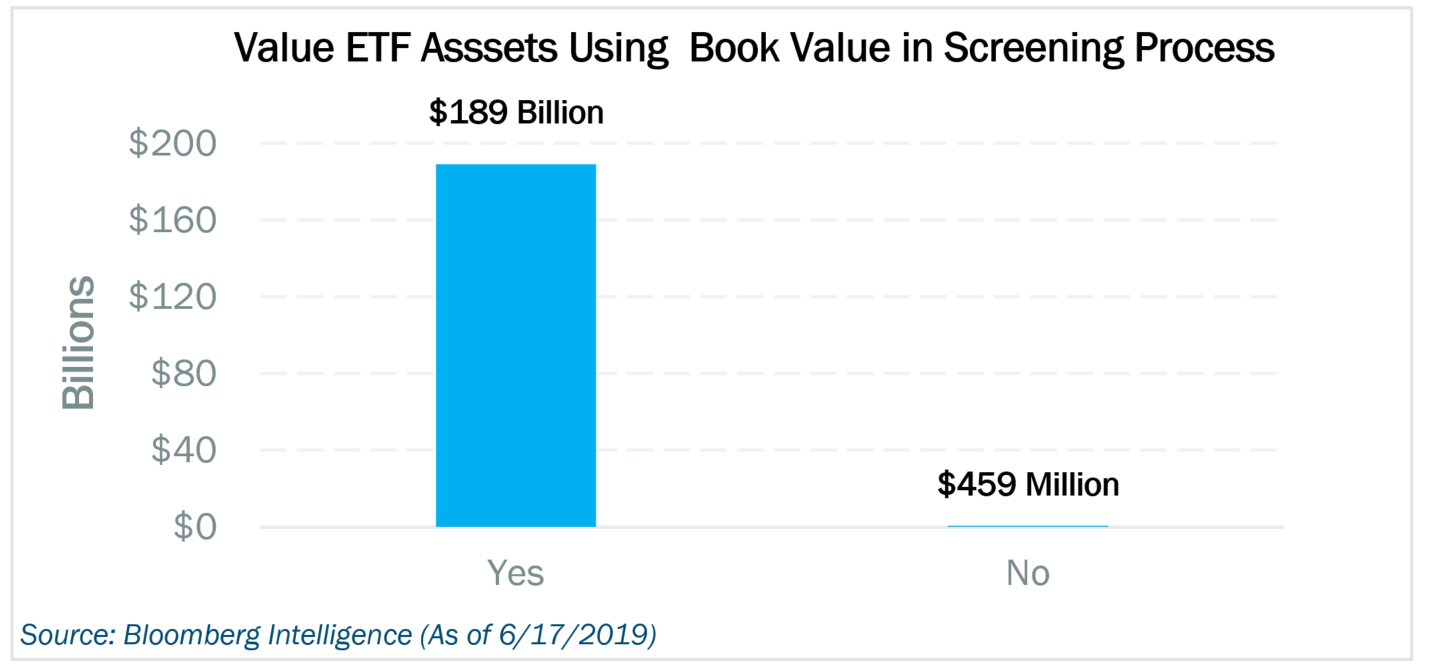
While valuation metrics and models have evolved over time as accounting information, data, company profiles, and markets change, there is one value factor that has curiously lived on, despite becoming increasingly irrelevant. This vestigial factor is Price-to-Book. In fact, the problems with book value have been highlighted since at least 1935:24

Alarmingly, however, the majority of value-oriented strategies incorporate this outdated value factor. This is particularly stark in the case of Value ETFs:
As the previous section showed, new accounting standards and information spurred the transition from dividend-based to earnings-based valuations in the early 20th century. A similar dynamic has unfolded in recent years, but many investors have stuck with the outdated model.
In OSAM’s white paper, Negative Equity, Veiled Value, and the Erosion of Price-to-Book, Travis Fairchild demonstrates how book value is not keeping up with the times and highlights similar points to those in the 1935 book above.
“Balance sheets prepared under generally accepted accounting principles (GAAP) are doing an increasingly poor job of reflecting the value of shareholders equity. Recent trends have tended to bias assets well below market value which has led to the increased frequency of negative equity and Veiled Value stocks. Those tend to fall into three main categories…
1) Understated Intangible Assets: Brand names, human capital, advertising, and research and development (R&D) are rarely represented on the balance sheet
2) Understated Long Term Assets: Assets are often depreciated faster than their useful lives
3) Buybacks and Dividends: When buybacks and dividends exceed net income, they create a decrease in equity which can accelerate distortions”
WHAT NOW? THE FUTURE OF VALUE
Value investing is a centuries old philosophy that is constantly evolving. The key to remaining a successful value investor, therefore, is constantly researching, validating, and testing value factors and strategies so that your approach does not become outdated like Price-to-Book. As new data sets and technology becomes available, the opportunity for alpha within the value factor grows.
At OSAM, we have followed this guiding principle through the following projects and insights:
- Machine Learning: Used to construct our Deep History database, which added 30 years of history for fundamental analysis that was previously unavailable. Conducting further research in areas like machine valuation, predicting earnings, and more.
- OSAM Research Partners: “Jesse Livermore+’s” research on corporate profitability led to an improvement in how we measure a company’s growth profile. To summarize: free cash flow works well alongside side earnings as the “profit” measure inside of factors like return on capital, per share growth, and profitability breakouts (above or below a company’s historical trendline).
- Corporate Innovation: By conducting an in-depth research project on patent data, we found that monitoring and applying innovation factors can give investors insight into leading indicators of potential fundamental growth and stock performance not captured by traditional financial metrics used today.
Value investing has a long history, a bright future, and OSAM maintains its conviction in the factor going forward.
Appendix
1 Manchester University, Methodist Archives and Research Centre, MAM FL1.8/10
2 Anne L. Murphy, How to Speculate According to the ‘Merchant Principle’ (December 11, 2017)
3 Manchester University, Methodist Archives and Research Centre, MAM FL1.8/10
4 James Chanos & James Spellman, George Hudson, Yale School of Management Case Study #11-042, (December 2011)
5 Ibid.
6 https://www.adamsmith.org/blog/a-panic-started-a-depression
7 Christopher Cotter, Railroad Defaults, Land Grants, and the Panic of 1873 (July 30, 2015)
8 Ibid.
9 http://www.self.gutenberg.org/articles/eng/Panic_of_1893
10 https://money.cnn.com/galleries/2007/news/0705/gallery.bubbles/2.html
11 John Kenneth Galbraith, Money: Whence It Came, Where It Went, (Princeton, 2017) pg. 123
12 Thomas Gibson, Simple Princples of Investment, (New York, 1919) pg. 121
13 Ibid.
14 ‘Unprofitable Investments-American Railway Shares.’ The Economist (September 15, 1894)
15 ‘An American View of the Atchison Reorganisation’. The Economist (May 4, 1895)
16 American Railroad Results, The Economist, (October 6, 1900)
17 Ibid.
18 The Recovery in American Railroad Securities. The Economist, (May 7, 1898)
19 Thomas Gibson, Simple Princples of Investment, (New York, 1919) pg. 122
20 Ibid., pg. 123
21 David Morier Evans, Speculative Notes, and Notes on Speculation, Ideal and Real, (London, 1864) pg. 101
22 Discussed in Factor Archives: Shareholder Yield. Research from Geert Rouwenhorst, ‘The Origins of Mutual Funds’ (December 2004). Yale ICF Working Paper No. 04-48.
23 Geoffrey Poitras, Valuation of Equity Securities: History, Theory and Application, (London, 2011)
24 Spencer B. Meredith, What the Figures Mean, (New York, 1935) pg. 128
Canvas Important Disclosure Information
Please Note: Manager returns and holdings supplied by multiple sources, including but not limited to: Morningstar Direct, CapIQ, and from independent unaffiliated Registered Investment Advisers. Manager returns have been presented net of a hypothetical fee. Please remember that past performance is no guarantee of future results. Different types of investments involve varying degrees of risk, and there can be no assurance that the future performance of any specific investment, investment strategy, or product made reference to directly or indirectly in this presentation will be profitable, equal any corresponding indicated historical performance levels, or be suitable for any portfolio. Due to various factors, including changing market conditions, the content may no longer be reflective of current opinions or positions. Moreover, you should not assume that any discussion or information contained in this presentation serves as the receipt of, or as a substitute for, individualized investment advice from the Manager and any investment or investment strategy resulting from the use of the CANVAS™ platform, will be profitable, equal any historical performance level(s), be suitable for any specific investor or individual situation, or prove successful. In preparing this presentation, the Manager has relied upon information provided to it by other third-party service providers; moreover, this information has NOT been independently verified, and the Manager is NOT affiliated with any of the suppliers of this presentation information. Moreover, if we are not able to map all the holdings of external third-party fund managers this data may be incomplete. The Manager is neither a law firm nor a certified public accounting firm, and no portion of this presentation content should be construed as legal or accounting advice. To the extent that a reader has any questions regarding the applicability of any specific issue discussed above to his/her individual situation, he/she is encouraged to consult with the professional advisor of his/her choosing. The Manager, O’Shaughnessy Asset Management, LLC, is a Registered Investment Advisor with the SEC and a copy of its current written disclosure statement discussion its advisory services and fees remains available for your review upon request or at www.osam.com.
Please also note: On the CANVAS™ platform there are areas of analysis that are based on backtested data. The structure of the analysis lists the OSAM back-tested allocation (for example, under Portfolio A) against the applicable benchmark (similarly under Portfolio B).
The CANVAS™ platform is an interactive technological-based investment tool that permits an investment professional to analyze a desired investment or investment strategy (the “Strategy[ies]”) for the professional’s client. At all times, the investment professional, and not OSAM, is responsible for: (1) maintaining the initial and ongoing relationship with the underlying client; (2) determining the initial and ongoing suitability for the Strategy[ies]; (3) devising or determining the specific initial and ongoing desired Strategy[ies]; (4) monitoring performance of the Strategy[ies]; and (5) modifying and/or terminating the Strategy[ies]. At no time shall OSAM have any responsibility for: (1) making any determination as to the initial or ongoing suitability of any Strategy for any specific investor, including the professional’s client; (2) monitoring the Strategy[ies]; or (3) the performance of the Strategy[ies].
Both the investment professional, and the investment professional’s client, must accept that the use of the CANVAS™ platform does not serve as the receipt of, or as a substitute for, personalized investment advice from OSAM. To the contrary, OSAM is not providing any such personalized investment advice.
Historical performance results for investment indices, benchmarks, and/or categories have been provided for general informational/comparison purposes only, and generally do not reflect the deduction of transaction and/or custodial charges, the deduction of an investment management fee, nor the impact of taxes, the incurrence of which would have the effect of decreasing historical performance results. An investor’s account holdings shall not correspond directly to any comparative indices or categories. Please Also Note: (1) comparative benchmarks/indices may be more or less volatile than the Strategy[ies]; and, (2) a description of each comparative benchmark/index is available upon request.
OSAM Back-Tested Portfolio-Material Limitations: OSAM does not currently utilize the reflected Portfolio in managing actual client accounts. However, the Portfolio results may materially differ from actual client results based upon various factors. The underlying components of each Portfolio and the corresponding asset allocation percentages were and are subject to change on an ongoing basis. Please see Hypothetical/Material Limitations below.
Please Note: Hypothetical/Material Limitations-performance for the Strategies reflect hypothetical, back-tested results, that were achieved by means of the retroactive application of a back-tested portfolio and, as such, the corresponding results have inherent limitations, including: (a) the results do not reflect actual trading using investor assets, but were achieved by means of the retroactive application of the devised Strategy, certain aspects of which may have been designed with the benefit of hindsight; and, (b) back tested performance may not reflect the impact that any material market or economic factors might have had on the investment professional’s use of the hypothetical portfolio if the portfolio had been used during the period to actually mange investor assets. Moreover, reports may be generated that may compare back-tested information to live client holding information. Additionally, these reports may back-fill some of the clients’ live fund information with similar fund information to achieve a more complete historical comparison. Please Also Note: The deduction of an investment management fee would reduce the reflected results. For example, the deduction of a 1% management over a 10-year period would reduce a 10% annual gross return to an 8.9% net return.
A copy of OSAM’s current written disclosure Brochure is directly accessible via link at www.osam.com.
ACKNOWLEDGMENT: The investment professional acknowledges the CANVAS™ platform limitations, and agrees to release, defend, indemnify and hold OSAM harmless from any claims or controversies (including those alleged by a professional’s client) arising from, or attributable to, the professional’s use of the CANVAS™ platform.


